Viewing protection information
On the Statistics tab, you can view aggregated protection information, represented as a set of charts, about the computers of all your clients. The charts help you to manage the state of your network by allowing you to observe statistical information about the computers. You can monitor protection statuses of computers in the network by viewing information provided by Kaspersky Security Plug-in for ConnectWise Automate. For example, you can immediately detect how many computers in the network are in the critical state or have outdated anti-virus databases.
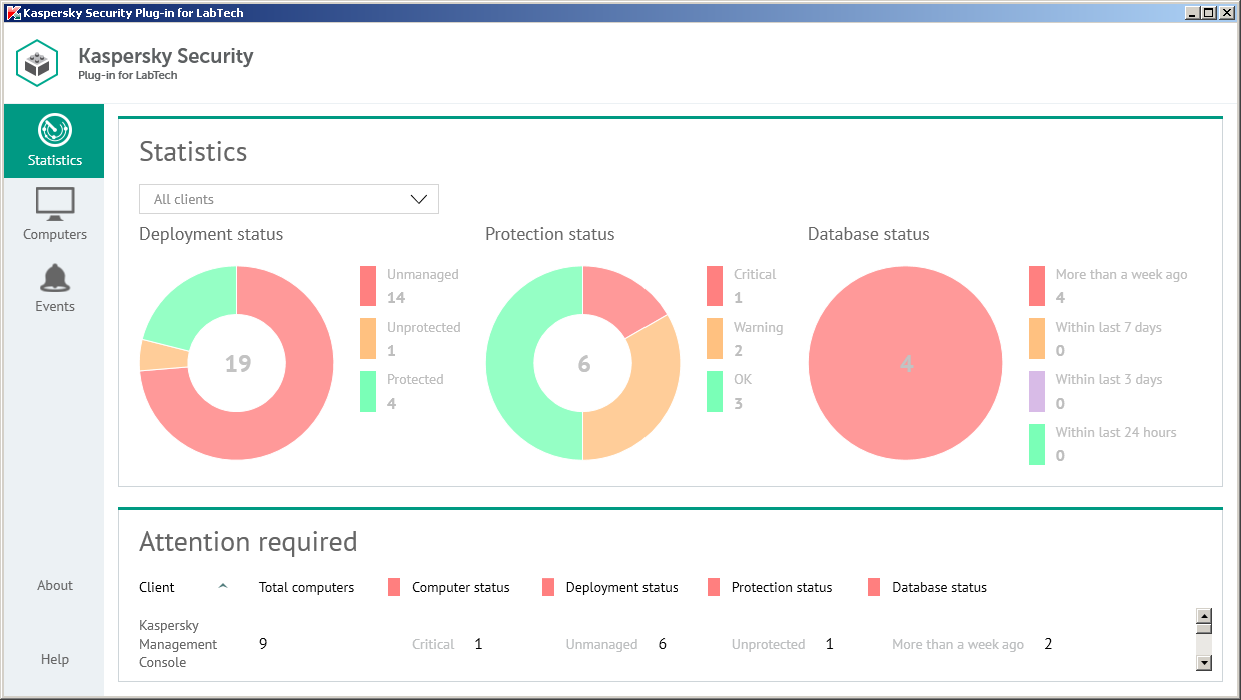
The following pie charts provide snapshots of several aspects of computer protection:
- Protection status—Displays the total number of computers, managed by Kaspersky Security Center or Kaspersky Endpoint Security Cloud (depending on the solution you use), which take the following protection statuses: Critical, Warning, or OK.
In the middle of the chart, the total number of managed computers is displayed. To the right of the chart the number of computers with each status is displayed, allowing you to instantly know the number of critical or warning computers in the network.
- Deployment status—Displays the total number of the computers managed by ConnectWise Automate, which have the following deployment statuses:
- Unmanaged—Kaspersky Security Center Network Agent is not installed (computers are not managed by Kaspersky Security Center or Kaspersky Endpoint Security Cloud).
- Unprotected—Kaspersky Security Center Network Agent is installed (computers are managed by Kaspersky Security Center or Kaspersky Endpoint Security Cloud), but Kaspersky Endpoint Security is not installed.
- Protected—Both Kaspersky Security Center Network Agent and Kaspersky Endpoint Security are installed.
In the middle of the pie chart, the total number of computers is displayed. To the right of the chart you can view details on how many computers with each status you have in the network.
- Database status—Displays the total number of computers (managed by Kaspersky Security Center) on which Kaspersky Endpoint Security is installed, categorized by time since the last anti-virus database issue.
In the middle of the pie chart, the total number of protected computers is displayed. To the right of the chart you can view the number of computers in each group. This allows you to see the number of computers on which the anti-virus databases were issued a long time ago.
You can filter information displayed in the charts by client and location.
To filter information displayed,
In the Clients drop-down list, select a client or location you want to view.
In the Attention required section below the charts, you can also view statistics on clients that have computers requiring your attention. This section shows information on the number of computers in the network of client companies that require your attention. These are the computers with the following statuses:
- Critical protection status.
- Unmanaged and Unprotected deployment status.
- Anti-virus databases were issued more than a week ago database status.