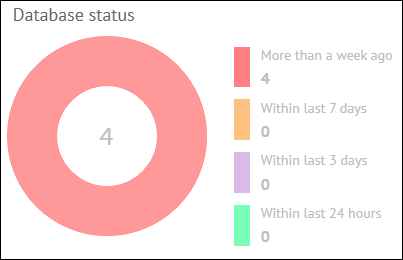
Database status chart
The Database status chart displays the total number of computers (managed by Kaspersky Security Center or Kaspersky Endpoint Security Cloud) on which a real-time protection solution by Kaspersky Lab is installed, categorized according to the time since the anti-virus databases being used were issued.
Database status chart
In the middle of the pie chart, the total number of protected computers is displayed. To the right of the chart, the legend shows the number of computers in each group. This allows you to see the number of computers that use anti-virus databases issued a long time ago.
When you click any database status color icon in the chart legend or in any color sector of the pie chart, a window opens showing details about the computers with the selected database status.
The following information is displayed for each computer:
- Computer—Name of the computer. The computer name can be different in ConnectWise Automate and in the Kaspersky Lab solution. The computer name for ConnectWise Automate is displayed above and the name for Kaspersky Security Center / Kaspersky Endpoint Security Cloud is displayed below. When you click the computer name, the Computer Management screen of ConnectWise Automate Control Center is displayed for this computer.
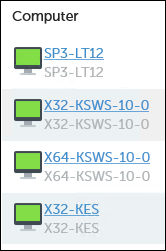
Computer names
- Client / Location—Name of the ConnectWise Automate client and location that the computer belongs to.
- Workspace—If you use Kaspersky Endpoint Security Cloud, this field shows the name of the workspace to which the selected computer belongs. When you click the workspace name, the corresponding Kaspersky Endpoint Security Cloud workspace opens in your browser window.