Contents
- About Kaspersky Unified Monitoring and Analysis Platform
- Program architecture
- Installing and removing KUMA
- Program licensing
- About the End User License Agreement
- About the license
- About the License Certificate
- About the license key
- About the key file
- Adding a license key to the program web interface
- Viewing information about an added license key in the program web interface
- Removing a license key in the program web interface
- Integration with other solutions
- Integration with Kaspersky Security Center
- Integration with Kaspersky CyberTrace
- Integration with Kaspersky Threat Intelligence Portal
- Integration with R-Vision Incident Response Platform
- Integration with Active Directory
- Integration with RuCERT
- Integration with Security Vision Incident Response Platform
- KUMA resources
- KUMA services
- Analytics
- Working with tenants
- Working with incidents
- About the incidents table
- Saving and selecting incident filter configuration
- Deleting incident filter configurations
- Viewing detailed incident data
- Incident creation
- Incident processing
- Changing incidents
- Automatic linking of alerts to incidents
- Categories and types of incidents
- Exporting incidents to RuCERT
- Working in hierarchy mode
- Working with alerts
- Working with events
- Retroscan
- Managing assets
- Managing KUMA
- Contacting Technical Support
- REST API
- Creating a token
- Authorizing API requests
- Standard error
- Operations
- Viewing a list of active lists on the correlator
- Import entries to an active list
- Searching alerts
- Closing alerts
- Searching assets
- Importing assets
- Deleting assets
- Searching events
- Viewing information about the cluster
- Resource search
- Loading resource file
- Viewing the contents of a resource file
- Importing resources
- Exporting resources
- Downloading the resource file
- Search for services
- Tenant search
- View token bearer information
- Appendices
- Commands for components manual starting and installing
- Normalized event data model
- Correlation event fields
- Audit event fields
- Event fields with general information
- User was successfully signed in or failed to sign in
- User login successfully changed
- User role was successfully changed
- Other data of the user was successfully changed
- User successfully logged out
- User password was successfully changed
- User was successfully created
- User access token was successfully changed
- Service was successfully created
- Service was successfully deleted
- Service was successfully reloaded
- Service was successfully restarted
- Service was successfully started
- Service was successfully paired
- Service status was changed
- Storage index was deleted by user
- Storage partition was deleted automatically due to expiration
- Active list was successfully cleared or operation failed
- Active list item was successfully deleted or operation was unsuccessful
- Active list was successfully imported or operation failed
- Active list was exported successfully
- Resource was successfully added
- Resource was successfully deleted
- Resource was successfully updated
- Asset was successfully created
- Asset was successfully deleted
- Asset category was successfully added
- Asset category was deleted successfully
- Settings were updated successfully
- Information about third-party code
- Trademark notices
- Glossary
About Kaspersky Unified Monitoring and Analysis Platform
Kaspersky Unified Monitoring and Analysis Platform (hereinafter KUMA or "program") is an integrated software solution that includes the following set of functions:
- Receiving, processing, and storing information security events.
- Analysis and correlation of incoming data.
- Search within the obtained events.
- Creation of notifications upon detecting symptoms of information security threats.
The program is built on a microservice architecture. This means that you can create and configure the relevant microservices (hereinafter also "services"), thereby making it possible to use KUMA both as a log management system and as a full-fledged SIEM system. In addition, flexible data streams routing allows you to use third-party services for additional event processing.
What's new
- Added support for hierarchical deployment of independent installations of KUMA.
- Added capabilities for working with an elastic, SQL-like query language when searching the events database.
- Added capability for seamless navigation from dashboard widgets to source events, alerts, and incidents.
- Added support for new SQL connectors that can receive events from the following databases:
- Oracle
- Firebird
- Added support for importing information about assets and vulnerabilities from MaxPatrol 8.
- Added support for the Astra Linux Special Edition operating system.
- Added Dashboard-to-TV display mode.
- Improved support for sources that require authorization – added capability for authorization by login/password and by certificate.
- Added support for hot keys.
- Newly added out-of-the-box sources of events: FreeIPA, FortiGate (events in key-value format), Huawei USG – SECLOG and SHELL events, improved normalizers for KSC and CISCO FWSM (Firewall Services Module).
Distribution kit
The distribution kit includes the following files:
- kuma-ansible-installer-<build number>.tar.gz to install KUMA components;
- files containing information about the version (release notes) in Russian and English.
Hardware and software requirements
Recommended hardware requirements
The hardware listed below will ensure an event-processing capacity of 40,000 events per second. This figure depends on the type of parsed events and efficiency of the parser. Consider also that it is more efficient to have more cores than a lower number of cores with higher CPU frequency.
- Servers to install collectors:
- CPU: Intel or AMD with at least 4 cores (8 threads) and support for the SSE 4.2 instruction set or 8 vCPU (virtual processors).
- RAM: 16 GB
- Disk: 500 GB of available disk space mounted on /opt
- Servers to install correlators:
- CPU: Intel or AMD with at least 4 cores (8 threads) and support for the SSE 4.2 instruction set or 8 vCPU (virtual processors)
- RAM: 16 GB
- Disk: 500 GB of available disk space mounted on /opt
- Servers to install the Core:
- CPU: Intel or AMD with at least 4 cores (8 threads) and support for the SSE 4.2 instruction set or 4 vCPU (virtual processors)
- RAM: 16 GB
- Disk: 500 GB of available disk space mounted on /opt
- Servers to install storages:
- CPU: Intel or AMD with at least 12 cores (24 threads) and support for the SSE 4.2 instruction set or 24 vCPU (virtual processors).
Support is required for SSE4.2 commands.
- RAM: 48 GB
- Disk: 500 GB of available disk space mounted on /opt
Using SSDs highly improves cluster node indexing and search efficiency.
Local mounted HDD/SSD are more efficient than external JBODs. RAID 0 is recommended for faster performance, while RAID 10 is recommended for redundancy.
To increase reliability, it is not recommended to deploy all cluster nodes on a single JBOD or single physical server (if virtual servers are used).
To increase efficiency, we recommend keeping all servers in a single data center.
- CPU: Intel or AMD with at least 12 cores (24 threads) and support for the SSE 4.2 instruction set or 24 vCPU (virtual processors).
- Machines to install Windows agents:
- Processor: single-core, 1.4 GHz or higher
- RAM: 512 MB
- Disk: 1 GB
- OS:
- Microsoft Windows 2012
- Microsoft Windows Server 2012 R2
- Microsoft Windows Server 2016
- Microsoft Windows Server 2019
- Microsoft Windows 10 (20H1, 20H2, 21H1)
- Machines to install Linux agents:
- Processor: single-core, 1.4 GHz or higher
- RAM: 512 MB
- Disk: 1 GB
- OS:
- Ubuntu 20.04 LTS, 21.04
- Oracle Linux version 8.4 or later
- Astra Linux Special Edition RUSB.10015-01 (update 1.7.1)
Software requirements
Each server that is used to install KUMA services must have one of the following operating systems installed: Astra Linux Special Edition RUSB.10015-01 (update 1.7.1) or Oracle Linux version 8.4 or later.
Network requirements
The network interface bandwidth must be at least 100 Mbps.
For KUMA to be able to process more than 20,000 events per second, ensure a data transfer speed of at least 10 Gbps between ClickHouse nodes.
Additional requirements
For computers used for the KUMA web interface, Google Chrome browser version 93 or later, or Mozilla Firefox browser version 92 or later must be installed.
Page top
KUMA interface
The program is managed through the web interface.
The window of the program web interface contains the following items:
- Sections in the left part of the program web interface window
- Tabs in the upper part of the program web interface window for some sections of the program
- Workspace in the lower part of the program web interface window
The workspace displays the information that you choose to view in the sections and on the tabs of the program web interface window. It also contains management elements that you can use to configure how the information is displayed.
While working with the program web interface, you can use hot keys to perform the following actions:
- In all sections: close the window that opens in the right side pane—Esc
- In the Events section:
- Switch between events in the right side pane—↑ and ↓.
- Start a search (when focused on the query field)—Command/Control + Enter.
- Save a search query—Control/Command + S.
Compatibility with other applications
Kaspersky Endpoint Security for Linux
If the components of KUMA and Kaspersky Endpoint Security for Linux are installed on the same server, the report.db directory may grow very large and even take up the entire drive space. To avoid this problem, the following is recommended:
- Upgrade Kaspersky Endpoint Security for Linux to version 11.2.2.5324.
- Add the following directories to general exclusions and to on-demand scan exclusions:
- /opt/kaspersky/kuma/clickhouse/data/store/
- /opt/kaspersky/kuma/victoria-metrics/
- /var/lib/rsyslog/imjournal.state
For more details on scan exclusions, please refer to the Kaspersky Endpoint Security for Linux Online Help Guide.
Program architecture
The standard program installation includes the following components:
- One or more Collectors that receive messages from event sources and parse, normalize, and, if required, filter and/or aggregate them.
- A Correlator that analyzes normalized events received from Collectors, performs the necessary actions with active lists, and creates alerts in accordance with the correlation rules.
- The Core that includes a graphical interface to monitor and manage the settings of system components.
- The Storage, which contains normalized events and registered incidents.
Events are transmitted between components over optionally encrypted, reliable transport protocols. You can configure load balancing to distribute load between service instances, and it is possible to enable automatic switching to the backup component if the primary one is unavailable. If all components are unavailable, events are saved to the hard disk buffer and sent later. The buffer disk size for temporary event storage can be adjusted.
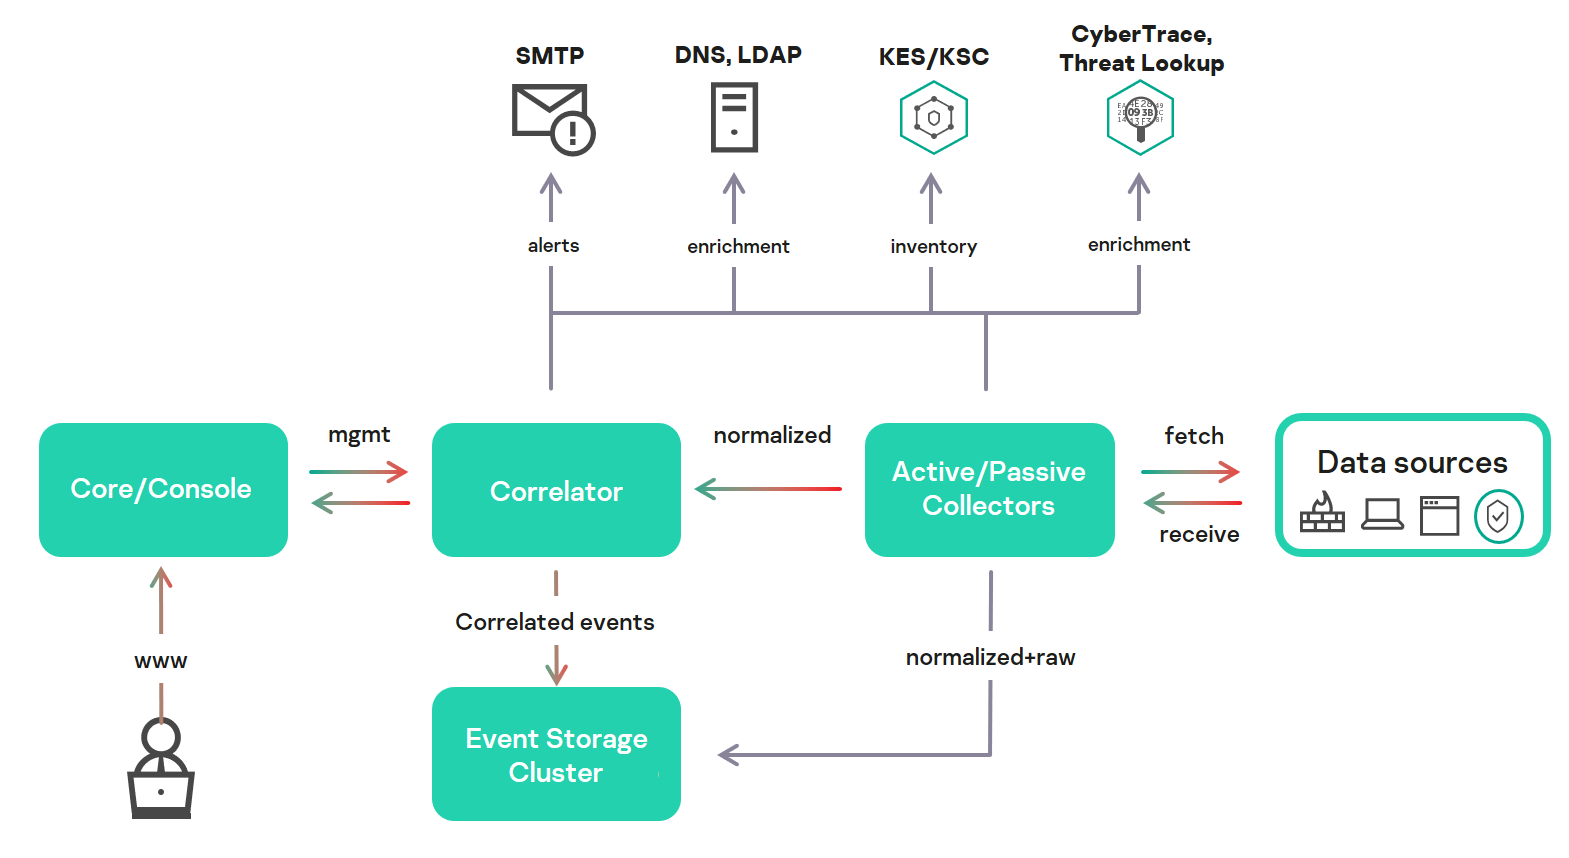
KUMA architecture
Core
The Core is the central component of KUMA that serves as the foundation upon which all other services and components are built. It provides a graphical user interface that is intended for everyday use by operators/analysts and for configuring the entire system.
The Core allows you to:
- create and configure services, or components, of the program, as well as integrate the necessary software into the system;
- manage program services and user accounts in a centralized way;
- visualize statistical data on the program;
- investigate security threats based on the received events.
Collector
A collector is an application component that receives messages from event sources, processes them, and transmits them to a storage, correlator, and/or third-party services to identify alerts.
For each collector, you need to configure one connector and one normalizer. You can also configure an unlimited number of additional Normalizers, Filters, Enrichment rules, and Aggregation rules. To enable the collector to send normalized events to other services, specific destinations must be added. Normally, two destinations are used: the storage and the correlator.
The collector operation algorithm includes the following steps:
- Receiving messages from event sources
To receive messages, you must configure an active or passive connector. The passive connector can only receive messages from the event source, while the active connector can initiate a connection to the event source, such as a database management system.
Connectors can also vary by type. The choice of connector type depends on the transport protocol for transmitting messages. For example, for an event source that transmits messages over TCP, you must install a TCP type connector.
The program has the following connector types available:
- internal
- tcp
- udp
- netflow
- nats
- kafka
- http
- sql
- file
- ftp
- nfs
- wmi
- wec
- snmp
- Event parsing and normalization
Events received by the connector are processed using the parser and normalization rules set by the user. The choice of normalizer depends on the format of the messages received from the event source. For example, you must select a CEF-type root normalizer for a source that sends events in CEF format.
The following normalizers are available in the program:
- JSON
- CEF
- Regexp
- Syslog (as per RFC3164 and RFC5424)
- CSV
- Key-value
- XML
- NetFlow v5
- NetFlow v9
- IPFIX (v10)
- Filtering of normalized events
You can configure filters that allow you to select only the events that satisfy the specified conditions for further processing. Events that do not meet the filtering conditions are eliminated at this stage and are not processed further.
- Enrichment and conversion of normalized events
Enrichment rules let you to supplement event contents with information from internal and external sources. The program has the following enrichment sources:
- constant
- cybertrace
- dictionary
- dns
- event
- ldap
- template
Mutation rules let you convert event contents in accordance with the defined criteria. The program has the following conversion methods:
- lower—converts all characters to lower case.
- upper—converts all characters to upper case.
- regexp—extracts a substring using RE2 regular expressions.
- substring—selects text strings by specified item numbers.
- replace—replaces text with the entered string.
- trim—deletes the specified characters.
- append—adds characters to the end of the field value.
- prepend—adds characters to the beginning of the field value.
- Aggregation of normalized events
You can configure aggregation rules to reduce the number of similar events that are transmitted to the storage and/or the correlator. For example, you can aggregate into one event all messages about network connections transmitted over the same protocol (transport and application layers) between two IP addresses and received during a specified time interval. If aggregation rules are configured, multiple events will be processed and saved as a single event. This helps you reduce the load on the services responsible for further event processing, saves you storage space, and reduces events processed per second (EPS) count.
- Transmission of normalized events
After all the processing stages are completed, the event is sent to configured destinations.
Correlator
The Correlator is a program component that analyzes normalized events. Information from active lists and/or dictionaries can be used in the correlation process.
The data obtained by analysis is used to carry out the following tasks:
- Alert detection.
- Notification about detected incidents.
- Active lists content management.
- Sending correlation events to configured destinations.
Event correlation is performed in real time. The operating principle of the correlator is based on an event signature analysis. This means that every event is processed according to the correlation rules set by the user. When the program detects a sequence of events that satisfies the conditions of the correlation rule, it creates a correlation event and sends it to the Storage. The correlation event can also be sent to the correlator for repeated analysis, which allows you to customize the correlation rules so that they are triggered by the results of a previous analysis. Products of one correlation rule can be used by other correlation rules.
You can distribute correlation rules and the active lists they use among correlators, thereby sharing the load between services. In this case, the collectors will send normalized events to all available correlators.
The Correlator operation algorithm has the following steps:
- Obtaining an event
The correlator receives a normalized event from the collector or from another service.
- Applying correlation rules
You can configure correlation rules so they are triggered based on a single event or a sequence of events. If no alert was detected using the correlation rules, the event processing ends.
- Responding to an alert
You can specify actions that the program must perform when an alert is detected. The following actions are available in the program:
- Event enrichment
- Operations with active lists
- Sending notifications
- Storing correlation event
- Sending a correlation event
When the program detects a sequence of events that satisfies the conditions of the correlation rule, it creates a correlation event and sends it to the storage. Event processing by the correlator is now finished.
Storage
A KUMA storage is used to store normalized events so that they can be quickly and continually accessed from KUMA for the purpose of extracting analytical data. Access speed and continuity are ensured through the use of the ClickHouse technology. This means that a storage is a ClickHouse cluster bound to a KUMA storage service.
Storage components: clusters, shards, replicas, and keepers.
When choosing a ClickHouse cluster configuration, consider the specific event storage requirements of your organization. For more information, please refer to the ClickHouse documentation.
In repositories, you can create spaces. The spaces enable to create a data structure in the cluster and, for example, store the events of a certain type together.
Page top
About tenants
KUMA has a multitenancy mode in which one instance of the KUMA application installed in the infrastructure of the main organization (main tenant) enables isolation of branches (tenants) so that they receive and process their own events.
The system is managed centrally through the main interface while tenants operate independently of each other and have access only to their own resources, services, and settings. Events of tenants are stored separately.
Users can have access to multiple tenants at the same time. You can also select which tenants' data will be displayed in sections of the KUMA web interface.
In KUMA, two tenants are created by default:
- The main tenant contains resources and services related to the main tenant. These resources are available only to the general administrator.
- The shared tenant is where the general administrator can place resources, asset categories, and monitoring policies that users of all tenants will be able to utilize.
About events
Events are instances of the security-related activities of network assets and services that can be detected and recorded. For example, events include login attempts, interactions with a database, and sensor information broadcasts. Each separate event may seem meaningless, but when considered together they form a bigger picture of network activities to help identify security threats. This is the core functionality of KUMA.
KUMA receives events from logs and restructures their information, making the data from different event sources consistent (this process is called normalization). Afterwards, the events are filtered, aggregated, and later sent to the correlator service for analysis and to the Storage for retaining. When KUMA recognizes specific event or a sequences of events, it creates correlation events, that are also analyzed and retained. If an event or sequence of events indicates a potential security threat, KUMA creates an alert. This alert consists of a warning about the threat and all related data that should be investigated by a security officer.
Throughout their life cycle, events undergo conversions and may receive different names. Below is a description of a typical event life cycle:
The first steps are carried out in a collector.
- Raw event. The original message received by KUMA from an event source using a Connector is called a raw event. This is an unprocessed message and it cannot be used yet by KUMA. To fit into the KUMA pipeline, raw events must be normalized into the KUMA data model. That's what the next stage is for.
- Normalized event. A normalizer is a set of parsers that maps raw events into KUMA data model. After this conversion, the original message becomes a normalized event and can be used by KUMA for analysis. From here on, only normalized events are used in KUMA. Raw events are no longer used, but they can be kept as a part of normalized events inside the
Rawfield.The program has the following normalizers:
- JSON
- CEF
- Regexp
- Syslog (as per RFC3164 and RFC5424)
- CSV/TSV
- Key-value
- XML
- Netflow v5, v9, IPFIX (v10)
- SQL
At this point normalized events can already be used for analysis.
- Event destination. After the Collector service have processed an event, it is ready to be used by other KUMA services and sent to the KUMA Correlator and/or Storage.
The next steps of the event life cycle are completed in the correlator.
Event types:
- Base event. An event that was normalized.
- Aggregated event. When dealing with a large number of similar events, you can "merge" them into a single event to save processing time and resources. They act as base events, but In addition to all the parameters of the parent events (events that are "merged"), aggregated events have a counter that shows the number of parent events it represents. Aggregated events also store the time when the first and last parent events were received.
- Correlation event. When a sequence of events is detected that satisfies the conditions of a correlation rule, the program creates a correlation event. These events can be filtered, enriched, and aggregated. They can also be sent for storage or looped into the Correlator pipeline.
- Audit event. Audit events are created when certain security-related actions are completed in KUMA. These events are used to ensure system integrity. They are stored at least for 365 days.
- Monitoring event. These events are used to track changes in the amount of data received by KUMA.
About alerts
In KUMA, an alert is created when a sequence of events is received that triggers a correlation rule. Correlation rules are created by KUMA analysts to check incoming events for possible security threats, so when a correlation rule is triggered, it's a warning there may be some malicious activity happening. Security officers should investigate these alerts and respond if necessary.
KUMA automatically assigns the priority to each alert. This parameter shows how important or numerous the processes are that triggered the correlation rule. Alerts with higher priority should be dealt with first. The priority value is automatically updated when new correlation events are received, but a security officer can also set it manually. In this case, the alert priority is no longer automatically updated.
Alerts have related events linked to them, making alerts enriched with data from these events. KUMA also offers drill down functionality for alert investigations.
You can create incidents based on alerts.
Below is the life cycle of an alert:
- KUMA creates an alert when a correlation rule is triggered. The alert is updated if the correlation rule is triggered again. Alert is assigned the New status.
- A security officer assigns the alert to an operator for investigation. The alert status changes to assigned.
- The operator performs one of the following actions:
- Close the alert as false a positive (alert status changes to closed).
- Respond to the threat and close the alert (alert status changes to closed).
Afterwards, the alert is no longer updated with new events and if the correlation rule is triggered again, a new alert is created.
Alert management in KUMA is described in this section.
Page top
About incidents
If the nature of the data received by KUMA or the generated correlation events and alerts indicate a possible attack or vulnerability, the symptoms of such an event can be combined into an incident. This allows security experts to analyze threat manifestations in a comprehensive manner and facilitates response.
You can assign a category, type, and priority to incidents, and assign incidents to data protection officers for processing.
Incidents can be exported to RuCERT.
Page top
About assets
Assets are network devices registered in KUMA. Assets generate network traffic when they send and receive data. The KUMA program can be configured to track this activity and create baseline events with a clear indication of where the traffic is coming from and where it is going. The event can contain source and destination IP addresses, as well as DNS names. If you register an asset with certain parameters (for example, a specific IP address), this asset is linked to all events that contain this IP address in any of its parameters.
Assets can be divided into logical groups. This helps keep your network structure transparent and gives you additional ways to work with correlation rules. When an event linked to an asset is processed, the category of this asset is also taken into consideration. For example, if you assign high priority to a certain category of assets, the base events involving these assets will trigger the creation of correlation events with higher priority. This in turn will cascade into higher priority alerts and, therefore, a faster response to it.
It is recommended to register network assets in KUMA because their use makes it possible to formulate clear and versatile correlation rules for much more efficient analysis of events.
Asset management in KUMA is described in this section.
Page top
About resources
Resources are KUMA components that contain parameters for implementing various functions: for example, establishing a connection with a given web address or converting data according to certain rules. These components, like parts of a constructor set, are assembled into resource sets for services, based on which, in turn, KUMA services are created.
Page top
About services
Services are the main components of KUMA that work with events: receiving, processing, analyzing, and storing them. Each service consists of two parts that work together:
- One part of the service is created inside the KUMA web interface based on set of resources for services.
- The second part of the service is installed in the network infrastructure where the KUMA system is deployed as one of its components. The server part of a service can consist of several instances: for example, services of the same agent or storage can be installed on several computers at once.
Parts of services are connected to each other by using the IDs of services.
Page top
About agents
KUMA agents are services that are used to forward unprocessed events from servers and workstations to KUMA collectors.
Types of agents:
- Wmi agents are used to receive data from remote Windows machines using Windows Management Instrumentation. They are installed to Windows assets.
- Wec agents are used to receive Windows logs from a local machine using Windows Event Collector. They are installed to Windows assets.
- Tcp agents are used to receive data over the TCP protocol. They are installed to Linux and Windows assets.
- Udp agents are used to receive data over the UDP protocol. They are installed to Linux and Windows assets.
- Nats agents are used for NATS communications. They are installed to Linux and Windows assets.
- Kafka agents are used for Kafka communications. They are installed to Linux and Windows assets.
- Http agents are used for communication over the HTTP protocol. They are installed to Linux and Windows assets.
- File agents are used to get data from a file. They are installed to Linux and Windows assets.
- Ftp agents are used to receive data over the File Transfer Protocol. They are installed to Linux and Windows assets.
- Nfs agents are used to receive data over the Network File System protocol. They are installed to Linux and Windows assets.
- Snmp agents are used to receive data over the Simple Network Management Protocol. They are installed to Linux and Windows assets.
About Priority
Priority reflects the relative importance of security-sensitive activity detected by a KUMA correlator. It shows the order in which multiple alerts should be processed, and indicates whether senior security officers should be involved.
The Correlator automatically assigns priority to correlation events and alerts based on correlation rule settings. The priority of an alert also depends on the assets related to the processed events because correlation rules take into account the priority of a related asset's category. If the alert or correlation event does not have linked assets with a defined priority or does not have any related assets at all, the priority of this alert or correlation event is equal to the priority of the correlation rule that triggered them. The alert or the correlation event priority is never lower than the priority of the correlation rule that triggered them.
Alert priority can be changed manually. The priority of alerts changed manually is no longer automatically updated by correlation rules.
Possible priority values:
- Low
- Medium
- High
- Critical
Installing and removing KUMA
This section described the installation of KUMA. KUMA can be installed on one server to get familiar with the program capabilities. KUMA can also be installed in a production environment.
Program installation requirements
Requirements for program installation in the Oracle Linux operating system
- A disk image for installation is available on the official Oracle site.
- Make sure that Python version 3.6 or later is installed in the operating system.
- Make sure that the pip3 package management system is installed in the operating system.
- Make sure that the netaddr package is installed in the operating system. This package can be installed by running the
pip3 install netaddrcommand.
Requirements for program installation in the Astra Linux Special Edition operating system
- Make sure that Python version 3.6 or later is installed in the operating system.
- Make sure that the pip3 package management system is installed in the operating system.
- Make sure that the following packages are installed in the operating system:
- python-apt
- curl
- libcurl3
These packages can be installed by running the
apt install python-apt curl libcurl3command. - Make sure that the following dependent packages are installed in the operating system:
- netaddr
- python3-cffi-backend
These packages can be installed using the following commands:
apt install python3-cffi-backendpip3 install netaddr
If you are planning to query Oracle databases from KUMA, you must install the libaio1 package.
- You must use the
sudo pdpl-user -i 63 <user name>command to assign the required permissions to the user who will be running the program installation.
General installation requirements
- The server where the installer is run cannot have the name
localhostorlocalhost.<domain>. The installer can run from any folder, but the RPM packages must be located in the same folder as the kuma-installer file. You can get more information about kuma-installer by running it with the--helpparameter. - Before deploying the program, make sure that the servers where you intend to install the components meet the hardware and software requirements.
- KUMA components are addressed using the fully qualified domain name (FQDN) of the host. Before you install the program, you must ensure that the command
hostnamectl statusreturns the true name of the host FQDN in theStatic hostnamefield. - It is recommended to use Network Time Protocol (NTP) to synchronize time between servers with KUMA services.
Installing for demo
For demonstration purposes, you can deploy KUMA components on a single server. Prior to installing the program, carefully read the KUMA installation requirements as well as the hardware and system requirements.
The KUMA installation takes place over several stages:
- Preparing the test machine
The test machine is used during the program installation process: the installer files are unpacked and run on it.
- Preparing the target machine
The program components are installed on the target machines. The test machine can be used as a target one.
- Preparing an inventory file for demonstration installation
Create an inventory file describing the network structure of the program components that the installer can use to deploy KUMA.
- Installing the program for demonstration purposes
Install the program and get the URL and login credentials for the web interface.
If necessary, the program installed for demonstration purposes can be distributed to different servers for full-fledged operation.
Preparing an inventory file for demonstration installation
Installation, update, and removal of KUMA components is performed from the folder containing the unpacked installer by using the Ansible tool and the user-created inventory file containing a list of the hosts of KUMA components and other parameters. In the case of a demonstration installation, the host will be the same for all components. The inventory file is in the YAML format.
To create an inventory file for a demonstration installation:
- Go to the KUMA installer folder by executing the following command:
cd kuma-ansible-installer - Create an inventory file by copying the single.inventory.yml.template:
cp single.inventory.yml.template single.inventory.yml - Edit the inventory file parameters:
- If you want demonstration services to be created during the installation, set the deploy_example_services parameter value to true.
deploy_example_services: trueDemonstration services can only be created during the initial installation of KUMA. When updating the system using the same inventory file, no demonstration services will be created.
- If you are installing KUMA in a production environment and have a separate test machine, set the ansible_connection parameter to ssh:
ansible_connection: ssh
- If you want demonstration services to be created during the installation, set the deploy_example_services parameter value to true.
- Replace all
kuma.example.comlines in the inventory file with the host of the target machine on which you want to install KUMA components.
The inventory file is created. You can install KUMA for demonstration purposes using it.
It is recommended that you not remove the inventory file after installing KUMA:
- If you change this file (for example, add information about a new server for the collector), you can reuse it to update the system with a new component.
- You can use this inventory file to delete KUMA.
Installing the program for demonstration purposes
KUMA is installed using the Ansible tool and the YML inventory file. The installation is performed using the test machine, where all of the KUMA components are installed on the target machines.
To install KUMA for demonstration purposes:
- On the test machine, open the folder containing the unpacked installer.
- Place the file with the license key in the folder <installer folder>/roles/kuma/files/.
The key file must be named license.key.
- Launch the installer by executing the following command:
sudo ./install.sh single.inventory.yml - Accept the terms of the End User License Agreement.
If you do not accept the terms of the End User License Agreement, the program will not be installed.
KUMA components are installed on the target machine. The screen will display the URL of the KUMA web interface and the user name and password that must be used to access the web interface.
By default, the KUMA web interface address is https://kuma.example.com:7220.
Default login credentials (after the first login, you must change the password of the admin account):
- user name—admin
- password—mustB3Ch@ng3d!
It is recommended that you save the inventory file used to install the program. It can be used to add components to the system or remove KUMA.
You can later upgrade the demonstration installation to the full one.
Page top
Upgrading the demonstration installation
You can upgrade the demonstration installation by installing the program over the installed KUMA using the distributed.inventory.yml template.
Several steps are required to upgrade the demonstration installation:
- Installing the program
Specify the host of the demonstration server and place it in the
coregroup when preparing the inventory file. - Deleting the demonstration services
In the KUMA web interface under Resources → Active services copy the IDs for the existing services and delete them.
Then delete the services from the machine where they were installed by running the command
sudo /opt/kaspersky/kuma/kuma <collector/correlator/storage> --id <service ID> --uninstall. Repeat the delete command for each service. - Rebuilding services on the right machines
Installing KUMA in production environment
Prior to installing the program, carefully read the KUMA installation requirements as well as the hardware and system requirements. The KUMA installation takes place over several stages:
- Configuring network access
Make sure all the necessary ports are open to allow KUMA components to interact with each other based on your organization's security structure.
- Preparing the test machine
The test machine is used during the program installation process: the installer files are unpacked and run on it.
- Preparing the target machines
The program components are installed on the target machines.
- Preparing the inventory file
Create an inventory file describing the network structure of the program components that the installer can use to deploy KUMA.
- Installing the program
Install the program and get the URL and login credentials for the web interface.
- Creating services
Create services in the KUMA web interface and install them on the target machines intended for them.
Configuring network access
For the program to run correctly, you need to ensure that the KUMA components are able to interact with other components and programs over the network via the protocols and ports specified during the installation of the KUMA components. The table below shows the default network ports values.
Network ports used so KUMA components can interact with each other
Protocol |
Port |
Direction |
Destination of the connection |
HTTPS |
7222 |
From the KUMA client to the server with the KUMA Core component. |
Reverse proxy in the CyberTrace system. |
HTTPS |
8123 |
From the storage service to the ClickHouse cluster node. |
Writing and receiving normalized events in the ClickHouse cluster. |
HTTPS |
9009 |
Between ClickHouse cluster replicas. |
Internal communication between ClickHouse cluster replicas for transferring data of the cluster. |
TCP |
2181 |
From ClickHouse cluster nodes to the ClickHouse keeper replication coordination service. |
Receiving and writing of replication metadata by replicas of ClickHouse servers. |
TCP |
2182 |
From one ClickHouse keeper replication coordination service to another. |
Internal communication between replication coordination services to reach a quorum. |
TCP |
7210 |
From all KUMA components to the KUMA Core server |
Receipt of the configuration by KUMA from the KUMA Core server |
TCP |
7215 |
From the KUMA collector to the KUMA correlator |
Forwarding of data by the collector to the KUMA correlator |
TCP |
7220 |
From the KUMA client to the server with the KUMA Core component |
User access to the KUMA web interface |
TCP |
7221 and other ports used for service installation as the --api.port <port> parameter value. |
From KUMA Core to KUMA services |
Administration of services from the KUMA web interface |
TCP |
7223 |
To the KUMA Core server. |
Default port used for API requests. |
TCP |
8001 |
From Victoria Metrics to the ClickHouse server. |
Receiving ClickHouse server operation metrics. |
TCP |
9000 |
From the ClickHouse client to the ClickHouse cluster node. |
Writing and receiving data in the ClickHouse cluster. |
Preparing the test machine
The test machine is used during the program installation process: the installer files are unpacked and run on it.
To prepare the test machine for the KUMA installation:
- Install an operating system on the test machine and then install the necessary packages.
- Configure the network interface.
For convenience, you can use the graphical utility nmtui.
- Configure the system time to synchronize with the NTP server:
- If the machine does not have direct Internet access, edit the /etc/chrony.conf file to replace
2.pool.ntp.orgwith the name or IP address of your organization's internal NTP server. - Start the system time synchronization service by executing the following command:
sudo systemctl enable --now chronyd - Wait a few seconds and execute the following command:
sudo timedatectl | grep 'System clock synchronized'If the system time is synchronized correctly, the output will contain the line "System clock synchronized: yes."
- If the machine does not have direct Internet access, edit the /etc/chrony.conf file to replace
- Generate an SSH key for authentication on the SSH servers of the target machines by executing the following command:
sudo ssh-keygen -f /root/.ssh/id_rsa -N "" -C kuma-ansible-installer - Make sure the test machine has network access to all the target machines by host name and copy the SSH key to each of them by executing the following command:
sudo ssh-copy-id -i /root/.ssh/id_rsa root@<host name of the test machine> - Copy the archive with the KUMA installer to the test machine and unpack it using the following command (about 2 GB of disk space is required):
sudo tar -xpf kuma-ansible-installer-<version>.tar.gz
The test machine is ready for the KUMA installation.
Page top
Preparing the target machine
The program components are installed on the target machines.
To prepare the target machine for the installation of KUMA components:
- Install an operating system on the test machine and then install the necessary packages.
- Configure the network interface.
For convenience, you can use the graphical utility nmtui.
- Configure the system time to synchronize with the NTP server:
- If the machine does not have direct Internet access, edit the /etc/chrony.conf file to replace
2.pool.ntp.orgwith the name or IP address of your organization's internal NTP server. - Start the system time synchronization service by executing the following command:
sudo systemctl enable --now chronyd - Wait a few seconds and execute the following command:
sudo timedatectl | grep 'System clock synchronized'If the system time is synchronized correctly, the output will contain the line "System clock synchronized: yes."
- If the machine does not have direct Internet access, edit the /etc/chrony.conf file to replace
- Specify the host name. It is highly recommended to use the FQDN. For example: kuma-1.mydomain.com.
You should not change the KUMA host name after installation: this will make it impossible to verify the authenticity of certificates and will disrupt the network communication between the program components.
- Register the target machine in your organization's DNS zone to allow host names to be translated to IP addresses.
If your organization does not use a DNS server, you can use the /etc/hosts file for name resolution. The content of the files can be automatically generated for each target machine when installing KUMA.
- Execute the following command and write down the result:
hostname -fYou will need this host name when installing KUMA. The test machine must be able to access the target machine using this name.
The target machine is ready for the installation of KUMA components.
The test machine can be used as a target one. To do so, prepare the test machine, then follow steps 4–6 in the instructions for preparing the target machine.
Page top
Preparing the inventory file
Installation, update, and removal of KUMA components is performed from the folder containing the unpacked installer by using the Ansible tool and the user-created inventory file containing a list of the hosts of KUMA components and other parameters. The inventory file is in the YAML format.
To create an inventory file:
- Go to the KUMA installer folder by executing the following command:
cd kuma-ansible-installer - Create an inventory file by copying the distributed.inventory.yml.template:
cp distributed.inventory.yml.template distributed.inventory.yml - Edit the inventory file parameters:
- If you want demonstration services to be created during the installation, set the deploy_example_services parameter value to true.
deploy_example_services: trueDemonstration services can only be created during the initial installation of KUMA. When updating the system using the same inventory file, no demonstration services will be created.
- If the machines are not registered in your organization's DNS zone, set the generate_etc_hosts parameter to true, and for each machine in the inventory, replace the
ip (0.0.0.0)parameter values with the actual IP addresses.generate_etc_hosts: trueWhen using this parameter, the installer will automatically add the IP addresses of the machines from the inventory file to the /etc/hosts files on the machines where KUMA components are installed.
- If you are installing KUMA in a production environment and have a separate test machine, set the ansible_connection parameter to ssh:
ansible_connection: ssh
- If you want demonstration services to be created during the installation, set the deploy_example_services parameter value to true.
- In the inventory file, specify the host of the target machines on which KUMA components should be installed. If the machines are not registered in the DNS zone of your organization, replace the parameter values
ip (0.0.0.0)with the actual IP addresses.The hosts are specified in the following sections of the inventory file:
coreis the section for specifying the host and IP address of the target machine on which KUMA Core will be installed. You may only specify one host in this section.collectoris the section for specifying the host and IP address of the target machine on which the collector will be installed. You may specify one of more hosts in this section.correlatoris the section for specifying the host and IP address of the target machine on which the correlator will be installed. You may specify one of more hosts in this section.storageis the section for specifying the hosts and IP addresses of the target machines on which storage components will be installed. You may specify one of more hosts in this section.Storage components: clusters, shards, replicas, and keepers.
Each machine in the
storagesection can have the following parameter combinations:shard+replica+keepershard+replicakeeper
If the
shardandreplicaparameters are specified, the machine is a part of a cluster and helps accumulate and search for normalized KUMA events. If thekeeperparameter is additionally specified, the machine also helps coordinate data replication at the cluster-wide level.If only
keeperis specified, the machine will not accumulate normalized events, but it will participate in coordinating data replication at the cluster-wide level. The keeper parameter values must be unique.If several replicas are defined within the same shard, the value of the replica parameter must be unique within this shard.
The inventory file is created. It can be used to install KUMA.
It is recommended that you not remove the inventory file after installing KUMA:
- If you change this file (for example, add information about a new server for the collector), you can reuse it to update the system with a new component.
- You can use this inventory file to delete KUMA.
Installing the program
KUMA is installed using the Ansible tool and the YML inventory file. The installation is performed using the test machine, where all of the KUMA components are installed on the target machines.
To install KUMA:
- On the test machine, open the folder containing the unpacked installer.
- Place the file with the license key in the folder <installer folder>/roles/kuma/files/.
The key file must be named license.key.
- Launch the installer by executing the following command:
sudo ./install.sh distributed.inventory.yml - Accept the terms of the End User License Agreement.
If you do not accept the terms of the End User License Agreement, the program will not be installed.
KUMA components are installed on the target machines. The screen will display the URL of the KUMA web interface and the user name and password that must be used to access the web interface.
By default, the KUMA web interface address is https://kuma.example.com:7220.
Default login credentials (after the first login, you must change the password of the admin account):
- user name—admin
- password—mustB3Ch@ng3d!
It is recommended that you save the inventory file used to install the program. It can be used to add components to the system or remove KUMA.
Page top
Creating services
KUMA services should be installed only after KUMA deployment is complete. The services can be installed in any order.
When deploying several KUMA services on the same host, you must specify unique ports for each service using the --api.port <port> parameters during installation.
Below is a list of the sections describing how specific services are created:
Page top
Changing CA certificate
After KUMA Core is installed, a unique self-signed CA certificate with the matching key is generated. This CA certificate is used to sign all other certificates for internal communication between KUMA components and REST API requests. The CA certificate is stored on the KUMA Core server in the /opt/kaspersky/kuma/core/certificates/ folder.
You can use your company's certificate and key instead of self-signed KUMA CA certificate and key.
Before changing KUMA certificate, make sure to make a backup copy of the previous certificate and key with the names backup_external.cert and backup_external.key.
To change KUMA certificate:
- Rename your company's certificate and key files to external.cert and external.key.
Keys must be in PEM format.
- Place external.cert and external.key to the /opt/kaspersky/kuma/core/certificates/ folder.
- Restart the kuma-core service by running the
sudo systemctl restart kuma-corecommand. - Restart the browser hosting the KUMA web interface.
You company's certificate and key are now used for internal communication between KUMA components and REST API requests.
Page top
Delete KUMA
To remove KUMA, use the Ansible tool and the user-generated inventory file.
To remove KUMA:
- On the test machine, go to the installer folder:
cd kuma-ansible-installer - Execute the following command:
sudo ./uninstall.sh <inventory file>
KUMA and all of the program data will be removed from the server.
The databases that were used by KUMA (for example, the ClickHouse storage database) and the information they contain must be deleted separately.
Page top
Updating previous versions of KUMA
You can install KUMA 1.6.x over versions 1.5.x. To do this, follow the instructions for installing the program in a production environment, and when you reach the stage of preparing the inventory file list the hosts of the already deployed KUMA system in it.
After updating KUMA to version 1.6, event filtering that uses an SQL query containing the inSubnet condition may result in error Code: 441. DB::Exception: Invalid IPv4 value. If this is the case, you must add the directive <cast_ipv4_ipv6_default_on_conversion_error>true</cast_ipv4_ipv6_default_on_conversion_error> in the profiles → default section of the file /opt/kaspersky/kuma/clickhouse/cfg/config.d/users.xml on the storage servers (on each machine of the ClickHouse cluster).
About the End User License Agreement
The End User License agreement is a legal agreement between you and AO Kaspersky Lab that specifies the conditions under which you can use the program.
Read the terms of the End User License Agreement carefully before using the program for the first time.
You can familiarize yourself with the terms of the End User License Agreement in the following ways:
- During the installation of KUMA.
- By reading the LICENSE document. This document is included in the distribution kit and is located inside the installer in the /kuma-ansible-installer/roles/kuma/files/ folder.
After the program is deployed, the document is available in the /opt/kaspersky/kuma/LICENSE folder.
You accept the terms of the End User License Agreement by confirming your acceptance of the End User License Agreement during the program installation. If you do not accept the terms of the End User License Agreement, you must cease the installation of the program and must not use the program.
About the license
A License is a time-limited right to use the program, granted under the terms of the End User License Agreement.
A license entitles you to the following kinds of services:
- Use of the program in accordance with the terms of the End User License Agreement
- Getting technical support
The scope of services and the duration of usage depend on the type of license under which the program was activated.
A license is provided when the program is purchased. When the license expires, the program continues to work but with limited functionality (for example, new resources cannot be created). To continue using KUMA with its full functionality, you need to renew your license.
We recommend that you renew your license no later than its expiration date to ensure maximum protection against cyberthreats.
Page top
About the License Certificate
A License Certificate Is a document that is provided to you along with a key file or activation code.
The License Certificate contains the following information about the license being granted:
- License key or order number
- Information about the user who is granted the license
- Information about the program that can be activated under the provided license
- Restriction on the number of licensing units (for example, the number of events that can be processed per second)
- Start date of the license term
- License expiration date or license term
- License type
About the license key
A license key is a sequence of bits that you can apply to activate and then use the program in accordance with the terms of the End User License Agreement. License keys are generated by Kaspersky specialists.
You can add a license key to the program by applying a key file. The license key is displayed in the program interface as a unique alphanumeric sequence after you add it to the program.
The license key may be blocked by Kaspersky in case the terms of the License Agreement have been violated. If the license key has been blocked, you need to add another one if you want to use the program.
A license key may be active or reserve.
An active license key is the license key currently used by the program. An active license key can be added for a trial or commercial license. The program cannot have more than one active license key.
A reserve license key is the license key that entitles the user to use the program but is not currently in use. The additional license key automatically becomes active when the license associated with the current active license key expires. An additional license key can be added only if an active license key has already been added.
A license key for a trial license can be added as an active license key. A license key for a trial license cannot be added as an additional license key.
About the key file
The key file is a file named license.key provided to you by Kaspersky. The key file is used to add a license key that activates the program.
You receive a key file at the email address that you provided after purchasing KUMA.
You do not need to connect to Kaspersky activation servers in order to activate the program with a key file.
If the key file has been accidentally deleted, you can restore it. You may need a key file, for example, to register with Kaspersky CompanyAccount.
To restore the key file, you need to do one of the following:
- Contact the license seller.
- Get the key file on the Kaspersky Lab website based on the available activation code.
Adding a license key to the program web interface
You can add an application license key in the KUMA web interface.
Only users with the Administrator role can add a license key.
To add a license key to the KUMA web interface:
- Open the KUMA web interface and select Settings → License.
The window with KUMA license conditions opens.
- Select the key you want to add:
- If you want to add the active key, click the Add active license key button.
This button is not displayed if a license key has already been added to the program. If you want to add an active license key instead of the key that has already been added, the current license key must be deleted.
- If you want to add the reserve key, click the Add reserve license key button.
This button is inactive until an active key is added. If you want to add a reserve license key instead of the key that has already been added, the current reserve license key must be deleted.
The license key file selection window appears on the screen.
- If you want to add the active key, click the Add active license key button.
- Select a license file by specifying the path to the folder and the name of the license key file with the KEY extension.
The license key from the selected file will be loaded into the program. Information about the license key is displayed under Settings → License.
Page top
Viewing information about an added license key in the program web interface
In the KUMA web interface, you can view information about the added license key. Information about the license key is displayed under Settings → License.
Only users with the Administrator role can view license information.
The License tab window displays the following information about added license keys:
- Expires on—date when the license key expires.
- Days remaining—number of days before the license is expired.
- EPS available—number of events processed per second supported by the license.
- EPS current—current average number of events per second processed by KUMA.
- License key—unique alphanumeric sequence.
- Company—name of the company that purchased the license.
- Client name—name of client who purchased the license.
- Modules—modules available for the license.
Removing a license key in the program web interface
In KUMA, you can remove an added license key from the program (for example, if you need to replace the current license key with a different key). After the license key is removed, the program stops to receive and process events. This functionality will be re-activated the next time you add a license key.
Only users with the administrator role can delete license keys.
To delete an added license key:
- Open the KUMA web interface and select Settings → License.
The window with KUMA license conditions opens.
- Click the
 icon on the license that you want to delete.
A confirmation window opens.
- Confirm deletion of the license key.
The license key will be removed from the program.
Page top
Integration with other solutions
In this section, you'll learn how to integrate KUMA with other solutions to enrich its functionality.
Integration with Kaspersky Security Center
Kaspersky Security Center is designed for centralized execution of basic administration and maintenance tasks in an organization's network and provides the administrator access to detailed information about the organization's network security level. KUMA can be integrated with Kaspersky Security Center to receive information about assets. You can also use correlators to send commands to KUMA to create asset-related tasks.
Kaspersky Security Center tasks are functions performed by this program, such as Full computer scan and Database update. For more information about Kaspersky Security Center tasks, please refer to the Kaspersky Security Center Online Help Guide.
Preparing Kaspersky Security Center for integration with KUMA
For Kaspersky Security Center and KUMA to be able to interact with each other you must complete steps below:
- Make sure that Kaspersky Security Center can be reached via UDP from KUMA.
- Create user in Kaspersky Security Center with required permissions.
- Create Kaspersky Security Center tasks covering all assets in all applications connected to Kaspersky Security Center.
- Configure Kaspersky Security Center to send events to KUMA. This step is required if you want to receive information about Kaspersky Security Center tasks in KUMA.
Creating KUMA user in Kaspersky Security Center
To create a user in Kaspersky Security Center for KUMA integration:
- In the Kaspersky Security Center Administration Console, select the node with the name of the required Administration Server.
- In the context menu of the Administration Server, select Properties.
- In the Administration Server properties window, select the Security section.
- In the Names of groups or users field, click the Internal user button.
User selection window opens.
- Click the Add user button and add the user.
Only the user name and password are required. When the user is created, it will be appear in the User selection window.
- Select the user you created and click OK.
The user will be displayed in the Names of groups or users field.
- Select the user and in the Rights tab of Permissions for web section of the workspace and configure KUMA user rights:
- Receiving information about assets from Kaspersky Security Center: select the Allow check box in the Basic functionality node next to Read permissions.
- Starting Kaspersky Endpoint Security tasks for Linux: check the Allow check boxes in the Basic functionality node next to Read and Modify permissions.
- Starting scan tasks in Kaspersky Endpoint Security for Windows: check the Allow check boxes in the Basic Functionality and Protection Components nodes next to Read and Modify permissions.
- Starting update tasks in Kaspersky Endpoint Security for Windows: check the Allow check boxes in the Basic functionality and Protection components nodes next to Read and Modify permissions.
- Click OK.
KUMA user is added to Kaspersky Security Center. It can now be used to create a Kaspersky Security Center connection.
Page top
Configuring Kaspersky Security Center to send events to KUMA
If you want to be able to see task related information from Kaspersky Security Center in KUMA, you must configure exporting Kaspersky Security Center events using the CEF format and select event types that must be exported from Kaspersky Security Center.
To export Kaspersky Security Center events to KUMA:
- In the Kaspersky Security Center console tree, select the Administration Server whose events you want to export.
- In the workspace of the selected Administration Server, click the Events tab.
- Click the drop-down arrow next to the Configure notifications and event export link and select Configure export to SIEM system in the drop-down list.
- The events properties window opens, displaying the Event export section.
- In the Event export section, specify the following export settings:
- Select the Automatically export events to SIEM system database check box.
- In the SIEM system drop-down list select ArcSight (CEF format).
- In the SIEM system server address field, enter the web address of the KUMA collector server that will be used to receive events from Kaspersky Security Center.
- In the SIEM system server port field, enter the port where the KUMA collector server will expect Kaspersky Security Center events.
- In the Protocol drop-down list select TCP/IP.
- Click OK.
Automatic export of Kaspersky Security Center events will be enabled. For more information about exporting events from Kaspersky Security Center to SIEM systems, please refer to the Kaspersky Security Center Online Help Guide.
To select event types for export for each Kaspersky Security Center policy you need:
- In the console tree of Kaspersky Security Center, select the Policies node.
- Right-click to open the context menu of the relevant policy and select Properties.
- In the policy properties window that opens, select the Event configuration section.
- In the Info tab select the Task started and Task completed event types and click the Properties button.
- In the event properties window that appears, select the Export to SIEM system using Syslog check box to enable export for the selected events.
- Click OK to save the changes.
- In the policy properties window, click OK.
The selected events will be sent to the KUMA over the Syslog protocol. For more information about exporting events from Kaspersky Security Center using the Syslog protocol, please refer to the Kaspersky Security Center Online Help Guide.
You must configure KUMA Collector to be able to receive Kaspersky Security Center events. Events from Kaspersky Security Center have DeviceProduct = SecurityCenter field value, which can be used to search them in KUMA.
Example collector for receiving Kaspersky Security Center events is included to KUMA installation package. It is named [Example] KSC. It consists of the connector that listens for TCP port 5141 and, more importantly, of the normalizer [Example] KSC that can you can use to process Kaspersky Security Center events in your own collectors.
Creating KUMA tasks in Kaspersky Security Center
If you want to start asset-related tasks in Kaspersky Security Center from KUMA, you must create these tasks in Kaspersky Security Center beforehand.
You must create separate tasks for each Kaspersky program that is not compatible with other. For example, create separate tasks for Linux and Windows products or, if you have Kaspersky Endpoint Security for Windows both version 10 and 11, create separate tasks for each of them. For compatible products create tasks for the latest version.
If you have several hierarchically linked Kaspersky Security Center Administration Servers, you should create tasks on the main Administration Server only. Otherwise create tasks on every secondary Kaspersky Security Center Administration Server.
To create Kaspersky Security Center task:
- In the Kaspersky Security Center console tree, select the administration group for which you want to create a task.
- In the group workspace, select the Tasks tab.
- Run the task creation by clicking the Create a task button.
The New Task Wizard starts.
- Follow the instructions of the Wizard to create the required task.
The name of the task must begin with "
KUMA". For example, "KUMA asset virus scan".
Created task will be displayed in the Tasks section of Kaspersky Security Center console tree. These task can be started from KUMA.
Page top
Managing Kaspersky Security Center connections
This section describes working with Kaspersky Security Center connections that are required for integrating Kaspersky Security Center and KUMA.
Connections to Kaspersky Security Center are created and managed in the Settings section of the KUMA web interface in the Settings → Kaspersky Security Center tab. The right side of the Settings window of KUMA web interface displays a list of tenants for which Kaspersky Security Center connections are configured. Clicking on a tenant opens a Kaspersky Security Center connections window containing a list of created connections to Kaspersky Security Center. When you click on a connection, a detail pane opens with the parameters of the selected connection. You can create multiple Kaspersky Security Center connections.
To enable or disable integration with Kaspersky Security Center:
- Open the KUMA web interface and select Settings → Kaspersky Security Center.
The Connections to Kaspersky Security Center table will appear on the right in the Settings section.
- Select the tenant for which you want to enable or disable integration with Kaspersky Security Center.
The Kaspersky Security Center connection table will appear on the right in the Settings section.
- Enable or disable integration with Kaspersky Security Center:
- Clear the Disabled check box if you want KUMA to receive information about Kaspersky Security Center assets and send commands to Kaspersky Security Center.
- Select the Disabled check box if you do not want KUMA to receive information about Kaspersky Security Center assets and send commands to Kaspersky Security Center.
By default, this check box is cleared.
- Click Save.
Creating Kaspersky Security Center connection
To create a new Kaspersky Security Center connection:
- Open the KUMA web interface and select Settings → Kaspersky Security Center.
The Connections to Kaspersky Security Center table will appear on the right in the Settings section.
- Select the tenant for which you want to create a connection to Kaspersky Security Center.
The Kaspersky Security Center connection table will appear on the right in the Settings section.
- Click the Add KSC connection button and set the parameters as described below:
- Name (required)—enter the unique name of the Kaspersky Security Center connection. Must contain from 1 to 128 Unicode characters.
- URL (required)—enter the URL of the Kaspersky Security Center server in the hostname:port or IPv4:port format.
- Disabled—clear this check box if you want to use this Kaspersky Security Center connection. By default, this check box is cleared.
- In the Secret drop-down list select the Secret resource with the credentials of the Kaspersky Security Center you need or create a new Secret resource using the plus button.
Creating resource with Kaspersky Security Center credentials
- Click Save.
The Kaspersky Security Center connection has been created. It can be used to import information about assets from Kaspersky Security Center to KUMA and to create asset-related tasks in Kaspersky Security Center from KUMA.
Page top
Editing Kaspersky Security Center connection
To edit a Kaspersky Security Center connection:
- Open the KUMA web interface and select Settings → Kaspersky Security Center.
The Connections to Kaspersky Security Center window opens.
- Select the tenant for which you want to configure integration with Kaspersky Security Center.
The Kaspersky Security Center connection window opens.
- Click the Kaspersky Security Center connection you want to change.
The window with the selected Kaspersky Security Center connection parameters opens.
- Make the necessary changes to the settings.
- Click the Save button.
The Kaspersky Security Center connection will be changed.
Page top
Deleting Kaspersky Security Center connection
To delete a Kaspersky Security Center connection:
- Open the KUMA web interface and select Settings → Kaspersky Security Center.
The Connections to Kaspersky Security Center window opens.
- Select the tenant for which you want to configure integration with Kaspersky Security Center.
The Kaspersky Security Center connection window opens.
- Select the Kaspersky Security Center connection that you want to delete.
- Click the Delete button.
The Kaspersky Security Center connection will be deleted.
Page top
Working with Kaspersky Security Center tasks
After importing information about Kaspersky Security Center assets, you can use tasks to manage these assets. Tasks are started in the KUMA web interface. You can start tasks manually from the Assets section of the program web interface or automatically during the correlation process by using response rules.
For more details on Kaspersky Security Center tasks, please refer to the Kaspersky Security Center Help Guide.
In the KUMA web interface, you can start only those Kaspersky Security Center tasks whose names begin with <kuma> (not case sensitive).
Starting Kaspersky Security Center tasks manually
To manually start a Kaspersky Security Center task:
- In the Assets section of the KUMA web interface, select the assets that were imported from Kaspersky Security Center.
The Asset details window opens.
- Click the KSC response button.
This button is displayed if the connection to the Kaspersky Security Center that owns the selected asset is enabled.
- In the opened Select task window, select the check boxes next to the tasks that you want to start, and click the Start button.
Kaspersky Security Center starts the selected tasks.
Some types of tasks are available only for certain assets.
You can obtain vulnerability and software information only for assets running a Windows operating system.
Page top
Starting Kaspersky Security Center tasks automatically
Kaspersky Security Center tasks can be started automatically by Correlators. When certain conditions are met, the correlator activates response rules that contain the list of Kaspersky Security Center tasks to start and identify the relevant assets.
To configure Response resource that can be used by Correlators to start Kaspersky Security Center task automatically:
- In the KUMA web interface, select Resources → Response.
- Click the Add response button and set parameters as described below:
- In the Name field enter the resource name that will let you identify it.
- In the Type drop-down list, select ksctasks (Kaspersky Security Center tasks).
- In the Kaspersky Security Center task drop-down list, select the tasks that must be run when the correlator linked to this response resource is triggered.
You can select several tasks. When a response is activated, it picks only the first task from the list of the selected tasks that match the relevant asset. The rest of the matching tasks are disregarded. If you want to start multiple tasks based on one condition, you need to create multiple response rules.
- Under Event field, select the event fields that will trigger the correlators. Possible values:
- SourceAssetID
- DestinationAssetID
- DeviceAssetID
- If necessary, in the Workers field specify the number of response processes that can be run simultaneously.
- If necessary, use the Filter settings block to specify the conditions under which events will be processed by the created resource. You can select an existing filter resource from the drop-down list or create a new filter.
Creating a filter in resources
- In the Filter drop-down list, select Create new.
- If you want to keep the filter as a separate resource, set the Save filter toggle switch.
In this case, you will be able to use the created filter in various services.
The toggle switch is turned off by default.
- If you toggle the Save filter switch on, enter a name for the created filter resource in the Name field. The name must contain from 1 to 128 Unicode characters.
- In the Conditions settings block, specify the conditions that the events must meet:
- Click the Add condition button.
- In the Left operand and Right operand drop-down lists, specify the search parameters.
Depending on the data source selected in the Right operand field, you may see fields of additional parameters that you need to use to define the value that will be passed to the filter. For example, when choosing active list you will need to specify the name of the active list, the entry key, and the entry key field.
- In the operator drop-down list, select the relevant operator.
- If necessary, select the do not match case check box. When this check box is selected, the operator ignores the case of the values.
The selection of this check box does not apply to the InSubnet, InActiveList, InCategory or InActiveDirectoryGroup operators.
This check box is cleared by default.
- If you want to add a negative condition, select If not from the If drop-down list.
- You can add multiple conditions or a group of conditions.
- If you have added multiple conditions or groups of conditions, choose a search condition (and, or, not) by clicking the AND button.
- If you want to add existing filters that are selected from the Select filter drop-down list, click the Add filter button.
You can view the nested filter settings by clicking the
 button.
- Click Save.
The Response resource is created. It can now be linked to a Correlator that would trigger it, starting a Kaspersky Security Center task as a result.
Page top
Checking the status of Kaspersky Security Center tasks
In the KUMA web interface, you can check whether a Kaspersky Security Center task was started or whether a search for events owned by the collector listening for Kaspersky Security Center events was completed.
To check the status of Kaspersky Security Center tasks:
- In KUMA, select Resources → Active services.
- Select the collector that is configured to receive events from the Kaspersky Security Center server and click the Go to Events button.
A new browser tab will open in the Events section of KUMA. The table displays events from the Kaspersky Security Center server. The status of the tasks can be seen in the Name column.
Kaspersky Security Center event fields:
- Name—status or type of the task.
- Message—message about the task or event.
- FlexString<number>Label—name of the attribute received from Kaspersky Security Center. For example,
FlexString1Label=TaskName. - FlexString<number>—value of the FlexString<number>Label attribute. For example,
FlexString1=Download updates. - DeviceCustomNumber<number>Label—name of the attribute related to the task state. For example,
DeviceCustomNumber1Label=TaskOldState. - DeviceCustomNumber<number>—value related to the task state. For example,
DeviceCustomNumber1=1means the task is executing. - DeviceCustomString<number>Label—name of the attribute related to the detected vulnerability: for example, a virus name, affected application.
- DeviceCustomString<number>—value related to the detected vulnerability. For example, the attribute-value pairs
DeviceCustomString1Label=VirusNameandDeviceCustomString1=EICAR-Test-Filemean that the EICAR test virus was detected.
Importing events from the Kaspersky Security Center database
In KUMA, you can receive events directly from the Kaspersky Security Center SQL database. Events are received by using a collector, which utilizes the provided resources of the connector [Example] KSC SQL and normalizer [Example] KSC from SQL.
To create a collector to receive Kaspersky Security Center events:
- Start the Collector Installation Wizard in one of the following ways:
- In the KUMA web interface, in the Resources section, click Add event source.
- In the KUMA web interface in the Resources → Collectors section click Add collector.
- At step 2 of the Installation Wizard, select the [Example] KSC SQL connector:
- In the URL field, specify the server connection string in the following format:
sqlserver://user:password@kscdb.example.com:1433/KAVwhere:
user—user account with public and db_datareader rights to the required database.password—user account password.kscdb.example.com:1433—address and port of the database server.KAV—name of the database.
- In the Query field, specify a database query based on the need to receive certain events.
An example of a query to the Kaspersky Security Center SQL database
- In the URL field, specify the server connection string in the following format:
- At step 3 of the Installation Wizard, select the [Example] KSC from SQL normalizer.
- Specify other parameters in accordance with your collector requirements.
Upon completion of the Wizard, a collector service is created in the KUMA web interface. You can use this collector service to import events from the SQL database of Kaspersky Security Center.
Page top
Integration with Kaspersky CyberTrace
Kaspersky CyberTrace (hereinafter CyberTrace) is a tool that integrates threat data streams with SIEM solutions. It provides users with instant access to analytics data, increasing their awareness of security decisions.
You can integrate CyberTrace with KUMA in one of the following ways:
- Integrate CyberTrace indicator search feature to enrich KUMA events with information from CyberTrace data streams.
- Integrate the entire CyberTrace web interface into KUMA to get full access to CyberTrace.
CyberTrace web interface integration is available only if your CyberTrace license includes multi-user feature.
Integrating CyberTrace indicator search
Integration of the CyberTrace indicator search function includes the following steps:
- Configuring CyberTrace to receive and process KUMA requests.
You can configure the integration with KUMA immediately after installing CyberTrace in the Quick Start Wizard or later in the CyberTrace web interface.
- Creating an event enrichment rule in KUMA.
After completing all stages of integration, you need to restart the collector responsible for receiving events that you want to enrich with information from CyberTrace.
Configuring the CyberTrace to receive and process requests.
You can configure CyberTrace to receive and process requests from KUMA immediately after its installation in the Quick Start Wizard or later in the program web interface.
To configure CyberTrace to receive and process requests in the Quick Start Wizard:
- Wait for the CyberTrace Quick Start Wizard to start after the program is installed.
The Welcome to Kaspersky CyberTrace window opens.
- In the <select SIEM> drop-down list, select the type of SIEM system from which you want to receive data and click the Next button.
The Connection Settings window opens.
- Do the following:
- In the Service listens on settings block, select the IP and port option.
- In the IP address field, enter
0.0.0.0. - In the Port field, enter
9999. - In the IP address or hostname field below, specify
127.0.0.1.Leave the default values for everything else.
- Click Next.
The Proxy Settings window opens.
- If a proxy server is being used in your organization, define the settings for connecting to it. If not, leave all the fields blank and click Next.
The Licensing Settings window opens.
- In the Kaspersky CyberTrace license key field, add a license key for CyberTrace.
- In the Kaspersky Threat Data Feeds certificate field, add a certificate that allows you to download updated data feeds from servers, and click Next.
CyberTrace will be configured.
To configure CyberTrace to receive and process requests in the program web interface:
- In the CyberTrace web interface window, select Settings – Service.
- In the Connection Settings block:
- Select the IP and port option.
- In the IP address field, enter
0.0.0.0. - In the Port field, enter
9999.
- In the Web interface settings block, in the IP address or hostname field, enter
127.0.0.1. - In the upper toolbar, click Restart Feed Service.
- Select Settings – Events format.
- In the Alert events format field, enter
%Date% alert=%Alert%%RecordContext%. - In the Detection events format field, enter
Category=%Category%|MatchedIndicator=%MatchedIndicator%%RecordContext%. - In the Records context format field, enter
|%ParamName%=%ParamValue%. - In the Actionable fields context format field, enter
%ParamName%:%ParamValue%.
CyberTrace will be configured.
After updating CyberTrace configuration you have to restart the CyberTrace server.
Page top
Creating event Enrichment rules
To create event enrichment rules:
- In the KUMA web interface, open Resources → Enrichment rules. In the left part of the window, select or create a folder for the new resource.
The list of available enrichment rules will be displayed.
- Click the Add enrichment rule button to create a new resource.
The enrichment rule window will be displayed.
- Enter the rule configuration parameters:
- In the Name field, enter a unique name for this type of resource. The name must contain from 1 to 128 Unicode characters.
- In the Tenant drop-down list, select the tenant that will own this resource.
- In the Source kind drop-down list, select cybertrace.
- Specify the URL of the CyberTrace server to which you want to connect. For example, example.domain.com:9999.
- If necessary, use the Number of connections field to specify the maximum number of connections to the CyberTrace server that can be simultaneously established by KUMA. By default, this value is equal to the number of vCPUs of the KUMA Core server.
- In the RPS field, enter the number of requests to the CyberTrace server per second that KUMA can make. The default value is
1000. - In the Timeout field, specify the maximum number of seconds KUMA should wait for a response from the CyberTrace server. Until a response is received or the time expires, the event is not sent to the Correlator. If a response is received before the timeout, it is added to the
TIfield of the event and the event processing continues. The default value is30. - In the Mapping settings block, you must specify the fields of events to be checked via CyberTrace, and define the rules for mapping fields of KUMA events to CyberTrace indicator types:
- In the KUMA field column, select the field whose value must be sent to CyberTrace.
- In the CyberTrace indicator column, select the CyberTrace indicator type for every field you selected:
- ip
- url
- hash
You must provide at least one string to the table. You can use the Add row button to add a string, and can use the
 button to remove a string.
 - Use the Debug drop-down list to indicate whether or not to enable logging of service operations. Logging is disabled by default.
- If necessary, in the Description field, add up to 256 Unicode characters describing the resource.
- In the Filter section, you can specify conditions to identify events that will be processed by the enrichment rule resource. You can select an existing filter resource from the drop-down list, or select Create new to create a new filter.
Creating a filter in resources
- In the Filter drop-down list, select Create new.
- If you want to keep the filter as a separate resource, set the Save filter toggle switch.
In this case, you will be able to use the created filter in various services.
The toggle switch is turned off by default.
- If you toggle the Save filter switch on, enter a name for the created filter resource in the Name field. The name must contain from 1 to 128 Unicode characters.
- In the Conditions settings block, specify the conditions that the events must meet:
- Click the Add condition button.
- In the Left operand and Right operand drop-down lists, specify the search parameters.
Depending on the data source selected in the Right operand field, you may see fields of additional parameters that you need to use to define the value that will be passed to the filter. For example, when choosing active list you will need to specify the name of the active list, the entry key, and the entry key field.
- In the operator drop-down list, select the relevant operator.
- If necessary, select the do not match case check box. When this check box is selected, the operator ignores the case of the values.
The selection of this check box does not apply to the InSubnet, InActiveList, InCategory or InActiveDirectoryGroup operators.
This check box is cleared by default.
- If you want to add a negative condition, select If not from the If drop-down list.
- You can add multiple conditions or a group of conditions.
- If you have added multiple conditions or groups of conditions, choose a search condition (and, or, not) by clicking the AND button.
- If you want to add existing filters that are selected from the Select filter drop-down list, click the Add filter button.
You can view the nested filter settings by clicking the
button.
- Click Save.
A new enrichment rule will be created.
CyberTrace indicator search integration is now configured. You can now add the created enrichment rule to a collector. You must restart KUMA collectors to apply the new settings.
If any of the CyberTrace fields in the events details area contains "[{" or "}]" values, it means that information from CyberTrace data feed was processed incorrectly and it's possible that some of the data is not displayed. You can get all data feed information by copying the events TI indicator field value from KUMA and searching for it in the CyberTrace in the indicators section. All relevant information will be displayed in the Indicator context section of CyberTrace.
Integrating CyberTrace interface
You can integrate the CyberTrace web interface into the KUMA web interface. When this integration is enabled, the KUMA web interface will show a CyberTrace section that provides access to the CyberTrace web interface. Integration is configured under Settings → Kaspersky CyberTrace in the KUMA web interface.
To integrate the CyberTrace web interface in KUMA:
- In the KUMA web interface, open Resources → Secrets.
The list of available secrets will be displayed.
- Click the Add secret button to create a new secret. This resource is used to store credentials of the CyberTrace server.
The secret window is displayed.
- Enter information about the secret:
- In the Name field, choose a name for the added secret. The name must contain from 1 to 128 Unicode characters.
- In the Tenant drop-down list, select the tenant that will own this resource.
- In the Type drop-down list, select credentials.
- In the User and Password fields, enter credentials for your CyberTrace server.
- If necessary, in the Description field, add up to 256 Unicode characters describing the resource.
- Click Save.
The CyberTrace server credentials are now saved and can be used in other KUMA resources.
- In the KUMA web interface, open Settings → Kaspersky CyberTrace.
The window with CyberTrace integration parameters opens.
- Make the necessary changes to the following parameters:
- Disabled—clear this check box if you want to integrate the CyberTrace web interface into the KUMA web interface.
- Host (required)—enter the URL of the CyberTrace server in
hostname:portformat. - Port (required)—enter the port of the CyberTrace server.
- In the Secret drop-down list select the Secret resource you created before.
- Click Save.
CyberTrace is now integrated with KUMA, and the CyberTrace section is displayed in the KUMA web interface.
If you are using the Mozilla Firefox browser to work with the program web interface, the CyberTrace section may fail to display data. If this is the case, clear the browser cache and configure the display of data (see below).
To configure data to be displayed in the CyberTrace section:
- In the browser's address bar, enter the FQDN of the KUMA web interface with port number 7222 as follows: https://kuma.example.com:7222. It is not recommended to specify an IP address as the server address.
A window will open to warn you of a potential security threat.
- Click the Details button.
- In the lower part of the window, click the Accept risk and continue button.
An exclusion will be created for the URL of the KUMA web interface.
- In the browser's address bar, enter the URL of the KUMA web interface with port number 7220.
- Go to the CyberTrace section.
Data will be displayed in this section.
Updating CyberTrace deny list (Internal TI)
When the CyberTrace web interface is integrated into the KUMA web interface, you can update the CyberTrace denylist or Internal TI with information from KUMA events.
To update CyberTrace Internal TI:
- Open the event details area from the events table, Alert window, or correlation event window and click the link on a domain, web address, IP address, or file hash.
The context menu opens.
- Select Add to Internal TI of CyberTrace.
The selected object is now added to the CyberTrace denylist.
Page top
Integration with Kaspersky Threat Intelligence Portal
The Kaspersky Threat Intelligence Portal combines all of Kaspersky's knowledge about cyberthreats and how they're related into a single, powerful web service. When integrated with KUMA, it helps KUMA users to make faster and better-informed decisions, providing them with data about URLs, domains, IP addresses, WHOIS / DNS data.
Access to the Kaspersky Threat Intelligence Portal is provided based on a fee. License certificates are created by Kaspersky experts. To obtain a certificate for Kaspersky Threat Intelligence Portal, contact your Technical Account Manager.
Initializing integration
To integrate Kaspersky Threat Intelligence Portal into KUMA:
- In the KUMA web interface, open Resources → Secrets.
The list of available secrets will be displayed.
- Click the Add secret button to create a new secret. This resource is used to store credentials of your Kaspersky Threat Intelligence Portal account.
The secret window is displayed.
- Enter information about the secret:
- In the Name field, choose a name for the added secret.
- In the Tenant drop-down list, select the tenant that will own the created resource.
- In the Type drop-down list, select ktl.
- In the User and Password fields, enter credentials for your Kaspersky Threat Intelligence Portal account.
- If you want, enter a Description of the secret.
- Upload your Kaspersky Threat Intelligence Portal certificate key:
- Click the Upload PFX button and select the PFX file with your certificate.
The name of the selected file appears to the right of the Upload PFX button.
- Enter the password to the PFX file in the PFX password field.
- Click the Upload PFX button and select the PFX file with your certificate.
- Click Save.
The Kaspersky Threat Intelligence Portal account credentials are now saved and can be used in other KUMA resources.
- In the Settings section of the KUMA web interface, open the Kaspersky Threat Lookup tab.
The list of available connections will be displayed.
- Make sure the Disabled check box is cleared.
- In the Secret drop-down list select the Secret resource you created before.
You can create a new secret by clicking the button with the plus sign. The created secret will be saved in the Resources → Secrets section.
- If required, select the Proxy resource in the Proxy drop-down list.
- Click Save.
The integration process of Kaspersky Threat Intelligence Portal with KUMA is completed.
Once Kaspersky Threat Intelligence Portal and KUMA are integrated, you can request additional information from the event details area about hosts, domains, URLs, IP addresses, and file hashes (MD5, SHA1, SHA256).
Page top
Requesting information from Kaspersky Threat Intelligence Portal
To request information from Kaspersky Threat Intelligence Portal:
- Open the event details area from the events table, alert window, or correlation event window and click the link on a domain, web address, IP address, or file hash.
The Threat Lookup enrichment area opens in the right part of the screen.
- Select check boxes next to the data types you want to request.
If neither check box is selected, all information types are requested.
- In the Maximum number of records in each data group field enter the number of entries per selected information type you want to receive. The default value is
10. - Click Request.
A ktl task has been created. When it is completed, events are enriched with data from Kaspersky Threat Intelligence Portal which can be viewed from the events table, Alert window, or correlation event window.
Viewing information from Kaspersky Threat Intelligence Portal
To view information from Kaspersky Threat Intelligence Portal:
Open the event details area from the events table, alert window, or correlation event window and click the link on a domain, web address, IP address, or file hash for which you previously requested information from Kaspersky Threat Intelligence Portal.
The event details area opens in the right part of the screen with data from Kaspersky Threat Intelligence Portal; the time when it was received is indicated at the bottom of the screen.
Information received from Kaspersky Threat Intelligence Portal is cached. If you click a domain, web address, IP address, or file hash in the event details pane for which KUMA has information available, the data from Kaspersky Threat Intelligence Portal opens, with the time it was received indicated at the bottom, instead of the Threat Lookup enrichment window. You can update the data.
Page top
Updating information from Kaspersky Threat Intelligence Portal
To update information, received from Kaspersky Threat Intelligence Portal:
- Open the event details area from the events table, alert window, or correlation event window and click the link on a domain, web address, IP address, or file hash for which you previously requested information from Kaspersky Threat Intelligence Portal.
- Click Update in the event details area containing the data received from the Kaspersky Threat Intelligence Portal.
The Threat Lookup enrichment area opens in the right part of the screen.
- Select the check boxes next to the types of information you want to request.
If neither check box is selected, all information types are requested.
- In the Maximum number of records in each data group field enter the number of entries per selected information type you want to receive. The default value is
10. - Click Update.
The KTL task is created and the new data received from Kaspersky Threat Intelligence Portal is requested.
- Close the Threat Lookup enrichment window and the details area with KTL information.
- Open the event details area from the events table, Alert window or correlation event window and click the link on a domain, URL, IP address, or file hash for which you updated Kaspersky Threat Intelligence Portal information and select Show information in Threat Lookup.
The event details area opens on the right with data from Kaspersky Threat Intelligence Portal, indicating the time when it was received on the bottom of the screen.
Page top
Integration with R-Vision Incident Response Platform
R-Vision Incident Response Platform (hereinafter referred to as R-Vision IRP) is a software platform used for automation of monitoring, processing, and responding to information security incidents. It aggregates cyberthreat data from various sources into a single database for further analysis and investigation to facilitate incident response capabilities.
R-Vision IRP can be integrated with KUMA. When this integration is enabled, the creation of a KUMA alert triggers the creation of an incident in R-Vision IRP. A KUMA alert and its R-Vision IRP incident are interdependent. When the status of an incident in R-Vision IRP is updated, the status of the corresponding KUMA alert is also changed.
Integration of R-Vision IRP and KUMA is configured in both applications.
Mapping KUMA alert fields to R-Vision IRP incident fields when transferring data via API
KUMA alert field |
R-Vision IRP incident field |
|
|
|
|
|
|
(as a JSON file) |
|
Configuring integration in KUMA
This section describes integration of KUMA with R-Vision IRP from the KUMA side.
Integration in KUMA is configured in the Settings → R-Vision Incident Response Platform section of the KUMA web interface.
To configure integration with R-Vision IRP:
- In the KUMA web interface, open Resources → Secrets.
The list of available secrets will be displayed.
- Click the Add secret button to create a new secret. This resource is used to store token for R-Vision IRP API requests.
The secret window is displayed.
- Enter information about the secret:
- In the Name field, enter a name for the added secret. The name must contain from 1 to 128 Unicode characters.
- In the Tenant drop-down list, select the tenant that will own the created resource.
- In the Type drop-down list, select token.
- In the Token field, enter your R-Vision IRP API token.
You can obtain the token in the R-Vision IRP web interface under Settings → General → API.
- If required, add the secret description in the Description field. The description must contain from 1 to 256 Unicode characters.
- Click Save.
The R-Vision IRP API token is now saved and can be used in other KUMA resources.
- In the KUMA web interface, open Settings → R-Vision.
The window containing R-Vision IRP integration settings opens.
- Make the necessary changes to the following parameters:
- Disabled—select this check box if you want to disable R-Vision IRP integration with KUMA.
- In the Secret drop-down list, select the previously created Secret resource.
You can create a new secret by clicking the button with the plus sign. The created secret will be saved in the Resources → Secrets section.
- URL (required)—URL of the R-Vision IRP server host.
- Field name where KUMA alert IDs must be placed (required)—name of the R-Vision IRP field where the ID of the KUMA alert must be written.
- Field name where KUMA alert URLs must be placed (required)—name of the R-Vision IRP field where the link for accessing the KUMA alert should be written.
- Category (required)—category of R-Vision IRP incident that is created after KUMA alert is received.
- KUMA event fields that must be sent to R-Vision (required)—drop-down list for selecting the KUMA event fields that should be sent to R-Vision IRP.
- Priority group of settings (required)—used to map KUMA priority values to R-Vision IRP priority values.
- Click Save.
In KUMA integration with R-Vision IRP is now configured. If integration is also configured in R-Vision IRP, when alerts appear in KUMA, information about those alerts will be sent to R-Vision IRP to create an incident. The Details on alert section in the KUMA web interface displays a link to R-Vision IRP.
If you are working with multiple tenants and want to integrate with R-Vision IRP, the names of tenants must match the abbreviated names of companies in R-Vision IRP.
Page top
Configuring integration in R-Vision IRP
This section describes KUMA integration with R-Vision IRP from the R-Vision IRP side.
Integration in R-Vision IRP is configured in the Settings section of the R-Vision IRP web interface. For details on configuring R-Vision IRP, please refer to the documentation on this application.
Configuring integration with KUMA consists of the following steps:
- Configuring R-Vision IRP user role
- Assign the Incident manager system role to the R-Vision IRP user utilized for integration. The role is assigned when a user is selected in the R-Vision IRP web interface in the Settings → General → System users section. The role is added in the System Roles block of settings.
R-Vision IRP user with the Incident Manager role
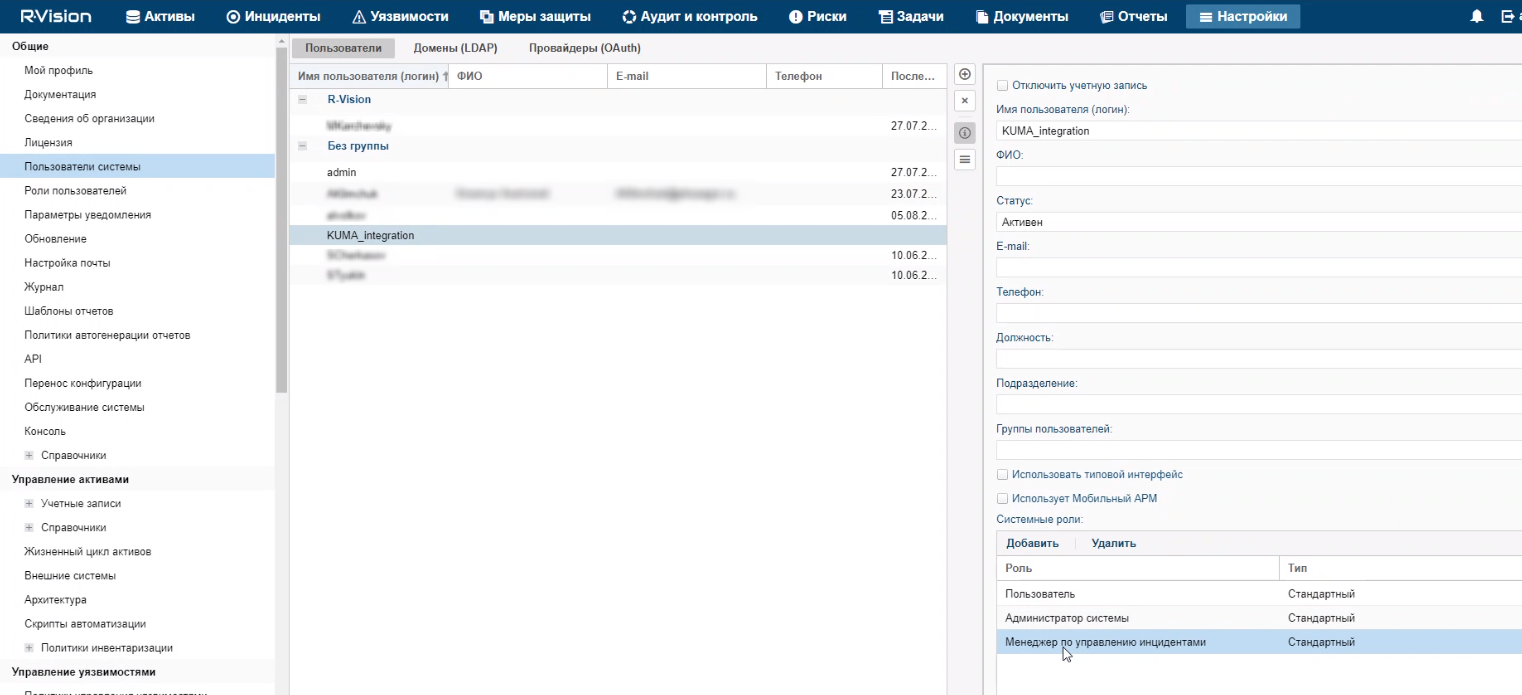
- Make sure that the API token of the R-Vision IRP user utilized for integration is indicated in the secret in the KUMA web interface. The token is displayed in the R-Vision IRP web interface under Settings → General → API.
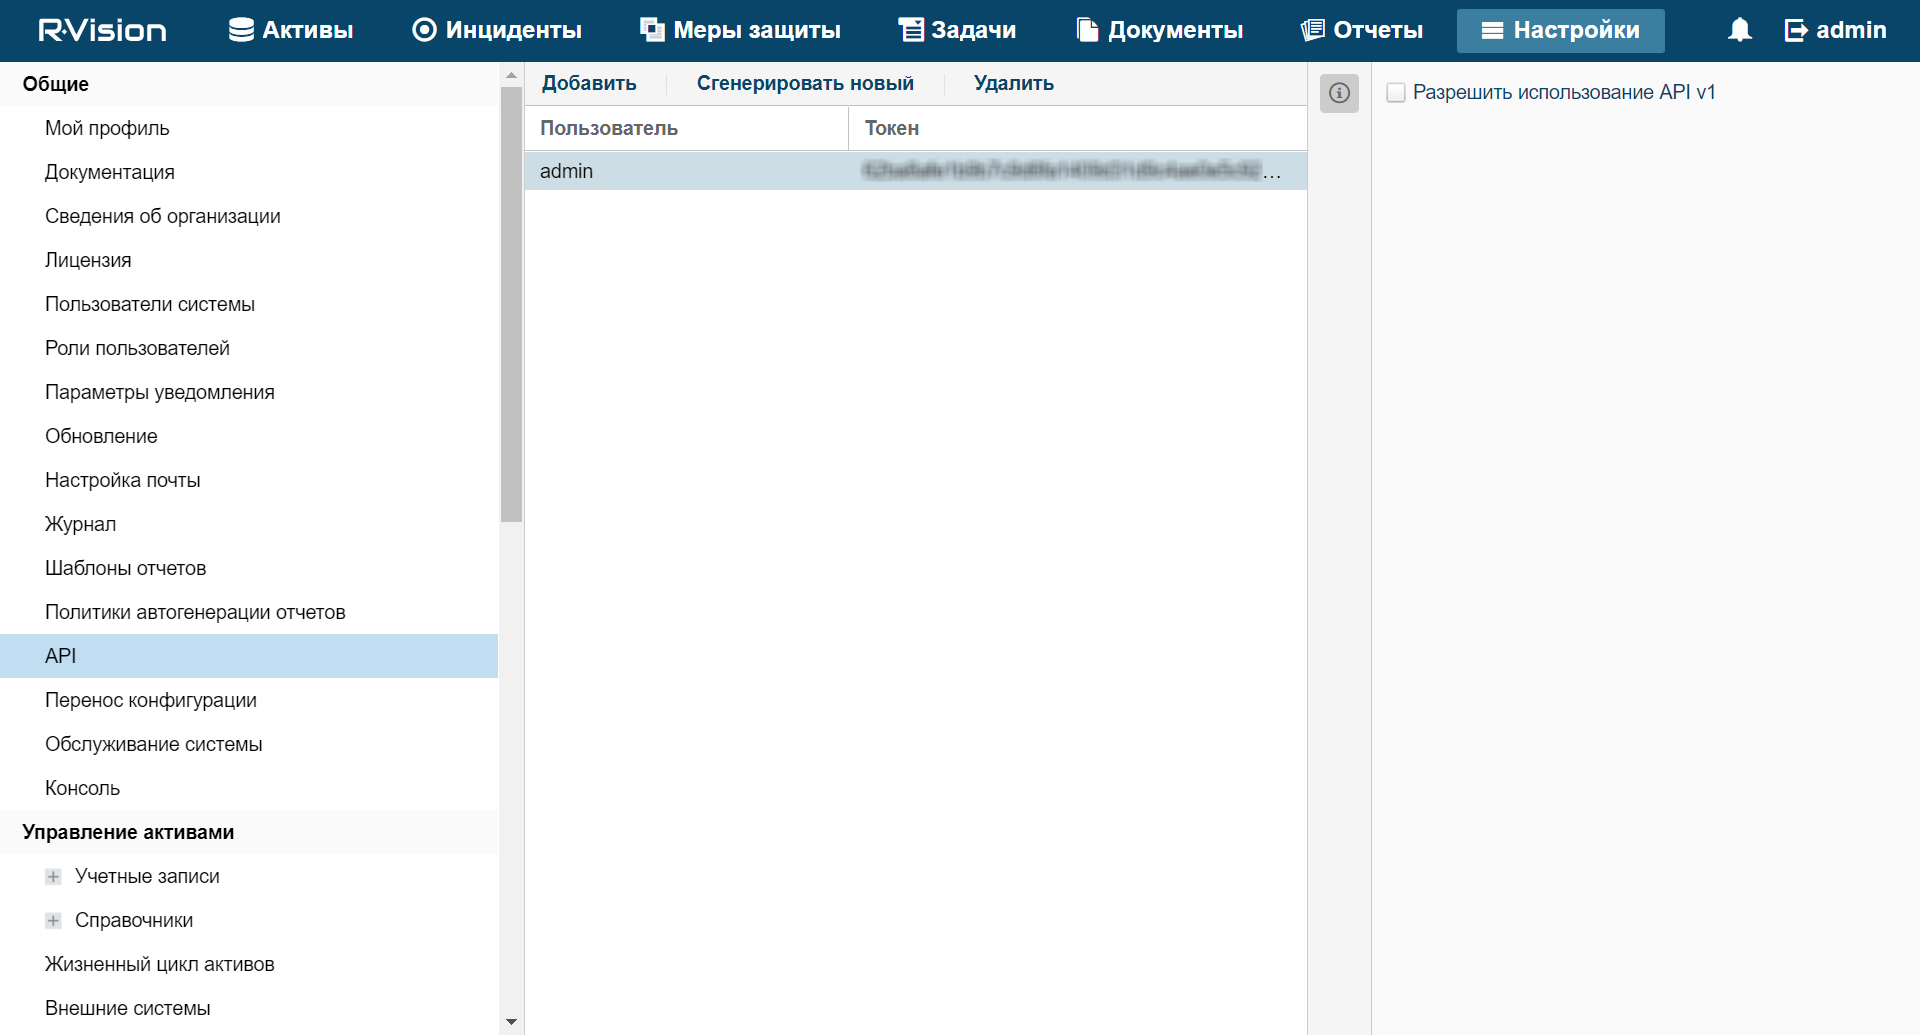
- Assign the Incident manager system role to the R-Vision IRP user utilized for integration. The role is assigned when a user is selected in the R-Vision IRP web interface in the Settings → General → System users section. The role is added in the System Roles block of settings.
- Configuring R-Vision IRP incident fields and KUMA alerts fields
- Add the ALERT_ID and ALERT_URL incident fields.
- Configure the category of R-Vision IRP incidents created based on KUMA alerts. You can do this in the R-Vision IRP web interface, in the Settings → Incident management → Incident categories section. Add a new incident category or edit an existing incident category by indicating the previously created
Alert IDandAlert URLincident fields in the Category fields settings block. TheAlert IDfield can be hidden.Categories of incidents containing data from KUMA alerts
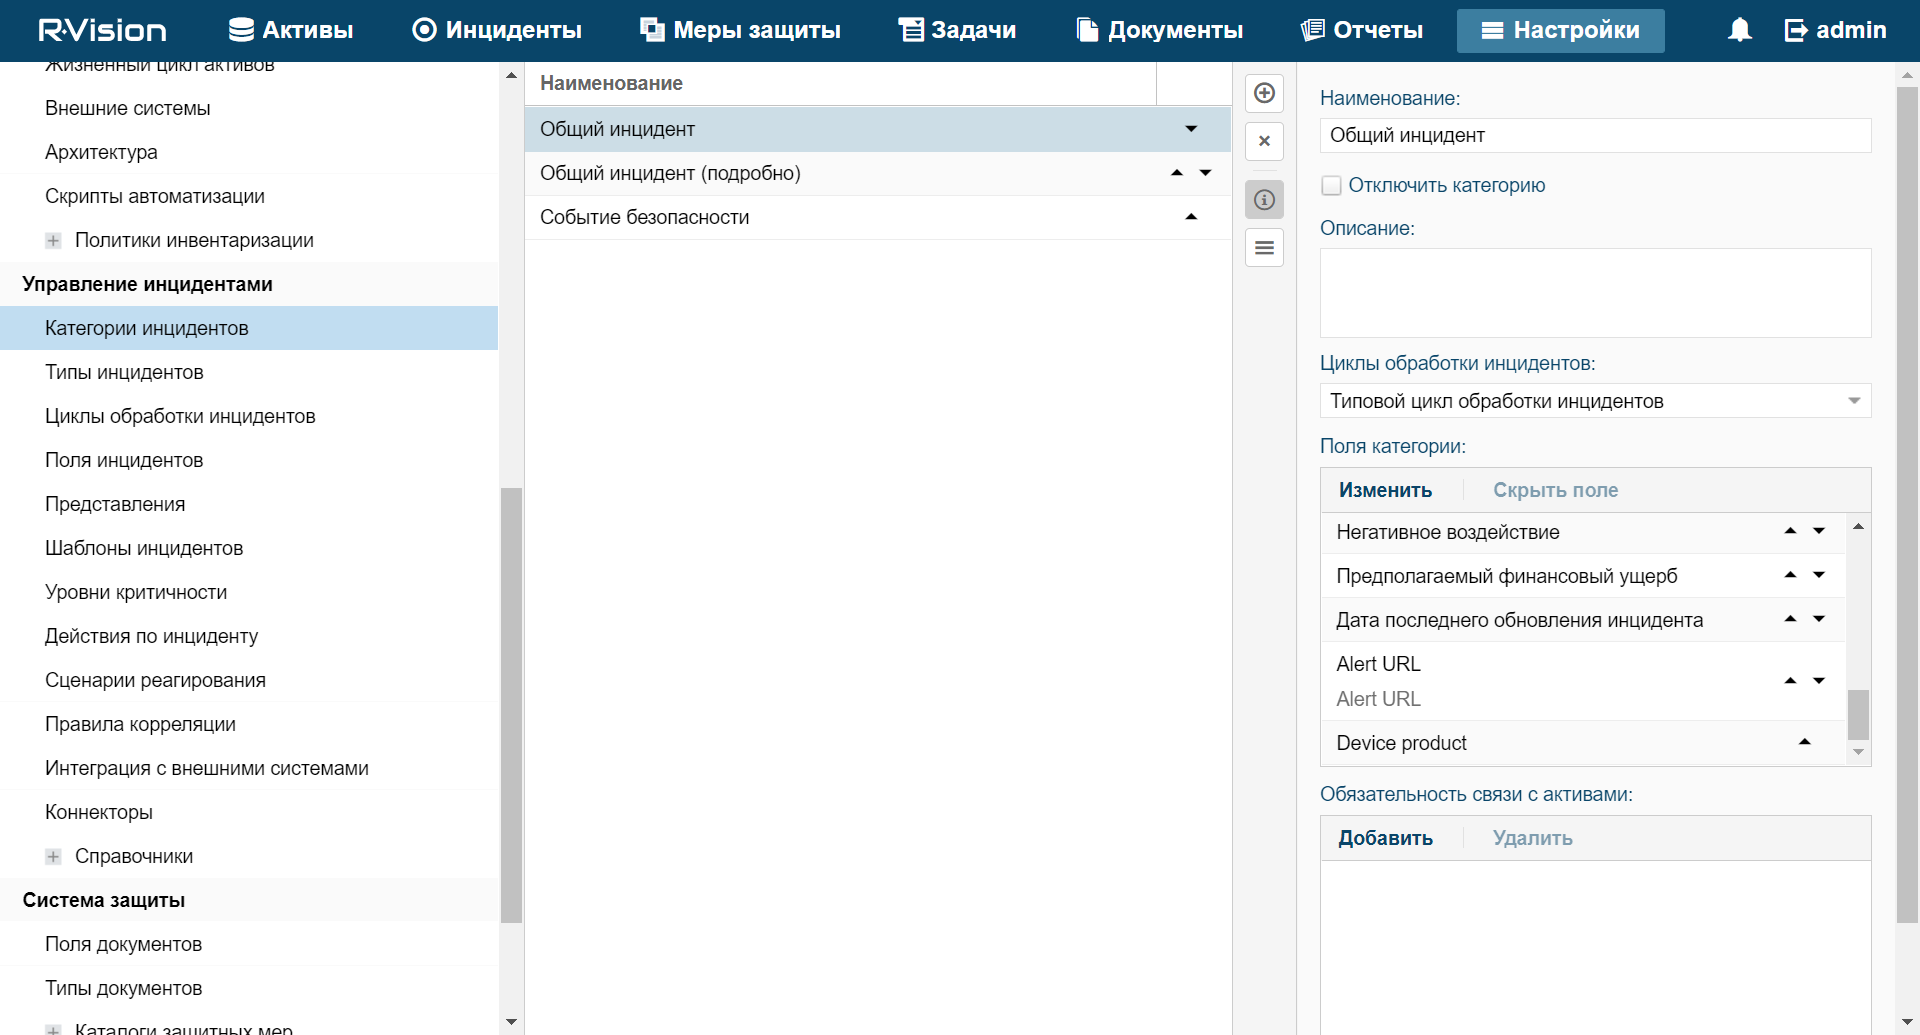
- Block editing of previously created
Alert IDandAlert URLincident fields. In the R-Vision IRP web interface, under Settings → Incident management → Presentation, select the category of R-Vision IRP incidents that will be created based on KUMA alerts and put a lock icon next to theAlert IDandAlert URLincident fields.Alert URL field unavailable for editing
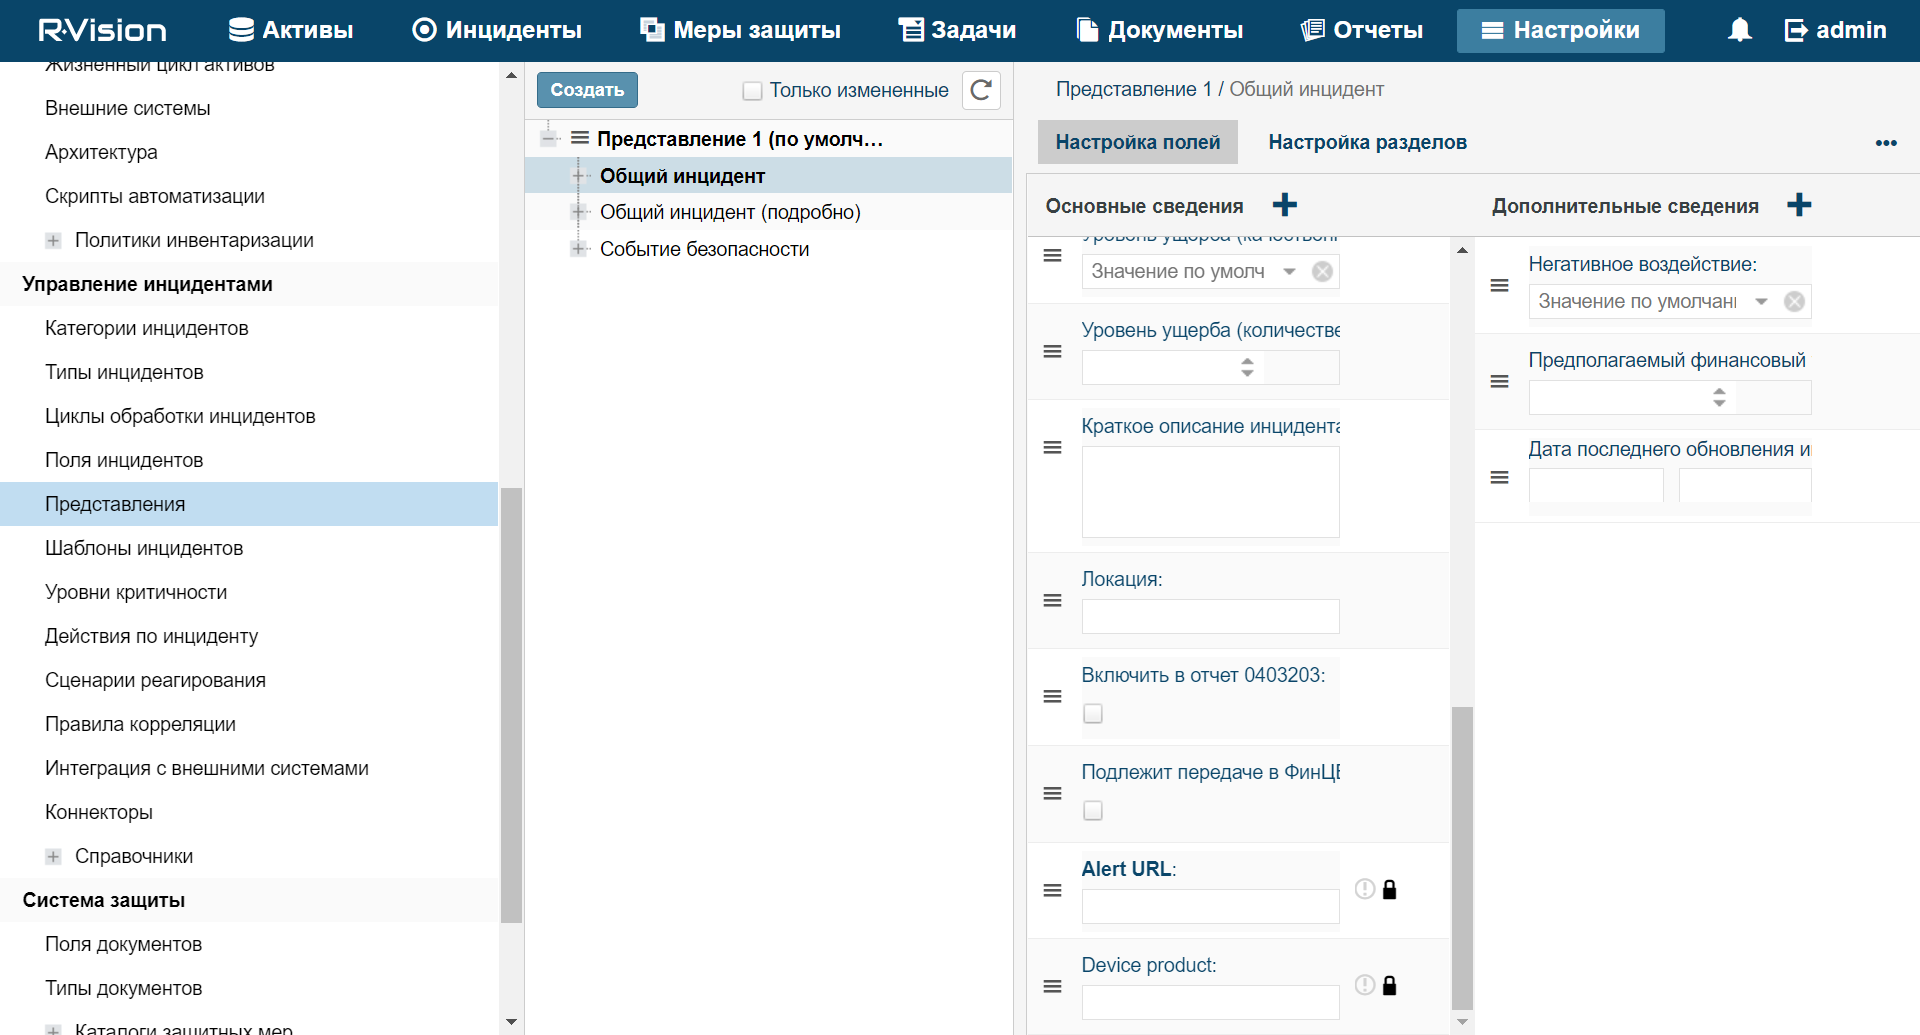
- Creating R-Vision IRP collector and connector
- Creating a rule to close a KUMA alert
Create a rule for sending KUMA alert closing request when R-Vision IRP incident is closed.
In R-Vision IRP integration with KUMA is now configured. If integration is also configured in KUMA, when alerts appear in KUMA, information about those alerts will be sent to R-Vision IRP to create an incident. The Details on alert section in the KUMA web interface displays a link to R-Vision IRP.
Adding the ALERT_ID and ALERT_URL incident fields
To add the ALERT_ID incident field in the R-Vision IRP:
- In the R-Vision IRP web interface, under Settings → Incident management → Incident fields, select the No group fields group.
- Click the plus icon in the right part of the screen.
The right part of the screen will display the settings area for the incident field you are creating.
- In the Title field, enter the name of the field (for example:
Alert ID). - In the Type drop-down list, select Text field.
- In the Parsing Tag field, enter
ALERT_ID.
ALERT_ID field added to R-Vision IRP incident.
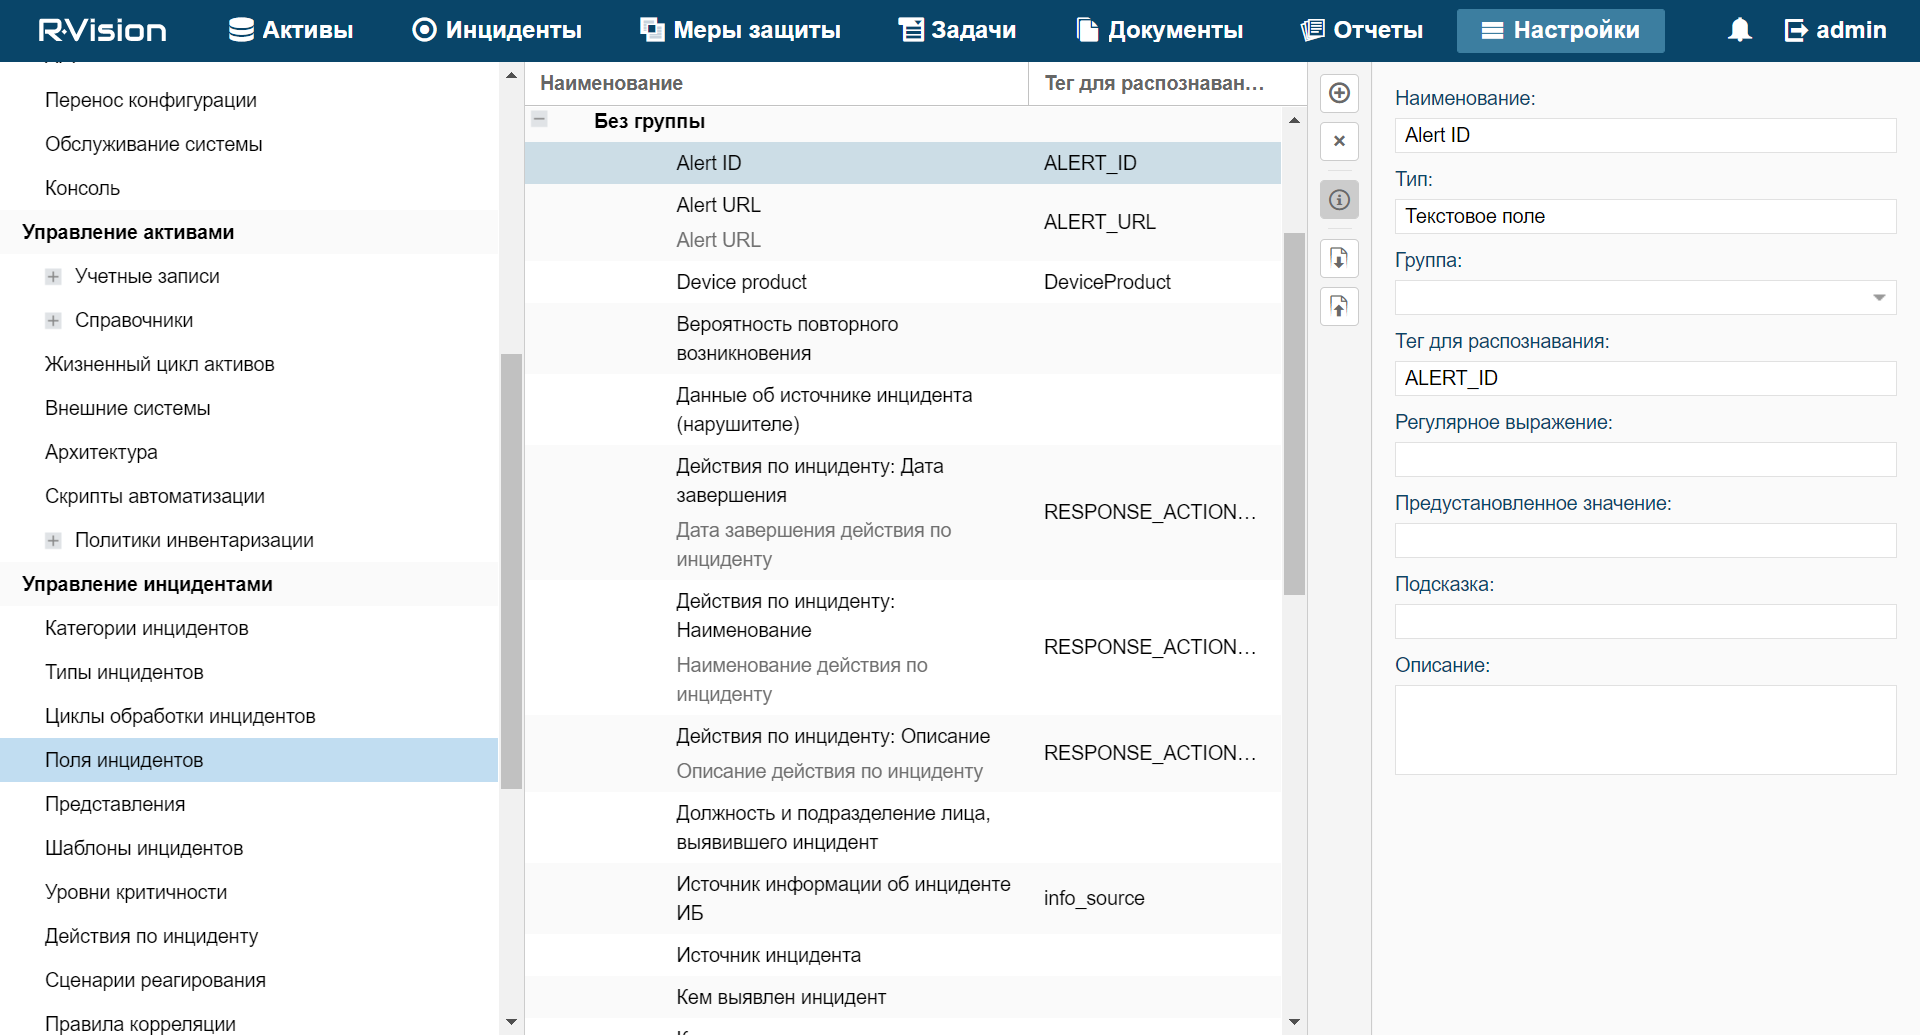
To add the ALERT_URL incident field in the R-Vision IRP:
- In the R-Vision IRP web interface, under Settings → Incident management → Incident fields, select the No group fields group.
- Click the plus icon in the right part of the screen.
The right part of the screen will display the settings area for the incident field you are creating.
- In the Title field, enter the name of the field (for example:
Alert URL). - In the Type drop-down list, select Text field.
- In the Parsing Tag field, enter
ALERT_URL. - Select the Display links and Display URL as links check boxes.
ALERT_URL field added to R-Vision IRP incident.
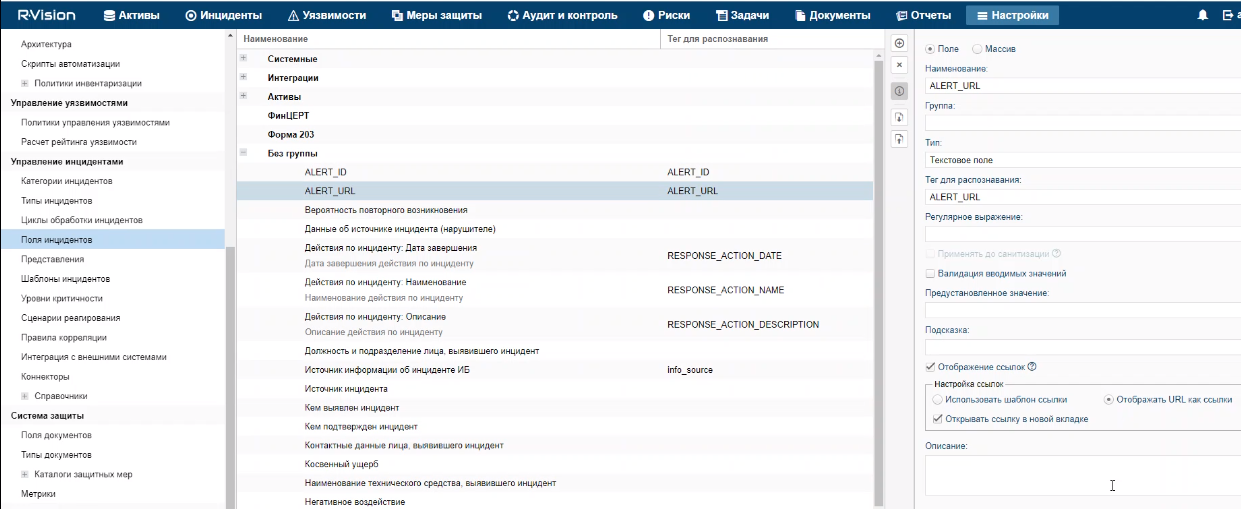
If necessary, you can likewise configure the display of other data from a KUMA alert in an R-Vision IRP incident.
Page top
Creating R-Vision IRP collector
To create R-Vision IRP collector:
- In the R-Vision IRP web interface, under Settings → Asset Management → System components, click the plus icon.
- Specify the collector name in the Name field (for example,
Main collector). - In the Collector address field, enter the IP address or hostname where the R-Vision IRP is installed (example:
127.0.0.1). - In the Port field type
3001. - Select Default collector and Use for reaction check boxes.
- Click Add.
R-Vision IRP collector created.
Page top
Creating connector in R-Vision IRP
To create connector in R-Vision IRP:
- In the R-Vision IRP web interface, under Settings → Incident management → Connectors, click the plus icon.
- In the Type drop-down list, select REST.
- In the Name field, specify the connector name, such as
KUMA. - In the URL field type API request to close an alert in the format
<KUMA Core server FQDN>:<Port used for API requests (7223 by default)>/api/v1/alerts/close.Example:
https://kuma-example.com:7223/api/v1/alerts/close - In the Authorization type drop-down list, select Token.
- In the Auth header field type
Authorization. - In the Auth value field enter the token of KUMA user with general administrator role in the following format:
Bearer <KUMA General administrator token> - In the Collector drop-down list select previously created collector.
- Click Save.
R-Vision IRP connector is created.
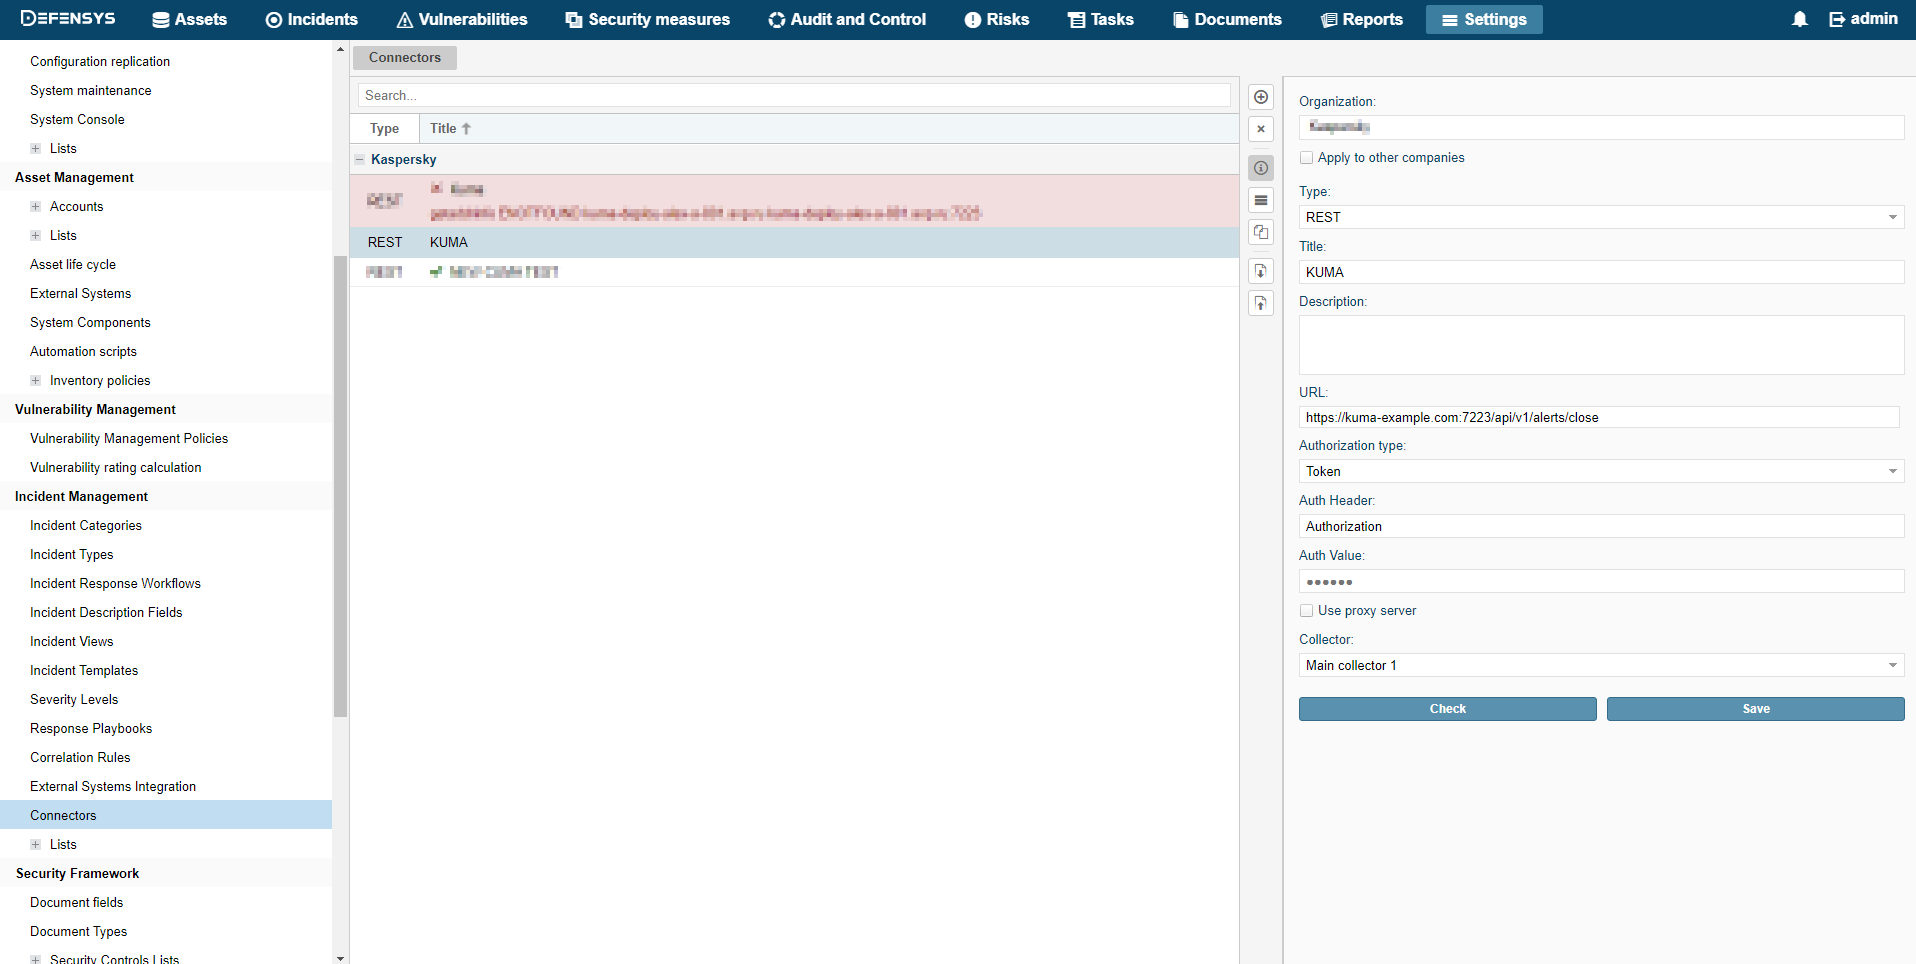
When connector is created you must configure sending API queries for closing alerts in KUMA.
To configure API queries in R-Vision IRP:
- In the R-Vision IRP web interface, under Settings → Incident management → Connectors open for editing a newly created connector.
- In the request type drop-down list, select POST.
- In the Params field type API request to close an alert in the format
<KUMA Core server FQDN>:<Port used for API requests (7223 by default)>/api/v1/alerts/close.Example:
https://kuma-example.com:7223/api/v1/alerts/close - On the HEADERS tab add the following keys and values:
- Key
Content-Type; value:application/json. - Key
Authorization; value:Bearer <KUMA general administrator token>.The token of the KUMA general administrator can be obtained in the KUMA web interface under Settings → Users.
- Key
- On the BODY → Raw tab type contents of the API request body:
{"id":"{{tag.ALERT_ID}}","reason":"<Reason for closing the alert. Available values: "Incorrect Correlation Rule", "Incorrect Data", "Responded".> "} - Click Save.
R-Vision IRP connector is configured.
API request header
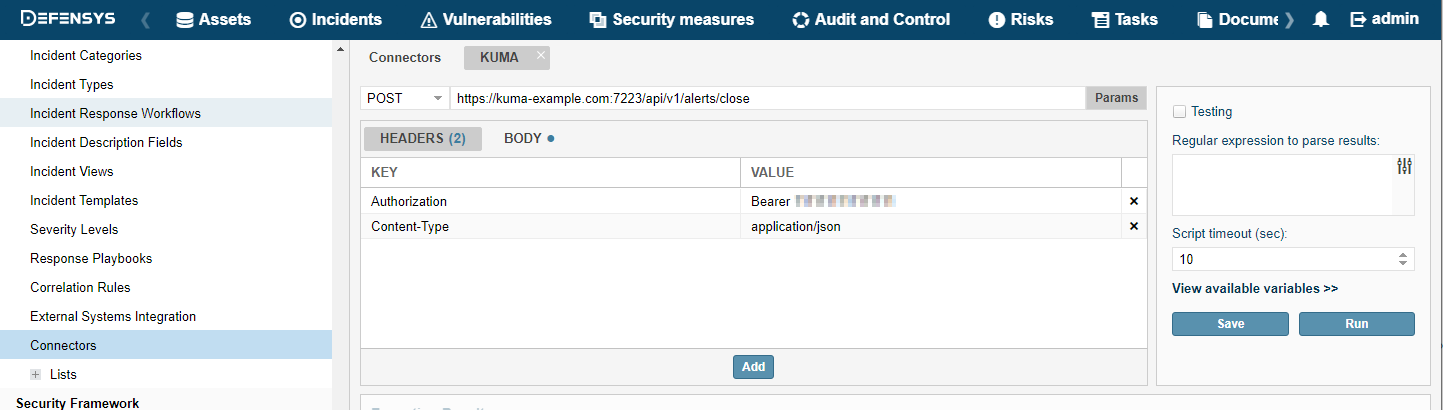
API request body
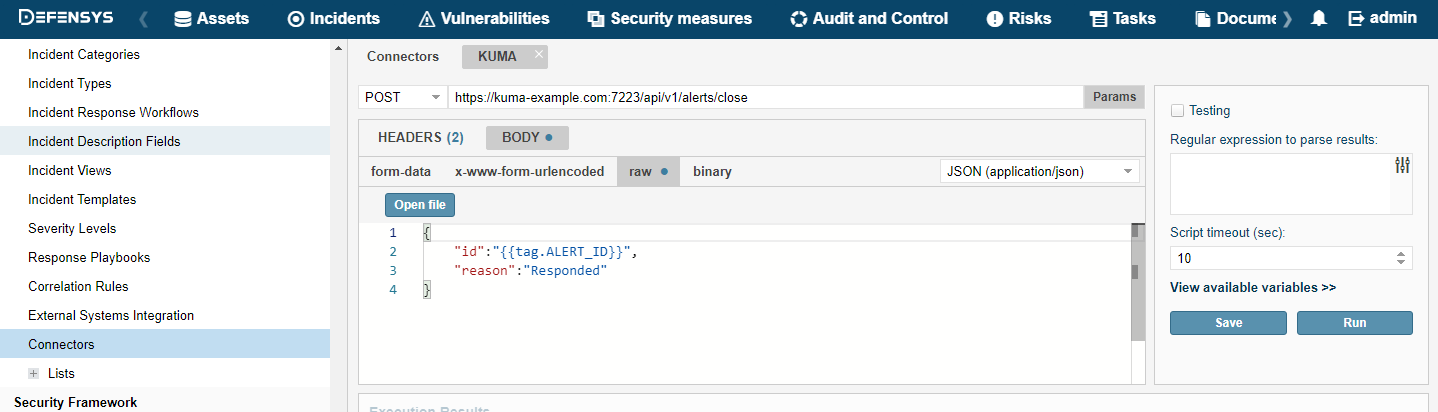
Creating rule for closing KUMA alert when R-Vision IRP incident is closed
To create a rule for sending KUMA alert closing request when R-Vision IRP incident is closed:
- In the R-Vision IRP web interface, under Settings → Incident management → Response playbooks, click the plus icon.
- In the Name field, type the name of the rule, for example,
Close alert. - In the Group drop-down list select All playbooks.
- In the Autostart criteria settings block, click Add and enter the conditions for triggering the rule in the opened window:
- In the Type drop-down list, select Field value.
- In the Field drop-down list, select Incident status.
- Select the Closed status.
- Click Add.
Rule trigger conditions are added. The rule will trigger when an incident is closed.
- In the Incident Response Actions settings block, click Add → Run connector. In the opened window, select the connector that should be run when the rule is triggered:
- In the Connector drop-down list select previously created connector.
- Click Add.
Connector added to the rule.
- Click Add.
A rule for sending KUMA alert closing request when R-Vision IRP incident created.
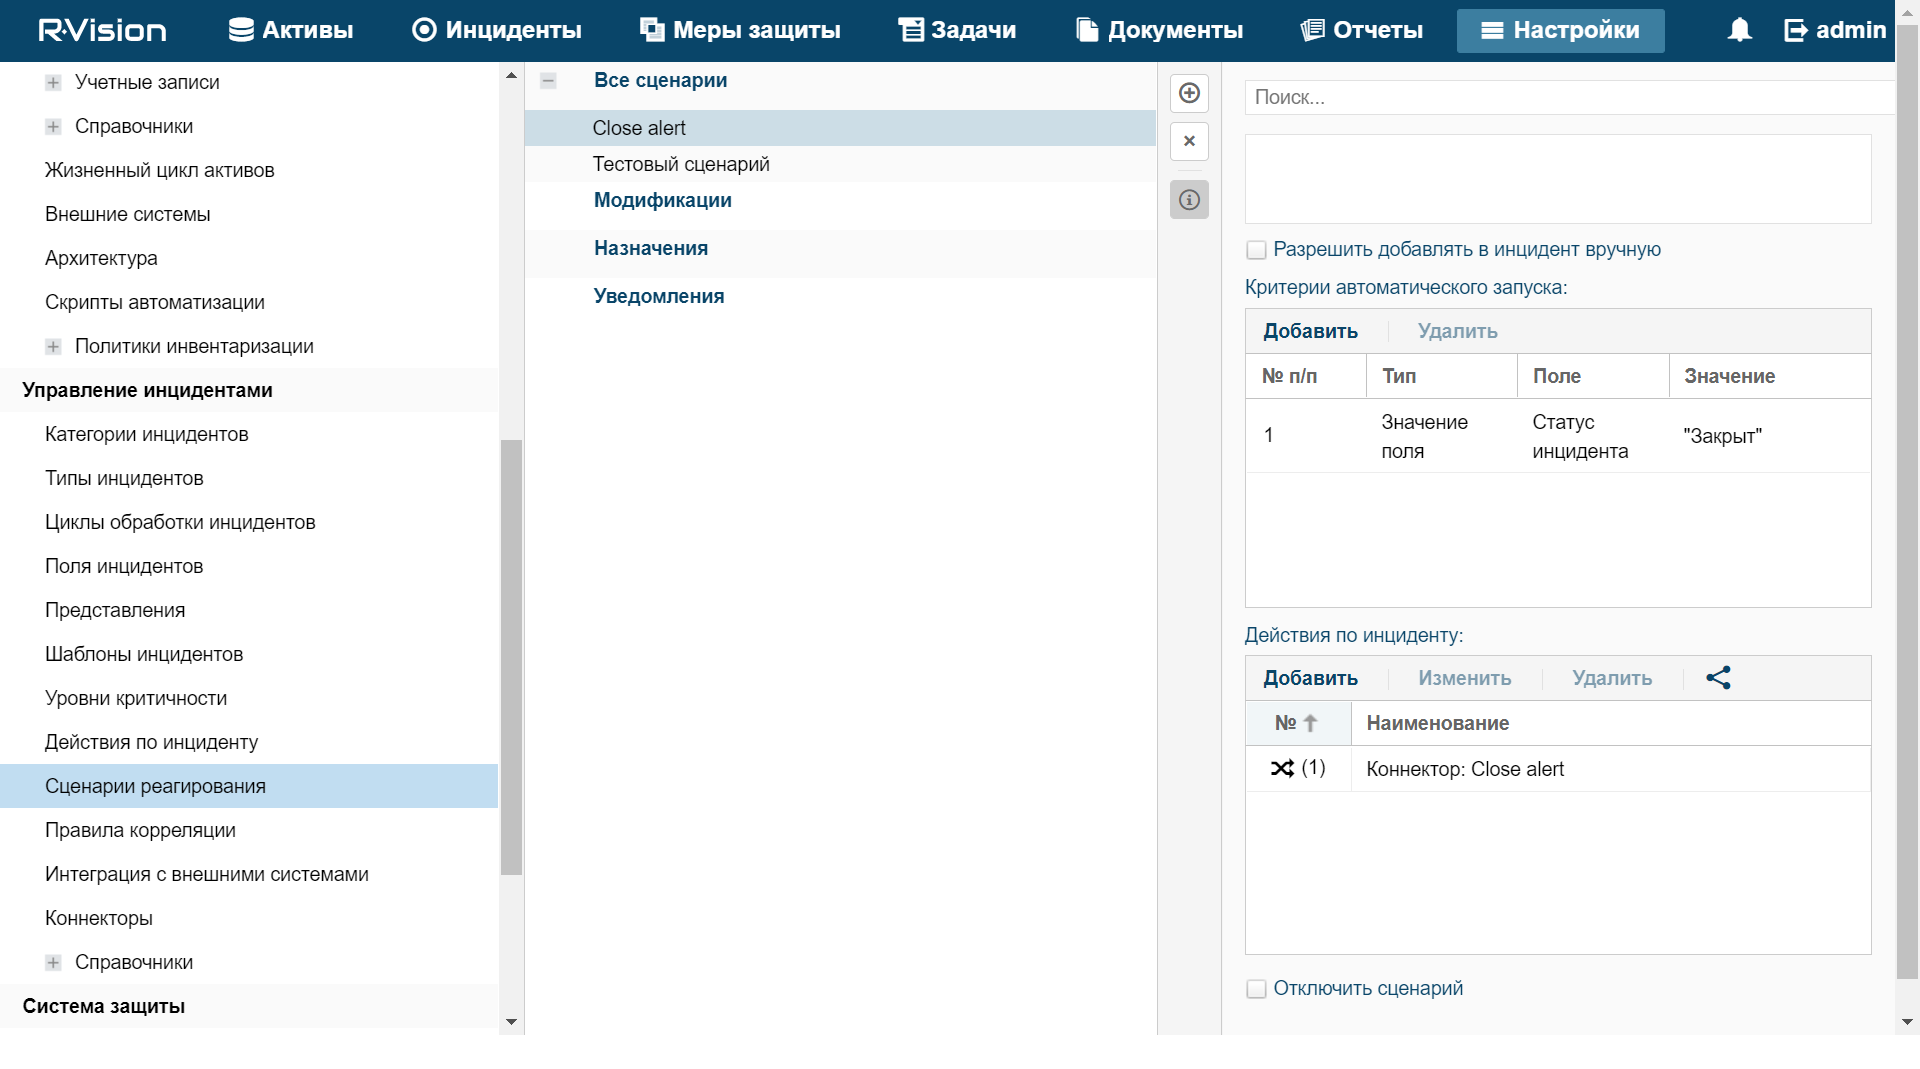
Managing alerts using R-Vision IRP
After integration of KUMA and R-Vision IRP is configured, data on KUMA alerts is received in R-Vision IRP. Any change to alert settings in KUMA is reflected in R-Vision IRP. Any change in the statuses of alerts in KUMA or R-Vision IRP (except closing an alert) is also reflected in the other system.
Alert management scenarios when KUMA and R-Vision IRP are integrated:
- Forward cyberthreat data from KUMA to R-Vision IRP
Data on detected alerts is automatically forwarded from KUMA to R-Vision IRP. An incident is also created in R-Vision IRP.
The following information about a KUMA alert is forwarded to R-Vision IRP:
- ID.
- Name.
- Status.
- Date of the first event related to the alert.
- Date of the last detection related to the alert.
- User account name or email address of the security officer assigned to process the alert.
- Alert priority.
- Category of the R-Vision IRP incident corresponding to the KUMA alert.
- Hierarchical list of events related to the alert.
- List of alert-related assets (internal and external).
- List of users related to the alert.
- Alert change log.
- Link to the alert in KUMA.
- Investigate cyberthreats in KUMA
Initial processing of an alert is performed in KUMA. The security officer can update and change any parameters of an alert except its ID and name. Any implemented changes are reflected in the R-Vision IRP incident card.
If a cyberthreat turns out to be a false positive and its alert is closed in KUMA, its corresponding incident in R-Vision IRP is also automatically closed.
- Close incident in R-Vision IRP
After all necessary work is completed on an incident and the course of the investigation is recorded in R-Vision IRP, the incident is closed. The corresponding KUMA alert is also automatically closed.
- Open a previously closed incident
If active monitoring detects that an incident was not completely resolved or if additional information is detected, this incident is re-opened in R-Vision IRP. However, the alert remains closed in KUMA.
The security officer can use a link to navigate from an R-Vision IRP incident to the corresponding alert in KUMA and make the necessary changes to any of its parameters except the ID, name, and status of the alert. Any implemented changes are reflected in the R-Vision IRP incident card.
Further analysis is performed in R-Vision IRP. When the investigation is complete and the incident is closed again in R-Vision IRP, the status of the corresponding alert in KUMA remains closed.
- Request additional data from the source system as part of the response playbook or manually
If additional information is required from KUMA when analyzing incidents in R-Vision IRP, you can send to KUMA a search request (for example, you can request telemetry data, reputation, host info). This request is sent via REST API KUMA and the response is recorded in the R-Vision IRP incident card for further analysis and report generation.
This same sequence of actions is performed during automatic processing if it is not possible to immediately save all information on an incident during an import.
Integration with Active Directory
You can integrate KUMA with the Active Directory services that are being used in your organization.
You can configure a connection to the Active Directory catalog service over the LDAP protocol. This lets you use information from Active Directory in correlation rules for enrichment of events and alerts, and for analytics.
If you configure a connection to a domain controller server, you can use domain authorization. In this case, you will be able to bind groups of users from Active Directory to KUMA role filters. The users belonging to these groups will be able to use their domain account credentials to log in to the KUMA web interface and will obtain access to application sections based on their assigned role.
It is recommended to create these groups of users in Active Directory in advance if you want to provide such groups with the capability to complete authorization using their domain account in the KUMA web interface. An email address must be indicated in the properties of a user account in Active Directory.
Connecting over LDAP
LDAP connections are created and managed under Settings → LDAP server connections in the KUMA web interface. The LDAP server connections table shows the tenants for which LDAP connections were created. When a tenant is selected, the connections with LDAP servers created for it are displayed.
To add a tenant to the LDAP server connections section:
- In the KUMA web interface, under Settings → LDAP server connections, click Add.
- In the LDAP connections window, in the Tenant drop-down list, select the relevant tenant and click Save.
The tenant will be added and displayed in the LDAP server connections table.
If you select a tenant, the LDAP connections window opens to show a table containing existing LDAP connections. Connections can be created or selected for editing.
After integration is enabled, information about Active Directory accounts becomes available in the alert window, the correlation events detailed view window, and the incidents window. If you click an account name in the Related users section of the window, the Account details window opens with the data imported from Active Directory.
Data from LDAP can also be used when enriching events in collectors and in analytics.
Imported Active Directory attributes
In the Data storage time field, you can specify how many days KUMA will store information received from LDAP after such information stops being received from the Active Directory server.
Enabling and disabling LDAP integration
You can enable or disable all LDAP connections of the tenant at the same time, or enable and disable an LDAP connection individually.
To enable or disable all LDAP connections of a tenant:
- Open Settings → LDAP server connections in the KUMA web interface and select the tenant for which you want to enable or disable all LDAP connections.
The LDAP connections window opens.
- Select or clear the Disabled check box.
- Click Save.
To enable or disable a specific LDAP connection:
- Open Settings → LDAP server connections in the KUMA web interface and select the tenant for which you want to enable or disable an LDAP connection.
The LDAP connections window opens.
- Select the relevant connection and either select or clear the Disabled check box in the opened window.
- Click Save.
Creating a connection
To create a new LDAP connection to Active Directory:
- Open the Settings → LDAP server connections section in the KUMA web interface.
- Select the tenant for which you want to create a connection to LDAP.
The LDAP connections window opens.
- Click the Add LDAP connection button.
The LDAP connection window opens.
- Add a secret containing the account credentials for connecting to the Active Directory server. To do so:
- If you previously added a secret, use the Secret drop-down list to select the existing secret resource (with the credentials type).
The selected secret can be changed by clicking on the
 button.
 - If you want to create a new secret, click the
 button.
The Secret window opens.
- In the Name (required) field, enter the name of the resource. This name can contain from 1 to 128 Unicode characters.
- In the User and Password (required) fields, enter the account credentials for connecting to the Active Directory server.
You can enter the user name in one of the following formats: <user name>@<domain> or <domain><user name>.
- In the Description field, you can enter up to 256 Unicode characters to describe the resource.
- Click the Save button.
- If you previously added a secret, use the Secret drop-down list to select the existing secret resource (with the credentials type).
- In the Name (required) field, enter the unique name of the LDAP connection.
Must contain from 1 to 128 Unicode characters.
- In the URL (required) field, enter the address of the domain controller in the format
<hostname or IP address of server>:<port>.In case of server availability issues, you can specify multiple servers with domain controllers by separating them with commas. All of the specified servers must reside in the same domain.
- If you want to use TLS encryption for the connection with the domain controller, select one of the following options from the Type drop-down list:
- startTLS.
When the
method is used, first it establishes an unencrypted connection over port 389, then it sends an encryption request. If the STARTTLS command ends with an error, the connection is terminated.Make sure that port 389 is open. Otherwise, a connection with the domain controller will be impossible.
- ssl.
When using SSL, an encrypted connection is immediately established over port 636.
- insecure.
When using an encrypted connection, it is impossible to specify an IP address as a URL.
- startTLS.
- If you enabled TLS encryption at the previous step, add a TLS certificate. To do so:
- If you previously uploaded a certificate, select it from the Certificate drop-down list.
If no certificate was previously added, the drop-down list shows No data.
- If you want to upload a new certificate, click the
 button on the right of the Certificate list.
The Secret window opens.
- In the Name field, enter the name that will be displayed in the list of certificates after the certificate is added.
- Click the Upload certificate file button to add the file containing the Active Directory certificate. X.509 certificate public keys in Base64 are supported.
- If necessary, provide any relevant information about the certificate in the Description field.
- Click the Save button.
The certificate will be uploaded and displayed in the Certificate list.
- If you previously uploaded a certificate, select it from the Certificate drop-down list.
- In the Timeout in seconds field, indicate the amount of time to wait for a response from the domain controller server.
If multiple addresses are indicated in the URL field, KUMA will wait the specified number of seconds for a response from the first server. If no response is received during that time, the program will contact the next server, and so on. If none of the indicated servers responds during the specified amount of time, the connection will be terminated with an error.
- In the Search base (Base DN) field, enter the base distinguished name of the directory in which you need to run the search query.
- Select the Disabled check box if you do not want to use this LDAP connection.
This check box is cleared by default.
- Click the Save button.
The LDAP connection to Active Directory will be created and displayed in the LDAP connection window.
Account information from Active Directory will be requested in 12 hours. To make the data available right away, restart the KUMA Core server. Account information is updated every 12 hours.
If you want to use multiple LDAP connections simultaneously for one tenant, you need to make sure that the domain controller address indicated in each of these connections is unique. Otherwise KUMA lets you enable only one of these connections. When checking the domain controller address, the program does not check whether the port is unique.
Page top
Creating a copy of a connection
You can create an LDAP connection by copying an already existing connection. In this case, all settings of the original connection are duplicated in the newly created connection.
To copy an LDAP connection:
- Open Settings → LDAP in the KUMA web interface and select the tenant for which you want to copy an LDAP connection.
The LDAP connections window opens.
- Select the relevant connection.
- In the opened LDAP connection window, click the Duplicate settings button.
The New Connection window opens.
- If you want to change the connection settings, you can enter the necessary changes for one or more settings.
- Click the Save button.
A copy of the connection will be created.
If you want to use multiple LDAP connections simultaneously for one tenant, you need to make sure that the domain controller address indicated in each of these connections is unique. Otherwise KUMA lets you enable only one of these connections. When checking the domain controller address, the program does not check whether the port is unique.
Page top
Removing a connection
To delete LDAP connection to Active Directory:
- Open Settings → LDAP server connections in the KUMA web interface and select the tenant that owns the relevant LDAP connection.
The LDAP connections window opens.
- Click the LDAP connection you want to delete and click the Delete button.
The LDAP connection to Active Directory will be deleted.
Page top
Authorization with domain accounts
To enable users to complete authorization in the KUMA web interface using their own domain account credentials, you must complete the following configuration steps.
- Enable domain authorization if it is disabled.
Domain authorization is enabled by default, but a connection to the domain is not yet configured.
- Configure a connection to the domain controller.
You can connect only to one domain.
- Add groups of user roles.
You can specify an Active Directory group for each KUMA role. After completing authorization using their own domain accounts, users from this group will obtain access to the KUMA web interface in accordance with their defined role.
The program checks whether the Active Directory user group matches the specified filter according to the following order of roles in the KUMA web interface: operator → analyst → tenant administrator → general administrator. Upon the first match, the program assigns a role to the user and does not check any further. If a user matches two groups in the same tenant, the role with the least privileges will be used. If multiple groups are matched for different tenants, the user will be assigned the specified role in each tenant.
If you completed all the configuration steps but the user is unable to use their domain account for authorization in the KUMA web interface, it is recommended to check the configuration for the following issues:
- An email address is not indicated in the properties of the user account in Active Directory. If this is the case, an error message is displayed during the user's first authorization attempt and a KUMA account will not be created.
- There is already an existing local KUMA account with the email address indicated in the domain account properties. If this is the case, the user will see an error message when attempting authorization with the domain account.
- Domain authorization is disabled in the KUMA settings.
- An error was made when entering the group of roles.
- The domain user name contains a space.
Enabling and disabling domain authorization
Domain authorization is enabled by default, but a connection to the Active Directory domain is not yet configured. If you want to temporarily pause domain authorization after configuring a connection, you can disable it in the KUMA web interface without deleting the previously defined values of settings. If necessary, you will be able to enable authorization again at any time.
To enable or disable domain authorization of users in the KUMA web interface:
- In the program web interface, select Settings → Domain authorization.
- Do one of the following:
- If you want to disable domain authorization, select the Disabled check box in the upper part of the workspace.
- If you want to enable domain authorization, clear the Disabled check box in the upper part of the workspace.
- Click the Save button.
Domain authorization will be enabled or disabled based on your selection.
Page top
Configuring a connection to the domain controller
You can connect only to one Active Directory domain. To do so, you must configure a connection to the domain controller.
To configure a connection to an Active Directory domain controller.
- In the program web interface, select Settings → Domain authorization.
- In the Connection settings block, in the Base DN field, enter the DistinguishedName of the root record to search for access groups in the Active Directory catalog service.
- In the URL field, indicate the address of the domain controller in the format
<hostname or IP address of server>:<port>.In case of server availability issues, you can specify multiple servers with domain controllers by separating them with commas. All of the specified servers must reside in the same domain.
- If you want to use TLS encryption for the connection with the domain controller, select one of the following options from the TLS mode drop-down list:
- startTLS.
When the startTLS method is used, first it establishes an unencrypted connection over port 389, then it sends an encryption request. If the STARTTLS command ends with an error, the connection is terminated.
Make sure that port 389 is open. Otherwise, a connection with the domain controller will be impossible.
- ssl.
When using SSL, an encrypted connection is immediately established over port 636.
- insecure.
When using an encrypted connection, it is impossible to specify an IP address as a URL.
- startTLS.
- If you enabled TLS encryption at the previous step, add a TLS certificate:
- If you previously uploaded a certificate, select it from the Secret drop-down list.
If no certificate was previously added, the drop-down list shows No data.
- If you want to upload a new certificate, click the button on the right of the Secret list. In the opened window, in the Name field, enter the name that will be displayed in the list of certificates after the certificate is added. Add the file containing the Active Directory certificate (X.509 certificate public keys in Base64 are supported) by clicking the Upload certificate file button. Click the Save button.
The certificate will be uploaded and displayed in the Secret list.
- If you previously uploaded a certificate, select it from the Secret drop-down list.
- In the Timeout in seconds field, indicate the amount of time to wait for a response from the domain controller server.
If multiple addresses are indicated in the URL field, KUMA will wait the specified number of seconds for a response from the first server. If no response is received during that time, the program will contact the next server, and so on. If none of the indicated servers responds during the specified amount of time, the connection will be terminated with an error.
- If you want to configure domain authorization for a user with the KUMA general administrator role, specify the DistinguishedName of the Active Directory group containing the user in the General administrators group field.
If a user matches two groups in the same tenant, the role with the least privileges will be used.
Filter input example:
CN=KUMA team,OU=Groups,OU=Clients,DC=test,DC=domain. - Click the Save button.
A connection with the Active Directory domain controller is now configured. For domain authorization to work, you must also add group of KUMA user roles.
Page top
Adding groups of user roles
You can specify groups only for those roles that require configuration of domain authorization. You can leave the rest of the fields empty.
To add groups of user roles:
- In the program web interface, select Settings → Domain authorization.
- In the Role groups settings block, click the Add role groups button.
- In the Tenant drop-down list, select the tenant of the users for whom you want to configure domain authorization.
- In the fields for the following roles, specify the DistinguishedName of the Active Directory group whose users must have the capability to complete authorization with their domain accounts:
- Operator.
- Analyst.
- Administrator.
Group input example:
CN=KUMA team,OU=Groups,OU=Clients,DC=test,DC=domain.You can specify only one Active Directory group for each role. If you need to specify multiple groups, you must repeat steps 2–4 for each group while indicating the same tenant.
- If necessary, repeat steps 2–4 for each tenant for which you want to configure domain authorization with operator, analyst, and tenant administrator roles.
- Click the Save button.
The groups of user roles will be added. The defined settings will be applied the next time the user logs in to the KUMA web interface.
After the first authorization of the user, information about them is displayed under Settings → Users. The Login and Password fields received from Active Directory will be unavailable for editing. The user role will also be unavailable for editing. To edit a role, you will have to change the user role groups. Changes to a role are applied after the next authorization of the user. The user will continue to operate under the old role until the current session expires.
If the user name or email address is changed in the Active Directory account properties, these changes will need to be manually entered into the KUMA account.
Page top
Integration with RuCERT
In the KUMA web interface, you can create a connection to the National Coordinating Center for Computer Incidents (hereinafter referred to as "RuCERT"). This will let you export incidents registered by KUMA to RuCERT. Integration is configured under Settings → RuCERT in the KUMA web interface.
You can use the Disabled check box to enable or disable integration.
To create a connection to RuCERT:
- In the KUMA web interface, open Settings → RuCERT.
- In the URL field, enter the URL for accessing RuCERT.
- In the Token settings block, create or select an existing secret resource with the API token that was issued to your organization for a connection to RuCERT:
- If you already have a secret, you can select it from the drop-down list.
- If you want to create a new secret:
- Click the button and specify the following settings:
- Name (required)—unique name of the service you are creating. The name must contain from 1 to 128 Unicode characters.
- Token (required)—token that was issued to your organization for a connection to RuCERT.
- Description—service description containing up to 256 Unicode characters.
- Click Save.
The secret containing the token for connecting to RuCERT will be created. It is saved under Resources → Secrets and is owned by the main tenant.
- Click the
The selected secret can be changed by clicking on the
button. - In the Affected system function drop-down list, select the area of activity of your organization.
- In the Company field, indicate the name of your company. This data will be forwarded to RuCERT when incidents are exported.
- Use the Location drop-down list to specify where your company is located. This data will be forwarded to RuCERT when incidents are exported.
- If necessary, in the Proxy settings block, create or select an existing proxy server resource that should be used when connecting to RuCERT.
- Click Save.
KUMA is now integrated with RuCERT. Now you can export incidents to it.
Page top
Integration with Security Vision Incident Response Platform
Security Vision Incident Response Platform (hereinafter referred to as Security Vision IRP) is a software platform used for automation of monitoring, processing, and responding to information security incidents. It aggregates cyberthreat data from various sources into a single database for further analysis and investigation to facilitate incident response capabilities.
Security Vision IRP can be integrated with KUMA. After configuring integration in Security Vision IRP, you can perform the following tasks:
- Request information about alerts from KUMA. In Security Vision IRP, incidents are created based on received data.
- Send requests to KUMA to close alerts.
Integration is implemented by using the KUMA REST API. On the Security Vision IRP side, integration is carried out by using the preconfigured Kaspersky KUMA connector. Contact your Security Vision IRP vendor to learn more about the methods and conditions for obtaining a Kaspersky KUMA connector.
Working with Security Vision IRP incidents
Security Vision IRP incidents generated from KUMA alert data can be viewed in Security Vision IRP under Инциденты (Incidents) → Инциденты (2 линии) (Incidents (2 line)) → Все инциденты (2 линии) (All incidents (2 line)). Events related to KUMA alerts are logged in each Security Vision IRP incident. Imported events can be viewed on the Response tab.
KUMA alert imported as Security Vision IRP incident
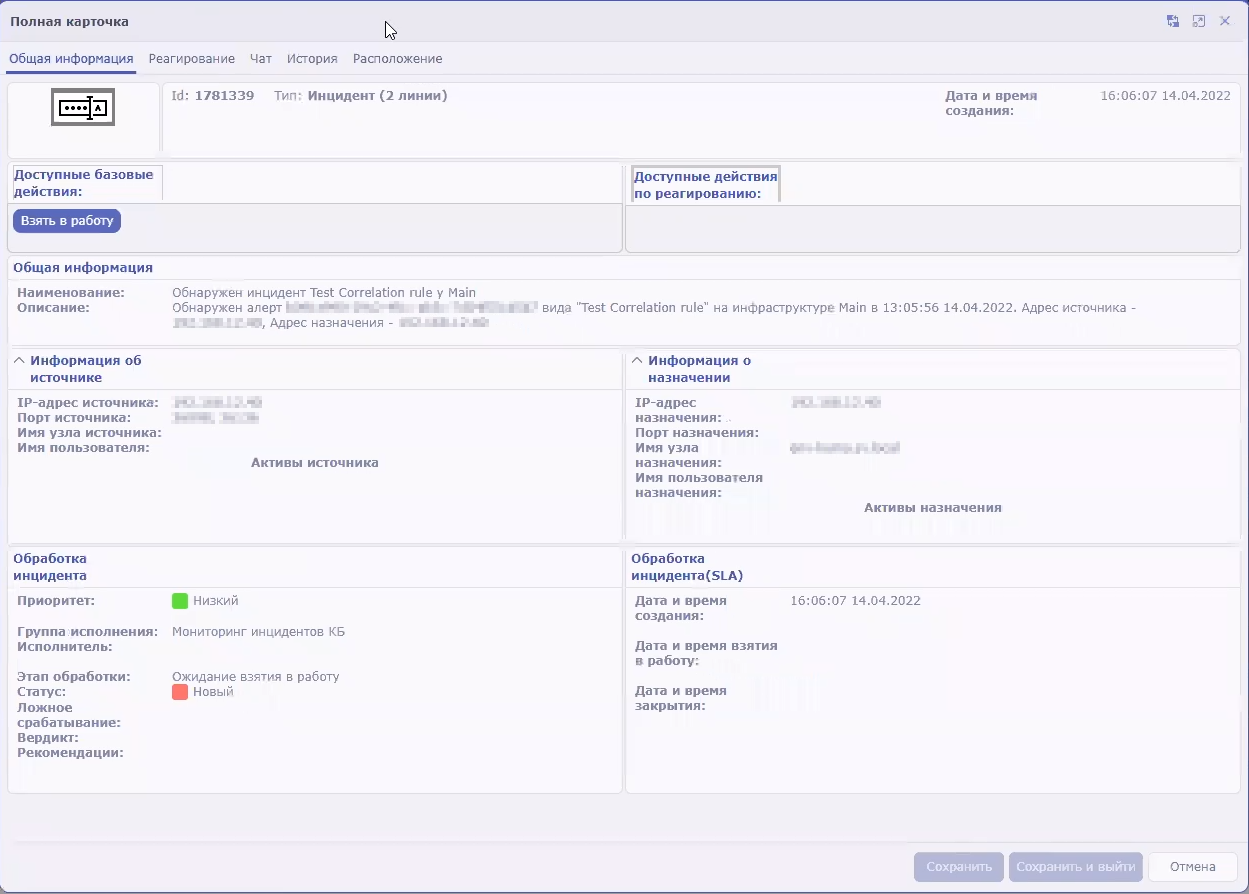
Security Vision IRP incident that was created based on KUMA alert
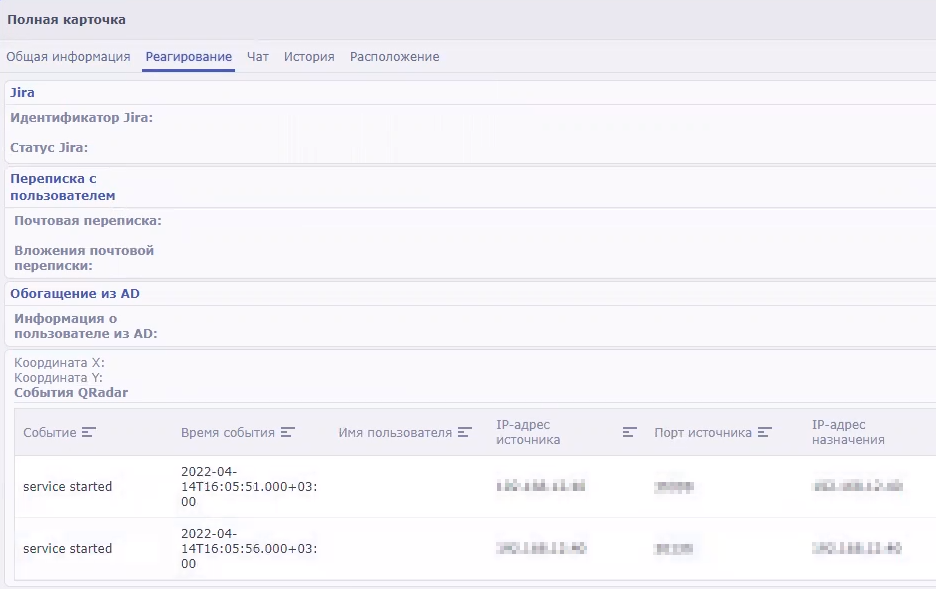
Events from KUMA alert that were imported to Security Vision IRP
Configuring integration in KUMA
To configure KUMA integration with Security Vision IRP, you must configure authorization of API requests in KUMA. To do so, you need to create a token for the KUMA user on whose behalf the API requests will be processed on KUMA side.
A token can be generated in your account profile: Users with the General Administrator role can generate tokens in the accounts of other users. You can always generate a new token.
To generate a token in your account profile:
- In the KUMA web interface, click the user account name in the lower-left corner of the window and click the Profile button in the opened menu.
The User window with your user account parameters opens.
- Click the Generate token button.
- Copy the generated token displayed in the opened window. This will be required to configure Security Vision IRP.
When the window is closed, the token is no longer displayed. If you did not copy the token before closing the window, you will have to generate a new token.
The generated token must be indicated in the Security Vision IRP connector settings.
Configuring integration in Security Vision IRP
Configuration of integration in Security Vision IRP consists of importing and configuring a connector. If necessary, you can also change other Security Vision IRP settings related to KUMA data processing, such as the data processing schedule and worker.
For more detailed information about configuring Security Vision IRP, please refer to the product documentation.
Importing and configuring a connector
Adding a connector in Security Vision IRP
Integration of Security Vision IRP and KUMA is carried out by using the Kaspersky KUMA connector. Contact your Security Vision IRP vendor to learn more about the methods and conditions for obtaining a Kaspersky KUMA connector.
To import a Kaspersky KUMA connector into Security Vision IRP:
- In Security Vision IRP, open Settings → Connectors → Connectors.
You will see a list of connectors that have been added to Security Vision IRP.
- At the top of the screen, click the import button and select the ZIP archive containing the Kaspersky KUMA connector.
The connector has been imported into Security Vision IRP and is ready to be configured.
Configuring a connector for a connection to KUMA
To use a connector, you need to configure its connection to KUMA.
To configure a connection to KUMA in Security Vision IRP using the Kaspersky KUMA connector:
- In Security Vision IRP, open Settings → Connectors → Connectors.
You will see a list of connectors that have been added to your Security Vision IRP.
- Select the Kaspersky KUMA connector.
The general settings of the connector will be displayed.
- Under Параметры коннектора (Connector settings), click the Редактировать (Edit) button.
The connector configuration will be displayed.
- In the URL field, specify the address and port of KUMA. For example,
kuma.example.com:7223. - In the Token field, specify KUMA user API token.
The connection to KUMA has been configured in the Security Vision IRP connector.
Security Vision IRP connector settings
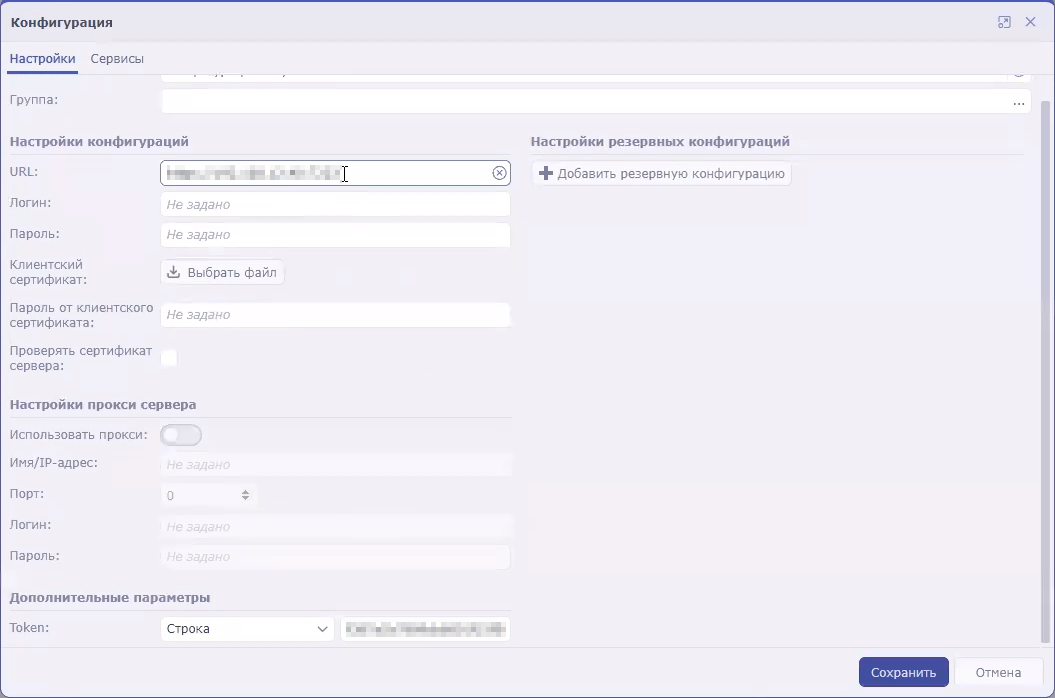
Configuring commands for interaction with KUMA in the Security Vision IRP connector
You can use Security Vision IRP to receive information about KUMA alerts (referred to as incidents in Security Vision IRP terminology) and send requests to close these alerts. To perform these actions, you need to configure the appropriate commands in the Security Vision IRP connector.
The instructions below describe how to add commands to receive and close alerts. However, if you need to implement more complex logic of interaction between Security Vision IRP and KUMA, you can similarly create your own commands containing other API requests.
To configure a command to receive alert information from KUMA:
- In Security Vision IRP, open Settings → Connectors → Connectors.
You will see a list of connectors that have been added to Security Vision IRP.
- Select the Kaspersky KUMA connector.
The general settings of the connector will be displayed.
- Click the +Команда (+Command) button.
The command creation window opens.
- Specify the command settings for receiving alerts:
- In the Наименование (Name) field, enter the command name:
Получение инцидентов (Receive incidents). - In the Тип запроса (Request type) drop-down list, select GET.
- In the Вызываемый метод (Called method) field, enter API request to search for alerts:
api/v1/alerts/?withEvents&status=new - Under Заголовки запроса (Request headers), in the Название (Name) field, indicate
authorization. In the Значение (Value) field, indicate Bearer <token>. - In the Тип контента (Content type) drop-down list, select application/json.
- In the Наименование (Name) field, enter the command name:
- Save the command and close the window.
The connector command is configured. When this command is executed, the Security Vision IRP connector will query KUMA for information about all alerts with the New status and all events related to those alerts. The received data will be relayed to the Security Vision IRP handler, which will create Security Vision IRP incidents based on this data. If an already imported alert is updated in KUMA with additional information, new data will be imported to Security Vision IRP incident.
To configure a command to close KUMA alerts:
- In Security Vision IRP, open Settings → Connectors → Connectors.
You will see a list of connectors that have been added to Security Vision IRP.
- Select the Kaspersky KUMA connector.
The general settings of the connector will be displayed.
- Click the +Команда (+Command) button.
The command creation window will be displayed.
- Specify the command settings for receiving alerts:
- In the Наименование (Name) field, enter the command name:
Закрытие инцидента (Close incident). - In the Тип запроса (Request type) drop-down list, select POST.
- In the Вызываемый метод (Called method) field, enter API request to close an alert:
api/v1/alerts/close - In the Запрос (Request) field, enter the contents of the API request to be sent:
{"id":"<Alert ID>","reason":"responded"}You can create multiple commands for different reasons to close alerts, such as responded, incorrect data, and incorrect correlation rule.
- Under Заголовки запроса (Request headers), in the Название (Name) field, indicate
authorization. In the Значение (Value) field, indicate Bearer <token>. - In the Тип контента (Content type) drop-down list, select application/json.
- In the Наименование (Name) field, enter the command name:
- Save the command and close the window.
The connector command is configured. When this command is executed, the incident will be closed in Security Vision IRP and the corresponding alert will be closed in KUMA.
Creating commands in Security Vision IRP
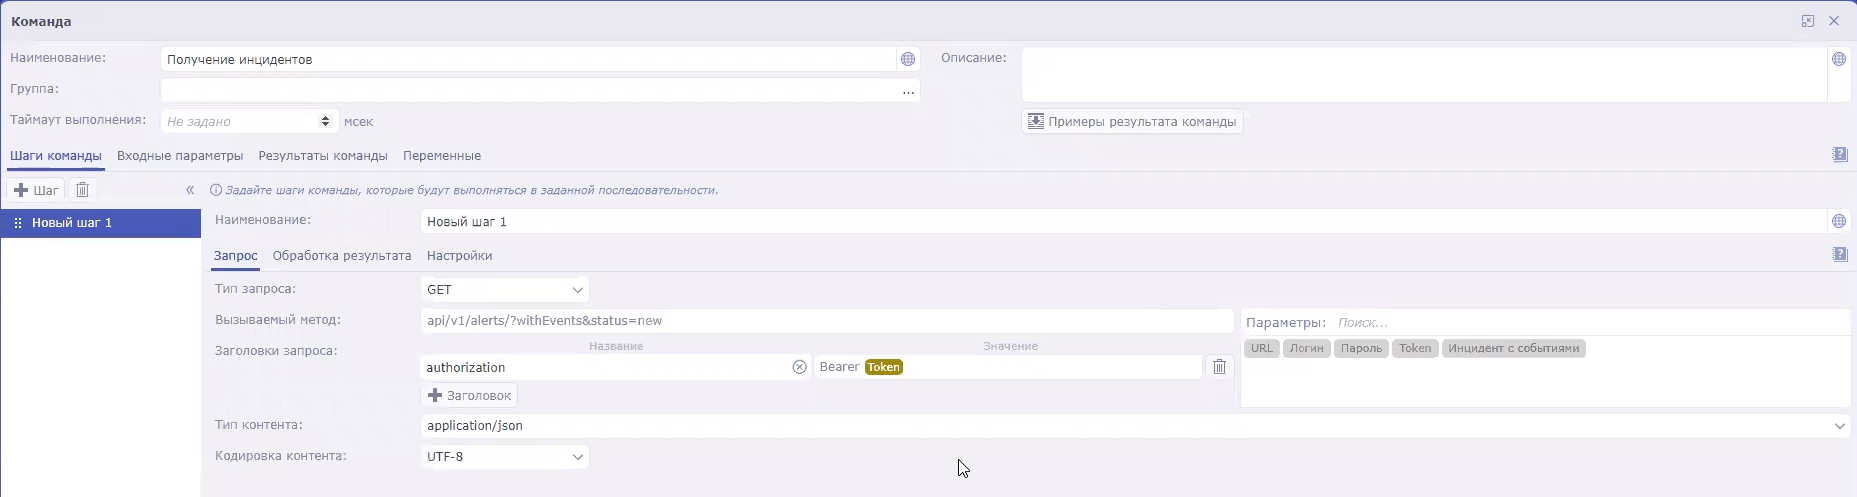
After configuring the connector, KUMA alerts will be sent to the platform as Security Vision IRP incidents. Then you need to configure incident handling in Security Vision IRP based on the security policies of your organization.
Page top
Configuring the handler, schedule, and worker process
Security Vision IRP handler
The Security Vision IRP handler receives KUMA alert data from the Security Vision IRP connector and creates Security Vision IRP incidents based on this data. A predefined KUMA (Инциденты) (KUMA (Incidents)) handler is used for processing data. The settings of the KUMA (Инциденты) (KUMA (Incidents)) handler are available in Security Vision IRP under Настройки (Settings) → Обработка событий (Event processing) → Обработчики событий (Event handlers):
- The rules for processing KUMA alerts can be viewed in the handler settings on the Нормализация (Normalization) tab.
- The available actions when creating new objects can be viewed in the handler settings on the Действия (Actions) tab for creating objects of the Инцидент (2 линии) (Incident (2 line)) type.
Handler run schedule
The connector and handler are started according to a predefined KUMA schedule. This schedule can be configured in Security Vision IRP under Настройки (Settings) → Обработка событий (Event processing) → Расписание (Schedule):
- In the Настройки коннектора (Connector settings) block, you can configure the settings for starting the connector.
- In the Настройки обработки (Handler settings) block, you can configure the settings for starting the handler.
Security Vision IRP worker process
The life cycle of Security Vision IRP incidents created based on KUMA alerts follows the preconfigured Incident processing (2 lines) worker. The worker can be configured in Security Vision IRP under Settings → Workers → Worker templates: select the Incident processing (2 lines) worker and click the transaction or state that you need to change.
Page top
KUMA resources
Resources are KUMA components that contain parameters for implementing various functions: for example, establishing a connection with a given web address or converting data according to certain rules. These components, like parts of a constructor set, are assembled into resource sets for services, based on which, in turn, KUMA services are created.
Resources are contained in the Resources section, Resources block of KUMA web interface. The following resource types are available:
- Correlation rules—resources of this type contain rules for identifying event patterns that indicate threats. If the conditions specified in these resources are met, a correlation event is generated.
- Normalizers—resources of this type contain rules for converting incoming events into the format used by KUMA. After processing in the normalizer, the "raw" event is normalized and can be processed by other KUMA resources and services.
- Connectors—resources of this type contain settings for establishing network connections.
- Aggregation rules—resources of this type contain rules for combining several base events of the same type into one aggregation event.
- Enrichment rules—resources of this type contain rules for supplementing events with information from third-party sources.
- Destinations—resources of this type contain settings for forwarding events to a destination for further processing or storage.
- Filters—resources of this type contain conditions for rejecting or selecting individual events from the stream of events.
- Response—resources of this type are used in correlators to run scripts or start Kaspersky Security Center tasks when certain conditions are met.
- Active lists—resources of this type are used by correlators for dynamic data processing when analyzing events according to correlation rules.
- Dictionaries—resources of this type are used to store keys and their values that may be required by other KUMA resources and services.
- Proxies—resources of this type contain settings for using proxy servers.
- Secrets—resources of this type are used to securely store confidential information (such as account credentials) that KUMA needs for interaction with external services.
When you click on a resource type, a window opens displaying a table with the available resources of this type. The resource table contains the following columns:
- Name—the name of a resource. Can be used to search for resources and sort them.
- Time updated—the date and time of the last update of a resource. Can be used to sort resources.
- Created by—the name of the user who created a resource.
- Description—the description of a resource.
Resources can be organized into folders. On the left side of each window, the folder structure is displayed, where the number and names of the root folders correspond to the tenants created in KUMA. When a folder is selected, the resources it contains are displayed as a table in the right pane of the window.
Resources can be created, edited, copied, moved from one folder to another, and deleted. Resources can also be exported and imported.
Resources tools
This section contains information on tools that are available in KUMA to organize resources and work with them.
Working with resources folders
You can create, rename, move and delete folders.
To create a folder:
- Select the folder in the tree where the new folder is required.
- Click the Add folder button.
The folder will be created.
To rename a folder:
- Locate required folder in the folder structure.
- Hover over the name of the folder.
The
 icon will appear near the name of the folder.
 - Open the drop-down list and select Rename.
The folder name will become active for editing.
- Enter the new folder name and press ENTER.
The folder name cannot be empty.
The folder will be renamed.
To move a folder,
Drag and drop the folder to a required place in folder structure by clicking its name.
Folders cannot be dragged from one tenant to another.
To delete a folder:
- Locate required folder in the folder structure.
- Hover over the name of the folder.
The
icon will appear near the name of the folder. - Open the drop-down list and select Delete.
The conformation window appears.
- Click OK.
The folder will be deleted.
The program does not delete folders that contain files or subfolders.
Page top
Working with resources
You can create, move, copy, edit, and delete resources.
To create the resource:
- In the Resources → <resource type> section, select or create a folder where you want to add the new resource.
Root folders correspond to tenants. For a resource to be available to a specific tenant, it must be created in the folder of that tenant.
- Click the Add <resource type> button.
The window for configuring the selected resource type opens. The available configuration parameters depend on the resource type.
- Enter a unique resource name in the Name field.
- Specify the required parameters (marked with a red asterisk).
- If necessary, specify the optional parameters (not required).
- Click Save.
The resource has been created and is available for use in services and other resources.
To move the resource to a new folder:
- In the Resources → <resource type> section, find the required resource in the folder structure.
- Select the check box near the resource you want to move. You can select multiple resources.
The
 icon appears near the selected resources.
 - Use the icon to drag and drop resources to the required folder.
Resources are located in new folders. Resources cannot be dragged between folders of different tenants.
To copy the resource:
- In the Resources → <resource type> section, find the required resource in the folder structure.
- Select the check box next to the resource that you want to copy and click Duplicate.
A window opens with the settings of the resource that you have selected for copying. The available configuration parameters depend on the resource type.
The
<selected resource name> - copyvalue is displayed in the Name field. - Make the necessary changes to the parameters.
- Enter a unique name in the Name field.
- Click Save.
The copy of the resource is created.
To edit the resource:
- In the Resources → <resource type> section, find the required resource in the folder structure.
- Select the resource.
A window with the settings of the selected resource opens. The available configuration parameters depend on the resource type.
- Make the necessary changes to the parameters.
- Click Save.
The resource will be updated. If this resource is used in a service, restart the service to apply the new settings.
To delete the resource:
- In the Resources → <resource type> section, find the required resource in the folder structure.
- Select the check box next to the resource that you want to delete and click Delete.
A confirmation window opens.
- Click OK.
The resource has been deleted.
Page top
Exporting and importing resources
You can export and import resources.
To export resources:
- In the Resources section → <resource type> click the icon
 .
. - In the drop-down list, select Export resources.
The Export resources window opens with the tree of all available resources.
- In the Password field enter the password that must be used to protect exported data.
- In the Tenant drop-down list, select the tenant whose resources you want to export.
- Check boxes near the resources you want to export.
If selected resources are linked to other resources, linked resources will be exported, too.
- Click the Export button.
The resources in a password-protected file are saved on your computer using your browser settings. The Secret resources are exported blank.
To import resources:
- Open the drop-down list and select Import resources.
The Resource import window opens.
- In the Password field enter the password for the file you want to import.
- In the Tenant drop-down list, select the tenant that will own the imported resources.
- Click the Select file button and locate the file with the resources you want to import.
In the Resource import window the tree of all available resources in the selected file is displayed.
- Select resources you want to import.
- Click the Import button.
- Resolve conflicts (see below) between imported and existing resources if they appear. Read more about resource conflicts below.
- If the name of any of the imported resource matches the name of the already existing resource, the Conflicts window opens with the table where the kind and the name of conflicting resources are displayed. Resolve displayed conflicts:
- If you want to replace the existing resource with a new one, click Replace.
Click Replace all to replace all existing conflicting resources.
- If you want to leave the existing resource, click Skip.
Click Skip all to keep all existing resources.
- If you want to replace the existing resource with a new one, click Replace.
- Click the Resolve button.
- If the name of any of the imported resource matches the name of the already existing resource, the Conflicts window opens with the table where the kind and the name of conflicting resources are displayed. Resolve displayed conflicts:
The resources are imported to KUMA. The Secret resources are imported blank.
About conflict resolving
When resources are imported to KUMA, the program compares them with the existing resources, checking their name, kind, and guid (or identifier) parameters:
- If an imported resource's name and kind parameters match those of the existing one, the imported resource's name is automatically changed.
- If identifiers of two resources match, a conflict appears that must be resolved by the user. This could happen when you import resources to the same KUMA server from which they were exported.
When resolving a conflict you can choose either to replace existing resource with the imported one or to keep exiting resource, skipping the imported one.
Some resources are linked (for example, the Connector resource requires the Connection resource); such resources are exported and imported together. If during the import a conflict occurs and you choose to replace existing resource with a new one, it would mean that all the other resources linked to the one being replaced are going to be automatically replaced with the imported resources, even if you chose to Skip any of them.
During import, all resources are imported into one tenant even if they belonged to different tenants during export (for example, if an associated resource was in a shared tenant).
Page top
Connectors
Connector resources are used to establish connections between KUMA services, network assets, and/or other services. The settings of connectors are displayed on two tabs: Basic settings and Advanced settings. The available settings depend on the selected type of connector:
For these resources, you can enable the display of control characters in all input fields except the Description field.
If you change the kind of connector from wec to wmi in an already created collector, there may be errors receiving events. If you want to make this type of change to the connector kind, you must create a new WMI connector with the necessary settings and connect it to the collector instead of the WEC connector.
Internal type
The internal type is used for establishing connections between the KUMA services.
Available settings:
- Basic settings tab:
- Name (required)—a unique name for this type of resource. Must contain from 1 to 128 Unicode characters.
- Tenant (required)—name of the tenant that owns the resource.
- Type (required)—connector type.
- URL (required)—URL that you need to connect to. Available formats: hostname:port, IPv4:port, IPv6:port, :port.
- Description—up to 256 Unicode characters describing the resource.
- Advanced settings tab:
- Proxy—a drop-down list where you can select a proxy server resource.
- Debug—a drop-down list where you can specify whether resource logging should be enabled. By default it is Disabled.
Tcp type
The tcp type is used for TCP communications It is available for Windows and Linux Agents.
Available settings:
- Basic settings tab:
- Name (required)—a unique name for this type of resource. Must contain from 1 to 128 Unicode characters.
- Tenant (required)—name of the tenant that owns the resource.
- Type (required)—connector type.
- URL (required)—URL that you need to connect to. Available formats: hostname:port, IPv4:port, IPv6:port, :port.
- Delimiter is used to specify a character representing the delimiter between events. By default,
\nis used. - Description—up to 256 Unicode characters describing the resource.
- Advanced settings tab:
- Buffer size is used to set a buffer size for the connector. The default value is 1 MB, and the maximum value is 64 MB.
- Character encoding setting specifies character encoding. The default value is
UTF-8. - TLS mode specifies whether TLS encryption is used:
- Disabled (default)—do not use TLS encryption.
- Enabled—encryption is enabled, but without verification.
- With verification—use encryption with verification that the certificate was signed with the KUMA root certificate. The root certificate and key of KUMA are created automatically during program installation and are stored on the KUMA Core server in the folder /opt/kaspersky/kuma/core/certificates/.
When using TLS, it is impossible to specify an IP address as a URL.
- Compression—you can use Snappy compression. By default, compression is disabled.
- Debug—a drop-down list where you can specify whether resource logging should be enabled. By default it is Disabled.
Udp type
The udp type is used for UDP communications. It is available for Windows and Linux Agents.
Available settings:
- Basic settings tab:
- Name (required)—a unique name for this type of resource. Must contain from 1 to 128 Unicode characters.
- Tenant (required)—name of the tenant that owns the resource.
- Type (required)—connector type.
- URL (required)—URL that you need to connect to. Available formats: hostname:port, IPv4:port, IPv6:port, :port.
- Delimiter is used to specify a character representing the delimiter between events. By default,
\nis used. - Description—up to 256 Unicode characters describing the resource.
- Advanced settings tab:
- Buffer size is used to set a buffer size for the connector. The default value is 16 KB, and the maximum value is 64 KB.
- Workers—used to set worker count for the connector. The default value is 1.
- Character encoding setting specifies character encoding. The default value is
UTF-8. - Compression—you can use Snappy compression. By default, compression is disabled.
- Debug—a drop-down list where you can specify whether resource logging should be enabled. By default it is Disabled.
Netflow type
The netflow is used for establishing NetFlow connections.
Available settings:
- Basic settings tab:
- Name (required)—a unique name for this type of resource. Must contain from 1 to 128 Unicode characters.
- Tenant (required)—name of the tenant that owns the resource.
- Type (required)—connector type.
- URL (required)—URL that you need to connect to.
- Description—up to 256 Unicode characters describing the resource.
- Advanced settings tab:
- Buffer size is used to set a buffer size for the connector. The default value is 16 KB, and the maximum value is 64 KB.
- Workers—used to set worker count for the connector. The default value is 1.
- Character encoding setting specifies character encoding. The default value is
UTF-8. - Debug—a drop-down list where you can specify whether resource logging should be enabled. By default it is Disabled.
Nats type
The nats type is used for NATS communications It is available for Windows and Linux Agents.
Available settings:
- Basic settings tab:
- Name (required)—a unique name for this type of resource. Must contain from 1 to 128 Unicode characters.
- Tenant (required)—name of the tenant that owns the resource.
- Type (required)—connector type.
- URL (required)—URL that you need to connect to.
- Topic (required)—the topic for NATS messages. Must contain from 1 to 255 Unicode characters.
- Delimiter is used to specify a character representing the delimiter between events. By default,
\nis used. - Description—up to 256 Unicode characters describing the resource.
- Advanced settings tab:
- Buffer size is used to set a buffer size for the connector. The default value is 16 KB, and the maximum value is 64 KB.
- GroupID—the GroupID parameter for NATS messages. Must contain from 1 to 255 Unicode characters. The default value is
io.nats. - Workers—used to set worker count for the connector. The default value is 1.
- Character encoding setting specifies character encoding. The default value is
UTF-8. - Storage ID is a NATS storage identifier.
- TLS mode specifies whether TLS encryption is used:
- Disabled (default)—do not use TLS encryption.
- Enabled—use encryption without certificate verification.
- With verification—use encryption with verification that the certificate was signed with the KUMA root certificate. The root certificate and key of KUMA are created automatically during program installation and are stored on the KUMA Core server in the folder /opt/kaspersky/kuma/core/certificates/.
- Custom CA—use encryption with verification that the certificate was signed by a Certificate Authority. The secret containing the certificate is selected from the Custom CA drop-down list, which is displayed when this option is selected.
When using TLS, it is impossible to specify an IP address as a URL.
- Compression—you can use Snappy compression. By default, compression is disabled.
- Debug—a drop-down list where you can specify whether resource logging should be enabled. By default it is Disabled.
Kafka type
The kafka type is used for Kafka communications It is available for Windows and Linux Agents.
Available settings:
- Basic settings tab:
- Name (required)—a unique name for this type of resource. Must contain from 1 to 128 Unicode characters.
- Tenant (required)—name of the tenant that owns the resource.
- Type (required)—connector type.
- URL—URL that you need to connect to. Available formats: hostname:port, IPv4:port, IPv6:port.
- Topic—subject of Kafka messages. Must contain from 1 to 255 of the following characters: a–z, A–Z, 0–9, ".", "_", "-".
- Authorization—requirement for Agents to complete authorization when connecting to the connector:
- disabled (by default).
- PFX.
When this option is selected, a certificate must be generated with a private key in PKCS#12 container format in an external Certificate Authority. Then the certificate must be exported from the key store and uploaded to the KUMA web interface as a PFX secret.
- If you previously uploaded a PFX certificate, select it from the Secret drop-down list.
If no certificate was previously added, the drop-down list shows No data.
- If you want to add a new certificate, click the button on the right of the Secret list.
The Secret window opens.
- In the Name field, enter the name that will be used to display the secret in the list of available secrets.
- Click the Upload PFX button to select the file containing your previously exported certificate with a private key in PKCS#12 container format.
- In the Password field, enter the certificate security password that was set in the Certificate Export Wizard.
- Click the Save button.
The certificate will be added and displayed in the Secret list.
- If you previously uploaded a PFX certificate, select it from the Secret drop-down list.
- plain.
If this option is selected, you must indicate the secret containing user account credentials for authorization when connecting to the connector.
- If you previously created a secret, select it from the Secret drop-down list.
If no secret was previously added, the drop-down list shows No data.
- If you want to add a new secret, click the button on the right of the Secret list.
The Secret window opens.
- In the Name field, enter the name that will be used to display the secret in the list of available secrets.
- In the User and Password fields, enter the credentials of the user account that the Agent will use to connect to the connector.
- If necessary, add any other information about the secret in the Description field.
- Click the Save button.
The secret will be added and displayed in the Secret list.
- If you previously created a secret, select it from the Secret drop-down list.
- GroupID—the GroupID parameter for Kafka messages. Must contain from 1 to 255 of the following characters: a–z, A–Z, 0–9, ".", "_", "-".
- Description—up to 256 Unicode characters describing the resource.
- Advanced settings tab:
- Delimiter is used to specify a character representing the delimiter between events. By default,
\nis used. - Character encoding setting specifies character encoding. The default value is
UTF-8. - TLS mode specifies whether TLS encryption is used:
- Disabled (default)—do not use TLS encryption.
- Enabled—use encryption without certificate verification.
- With verification—use encryption with verification that the certificate was signed with the KUMA root certificate. The root certificate and key of KUMA are created automatically during program installation and are stored on the KUMA Core server in the folder /opt/kaspersky/kuma/core/certificates/.
- Custom CA—use encryption with verification that the certificate was signed by a Certificate Authority. The secret containing the certificate is selected from the Custom CA drop-down list, which is displayed when this option is selected.
When using TLS, it is impossible to specify an IP address as a URL.
- Debug—a drop-down list where you can specify whether resource logging should be enabled. By default it is Disabled.
- Delimiter is used to specify a character representing the delimiter between events. By default,
Http type
The http type is used for HTTP communications It is available for Windows and Linux Agents.
Available settings:
- Basic settings tab:
- Name (required)—a unique name for this type of resource. Must contain from 1 to 128 Unicode characters.
- Tenant (required)—name of the tenant that owns the resource.
- Type (required)—connector type.
- URL (required)—URL that you need to connect to. Available formats: hostname:port, IPv4:port, IPv6:port, :port.
- Delimiter is used to specify a character representing the delimiter between events. By default,
\nis used. - Description—up to 256 Unicode characters describing the resource.
- Advanced settings tab:
- Character encoding setting specifies character encoding. The default value is
UTF-8. - TLS mode specifies whether TLS encryption is used:
- Disabled (default)—do not use TLS encryption.
- Enabled—encryption is enabled, but without verification.
- With verification—use encryption with verification that the certificate was signed with the KUMA root certificate. The root certificate and key of KUMA are created automatically during program installation and are stored on the KUMA Core server in the folder /opt/kaspersky/kuma/core/certificates/.
When using TLS, it is impossible to specify an IP address as a URL.
- Proxy—a drop-down list where you can select a proxy server resource.
- Debug—a drop-down list where you can specify whether resource logging should be enabled. By default it is Disabled.
- Character encoding setting specifies character encoding. The default value is
Sql type
The sql is used for SQL communications. Connector settings are divided into three blocks:
- General connector settings.
- Settings of a specific SQL connection. One connector may have more than one of these connections.
- Advanced settings of a connector.
General connector settings
General connector settings are located on the Main settings tab:
- Name (required)—a unique name for this type of resource. Must contain from 1 to 128 Unicode characters.
- Tenant (required)—name of the tenant that owns the resource.
- Type (required)—connector type.
- Default query (required)—field for an SQL query that is common to all connections of the connector.
- Poll interval, sec - time between SQL queries in seconds. The default value is 10 seconds.
- Description—up to 256 Unicode characters describing the resource.
If an individual connection (see below) has its own defined query and/or query interval, this connection will use the values specifically defined for its own query and/or query interval.
Settings of a specific SQL connection
General connector settings are located on the Main settings tab. You can create multiple connections in one connector by using the Add connection button to add new ones. You can delete connections by using the ![]() button.
button.
Connection settings:
- URL (required)—drop-down list for selecting the secret resource that stores a list of query strings for SQL connections. The string format depends on the specific database (see the supported SQL types below).
When creating connections, strings containing account credentials with special characters may be incorrectly processed. If a connection is not being created even though you are sure that your settings are correct, enter the special characters in percent encoding.
Available formats for server addresses: hostname:port, IPv4:port, IPv6:port.
If required, a secret can be created in the connector creation window using the
button. The selected secret can be changed by clicking on the button. - Identity column (required)—name of the column that will serve as the identity column.
- Identity seed (required)—identity column value that will be used to determine the specific line to start reading data from the SQL table.
- Query—field for SQL queries. If a query is indicated for a specific connection in a connector, this query will be used instead of the query specified in the Default query field.
- Poll interval, sec - time between SQL queries in seconds. Dafault value – 10 seconds. If a query interval is indicated for a specific connection in a connector, this interval will be used instead of the connector's general query interval.
One SQL connection is defined by using the URL, Identity column, and Identity seed parameters. The last line where data was read from the SQL table is saved in the KUMA collector that generated the query sent to the SQL database. This allows the program to start from the last read line when reading data from the SQL table. The ID of the last read line does not change when a different URL or query is indicated in the connector. To change the starting line where data acquisition from the SQL table will begin, you must change the value of the Identity seed and/or Identity column fields.
Advanced settings of a connector
Additional connector settings are located on the Advanced settings tab:
- Character encoding setting specifies character encoding. The default value is
UTF-8.KUMA can process SQL responses in UTF-8 character encoding. Either ensure that the SQL server sends messages in UTF-8 or use the Character encoding drop-down list in the Connector settings to convert incoming messages to UTF-8.
- Debug—a drop-down list where you can specify whether resource logging should be enabled. By default it is Disabled.
Supported SQL types and their specific usage features
The UNION operator is not supported by the SQL Connector resources.
The following SQL types are supported:
- MSSQL
Example URLs:
sqlserver://{user}:{password}@{server:port}/{instance_name}?database={database}– (recommended option)sqlserver://{user}:{password}@{server}?database={database}
The characters
@p1are used as a placeholder in the SQL query.If you need to connect using domain account credentials, specify the account name in
<domain>%5C<user>format. For example:sqlserver://domain%5Cuser:password@ksc.example.com:1433/SQLEXPRESS?database=KAV. - MySQL
Example URL:
mysql://{user}:{password}@tcp({server}:{port})/{database}The character
?is used as a placeholder in the SQL query. - PostgreSQL
Example URL:
postgres://{user}:{password}@{server}/{database}?sslmode=disableThe characters
$1are used as a placeholder in the SQL query. - CockroachDB
Example URL:
postgres://{user}:{password}@{server}:{port}/{database}?sslmode=disableThe characters
$1are used as a placeholder in the SQL query. - SQLite3
Example URL:
sqlite3://file:{file_path}A question mark (
?) is used as a placeholder in the SQL query. - Oracle DB
Example URL:
oracle://{user}/{password}@{server}:{port}/{service_name}Easy Connect syntax is used. The characters
:valare used as a placeholder in the SQL query.When querying the Oracle DB, if the initial value of the ID is in datetime format, the Oracle
to_timestamp_tzfunction should be used to add the date conversion to the SQL query. For example,select * from connections where login_time > to_timestamp_tz(:val, 'YYYY-MM-DD"T"HH24:MI:SSTZH:TZM'). In this example,Connectionsis the Oracle DB table and the:valvariable is taken from the Identity seed field, therefore it must be indicated in a format with the timezone (for example,2021-01-01T00:10:00+03:00).To access the Oracle DB, the libaio1 package must be installed.
- Firebird SQL
Example URL:
firebirdsql://{user}:{password}@{server}:{port}/{database}A question mark (
?) is used as a placeholder in the SQL query.
A sequential request for database information is supported in SQL queries. For example, if you type select * from <name of data table> where id > <placeholder> in the Query field, the Identity seed field value will be used as the placeholder value the first time you query the table. In addition, the service that utilizes the SQL connector saves the ID of the last read entry, and the ID of this entry will be used as the placeholder value in the next query to the database.
File type
The file type is used to retrieve data from any text file. One string in a file is considered to be one event. Strings delimiter: \n. This type of connector is available for Linux Agents.
Available settings:
- Basic settings tab:
- Name (required)—a unique name for this type of resource. Must contain from 1 to 128 Unicode characters.
- Tenant (required)—name of the tenant that owns the resource.
- Type (required)—connector type.
- URL (required)—full path to the file that you need to interact with. For example,
/var/log/*som?[1-9].log. - Description—up to 256 Unicode characters describing the resource.
- Advanced settings tab:
- Character encoding setting specifies character encoding. The default value is
UTF-8. - Debug—a drop-down list where you can specify whether resource logging should be enabled. By default it is Disabled.
- Character encoding setting specifies character encoding. The default value is
Ftp type
The ftp type is used to receive data using the File Transfer Protocol. It is available for Windows and Linux Agents.
Available settings:
- Basic settings tab:
- Name (required)—a unique name for this type of resource. Must contain from 1 to 128 Unicode characters.
- Tenant (required)—name of the tenant that owns the resource.
- Type (required)—connector type.
- URL (required)—actual URL of the file or file mask beginning with 'ftp://'. For a file mask, you can use * ? [...].
If the URL does not include the FTP server port, port 21 is inserted.
- Description—up to 256 Unicode characters describing the resource.
- Advanced settings tab:
- Character encoding setting specifies character encoding. The default value is
UTF-8. - Compression—you can use Snappy compression. By default, compression is disabled.
- Debug—a drop-down list where you can specify whether resource logging should be enabled. By default it is Disabled.
- Character encoding setting specifies character encoding. The default value is
Nfs type
The nfs type is used to receive data using the Network File System protocol. It is available for Windows and Linux Agents.
Available settings:
- Basic settings tab:
- Name (required)—a unique name for this type of resource. Must contain from 1 to 128 Unicode characters.
- Tenant (required)—name of the tenant that owns the resource.
- Type (required)—connector type.
- URL (required)—path to the remote folder in the format nfs://host/path.
- Query (required)—a mask used to filter files containing events. Use of masks is acceptable "
*","?","[...]". - Poll interval, sec—polling interval. The time interval after which files are re-read from the remote system. The value is specified in seconds. The default value is 0.
- Description—up to 256 Unicode characters describing the resource.
- Advanced settings tab:
- Character encoding setting specifies character encoding. The default value is
UTF-8. - Compression—you can use Snappy compression. By default, compression is disabled.
- Debug—a drop-down list where you can specify whether resource logging should be enabled. By default it is Disabled.
- Character encoding setting specifies character encoding. The default value is
Wmi type
The wmi type is used to obtain data using Windows Management Instrumentation. It is available for Windows Agents.
Available settings:
- Basic settings tab:
- Name (required)—a unique name for this type of resource. Must contain from 1 to 128 Unicode characters.
- Tenant (required)—name of the tenant that owns the resource.
- Type (required)—connector type.
- URL (required)—URL of the collector being created, for example:
kuma-collector.example.com:7221.The creation of a collector for receiving data using Windows Management Instrumentation results in the automatic creation of an agent that will receive the necessary data on the remote machine and forward that data to the collector service. In the URL, you must specify the address of this collector. The URL is known in advance if you already know on which server you plan to install the service. However, this field can also be filled after the Installation Wizard is finished by copying the URL data from the Resources → Active services section.
- Description—up to 256 Unicode characters describing the resource.
- Default credentials—drop-down list that does not require any value to be selected. The account credentials used to connect to hosts must be provided in the Remote hosts table (see below).
Selecting a secret from the Default credentials drop-down list will cause the connector to work incorrectly.
- The Remote hosts table lists the remote Windows assets that you can connect to. Available columns:
- Host (required) is the IP address or domain name of the asset from which you want to receive data. For example, "machine-1.example.com".
- Domain (required)—name of the domain in which the remote device resides. For example, "example.com"
- Log type—drop-down list to select the name of the Windows logs that you need to retrieve. By default, only preconfigured logs are displayed in the list, but you can add custom logs to the list by typing their name in the Windows logs field and then pressing ENTER. KUMA service and resource configurations may require additional changes in order to process custom logs correctly.
Logs that are available by default:
- Application
- ForwardedEvents
- Security
- System
- HardwareEvents
- Secret—account credentials for accessing a remote Windows asset with permissions to read the logs. The login in the secret resource must be specified without the domain. The domain value for accessing the host is taken from the Domain column of the Remote hosts table.
You can select the secret resource from the drop-down list or create one using the
button. The selected secret can be changed by clicking on the button.
- Advanced settings tab:
- Character encoding setting specifies character encoding. The default value is
UTF-8. - Compression—you can use Snappy compression. By default, compression is disabled.
- Debug—a drop-down list where you can specify whether resource logging should be enabled. By default it is Disabled.
- Character encoding setting specifies character encoding. The default value is
Receiving events from a remote machine
Conditions for receiving events from a remote Windows machine hosting a KUMA agent:
- To start the KUMA agent on the remote machine, you must use an account with the Log on as a service permissions.
- To receive events from the KUMA agent, you must use an account with Event Log Readers permissions. For domain servers, one such user account can be created so that a group policy can be used to distribute its rights to read logs to all servers and workstations in the domain.
- TCP ports 135, 445, and 49152-65535 must be opened on the remote Windows machines.
- You need to launch the following services on the remote machines:
- Remote Procedure Call (RPC)
- RPC Endpoint Mapper
Wec type
The wec type is used to receive data using the Windows Event Collector. It is available for Windows Agents.
To start the KUMA agent on the remote machine, you must use an account with the Log on as a service permissions.
To receive events, you must use an account with Event Log Readers permissions. For domain servers, one such user account can be created so that a group policy can be used to distribute its rights to read logs to all servers and workstations in the domain.
Available settings:
- Basic settings tab:
- Name (required)—a unique name for this type of resource. Must contain from 1 to 128 Unicode characters.
- Tenant (required)—name of the tenant that owns the resource.
- Type (required)—connector type.
- URL (required)—URL of the collector being created, for example:
kuma-collector.example.com:7221.The creation of a collector for receiving data using Windows Event Collector results in the automatic creation of an agent that will receive the necessary data on the remote machine and forward that data to the collector service. In the URL, you must specify the address of this collector. The URL is known in advance if you already know on which server you plan to install the service. However, this field can also be filled after the Installation Wizard is finished by copying the URL data from the Resources → Active services section.
- Description—up to 256 Unicode characters describing the resource.
- Windows logs (required)—Select the names of the Windows logs you want to retrieve from this drop-down list. By default, only preconfigured logs are displayed in the list, but you can add custom logs to the list by typing their name in the Windows logs field and then pressing ENTER. KUMA service and resource configurations may require additional changes in order to process custom logs correctly.
Preconfigured logs:
- Application
- ForwardedEvents
- Security
- System
- HardwareEvents
- Advanced settings tab:
- Character encoding setting specifies character encoding. The default value is
UTF-8. - Compression—you can use Snappy compression. By default, compression is disabled.
- Debug—a drop-down list where you can specify whether resource logging should be enabled. By default it is Disabled.
- Character encoding setting specifies character encoding. The default value is
Snmp type
The snmp type is used to receive data using the Simple Network Management Protocol. It is available for Windows and Linux Agents. Supported protocol versions:
- snmpV1
- snmpV2
- snmpV3
Available settings:
- Basic settings tab:
- Name (required)—a unique name for this type of resource. Must contain from 1 to 128 Unicode characters.
- Tenant (required)—name of the tenant that owns the resource.
- Type (required)—connector type.
- SNMP version (required)—This drop-down list allows you to select the version of the protocol to use.
- Host (required)—hostname or its IP address. Available formats: hostname, IPv4, IPv6.
- Port (required)—port for connecting to the host. Typically 161 or 162 are used.
The SNMP version, Host and Port settings define one connection to a SNMP resource. You can create several such connections in one connector by adding new ones using the SNMP resource button. You can delete connections by using the
button.- Secret (required) is a drop-down list to select the secret resource which stores the credentials for connecting via the Simple Network Management Protocol. The secret type must match the SNMP version. If required, a secret can be created in the connector creation window using the button. The selected secret can be changed by clicking on the button.
- In the Source data table you can specify the rules for naming the received data, according to which OIDs, object identifiers, will be converted into keys with which the normalizer can interact. Available table columns:
- Parameter name (required)—an arbitrary name for the data type. For example, "Site name" or "Site uptime".
- OID (required)—a unique identifier that determines where to look for the required data at the event source. For example, "1.3.6.1.2.1.1.5".
- Key (required)—a unique identifier returned in response to a request to the asset with the value of the requested setting. For example, "sysName". This key can be accessed when normalizing data.
- Description—up to 256 Unicode characters describing the resource.
- Advanced settings tab:
- Character encoding setting specifies character encoding. The default value is
UTF-8. - Compression—you can use Snappy compression. By default, compression is disabled.
- Debug—a drop-down list where you can specify whether resource logging should be enabled. By default it is Disabled.
- Character encoding setting specifies character encoding. The default value is
Normalizers
Normalizer resources are used to convert raw events of various formats so that they conform to the KUMA event data model. This turns them into normalized events that can be processed by other KUMA resources and services.
A normalizer resource consists of the main normalizer and optional extra normalizers. Data is transmitted through a tree-like structure of normalizers depending on the defined conditions, which lets you configure complex logic for processing events.
A normalizer resource is created in several steps:
- Creating the main normalizer
The main normalizer is created by using the Add event parsing button. Entry of normalizer settings is finished by clicking OK.
The main normalizer that you created will be displayed as a dark circle. Clicking on the circle will open the normalizer options for editing. When you hover over the circle, a plus sign is displayed. Click it to add more normalizers.
- Creating conditions for using an extra normalizer
Clicking on the normalizer plus sign opens the Add normalizer to normalization scheme window in which you can specify the conditions that will cause data to be forwarded to the new normalizer.
- Creating an extra normalizer
When the previous step is finished, a window will open for creating an extra normalizer. Entry of normalizer settings is finished by clicking OK.
The extra normalizer you created is displayed as a dark block that indicates the conditions under which this normalizer will be used (see step 2). The conditions can be changed by moving your mouse cursor over the extra normalizer and clicking the button showing the pencil image.
If you hover the mouse pointer over the extra normalizer, a plus button appears, which you can use to create a new extra normalizer. To delete a normalizer, use the button with the trash icon.
If you need to create more normalizers, repeat steps 2 and 3.
- Completing creation of a normalizer resource
Normalizer resource creation is finished by clicking the Save button.
For these resources, you can enable the display of control characters in all input fields except the Description field.
If you modify or delete conversions in the normalizer resource within the existing set of resources for the collector, the changes in the normalizer are not saved and the resource may become corrupted. If you need to modify conversions in a normalizer that is already part of a service, the changes must be made directly to the resource under Resources → Normalizers in the web interface.
Page top
Normalizer settings
The normalizer window contains two tabs: Normalization scheme and Enrichment.
Normalization scheme
This tab is used to specify the main settings of the normalizer and to define the rules for converting events into KUMA format.
Available settings:
- Name (required)—the name of the normalizer. Must contain from 1 to 128 Unicode characters. The name of the main normalizer will be used as the name of the normalizer resource.
- Tenant (required)—name of the tenant that owns the resource.
This setting is not available for extra normalizers.
- Parsing method (required)—drop-down list for selecting the type of incoming events. Depending on your choice, you can use the preconfigured rules for matching event fields or set your own rules. When you select some parsing methods, additional parameter fields required for filling in may become available.
Available parsing methods:
- json
- cef
- regexp
This parsing method is used to create custom rules for processing JSON data.
In the Normalization parameter block field, add a regular expression (RE2 syntax) with named capture groups. The name of a group and its value will be interpreted as the field and the value of the raw event, which can be converted into an event field in KUMA format.
To add event handling rules:
- Copy an example of the data you want to process to the Event examples field. This is an optional but recommended step.
- In the Normalization parameter block field add a regular expression with named capture groups in RE2 syntax, for example "(?P<name>regexp)".
You can add multiple regular expressions by using the Add regular expression button. If you need to remove the regular expression, use the
button. - Click the Copy field names to the mapping table button.
Capture group names are displayed in the KUMA field column of the Mapping table. Now you can select the corresponding KUMA field in the column next to each capture group. Otherwise, if you named the capture groups in accordance with the CEF format, you can use the automatic CEF mapping by selecting the Use CEF syntax for normalization check box.
Event handling rules were added.
- syslog
- csv
- kv
- xml
- netflow5
- netflow9
- ipfix
- sql
- Keep raw log (required)—in this drop-down list, you can indicate whether you need to store the original raw event in the newly created normalized event. Available values:
- Never—do not save the raw event This is the default setting.
- Only errors—save the raw event in the
Rawfield of the normalized event if errors occurred when parsing it. This value is convenient to use when debugging a service. In this case, every time an event has a non-emptyRawfield, you know there was a problem.If fields containing the names
*Addressor*Date*do not comply with normalization rules, these fields are ignored. No normalization error will occur, and the values of the fields will not show up in theRawfield of the normalized event even if Keep raw log → Only errors was indicated. - Always—always save the raw event in the
Rawfield of the normalized event.
This setting is not available for extra normalizers.
- Save extra fields (required)—in this drop-down list, you can choose whether you need to save fields of the original event in the normalized event if no mapping rules have been configured for them (see below). The data is stored in the Extra event field. By default, fields are not saved.
- Description—up to 256 Unicode characters describing the resource.
This setting is not available for extra normalizers.
- Event examples—in this field, you can provide an example of data that you want to process. Event examples can also be loaded from a TSV, CSV, or TXT file by using the Load from file button.
- Mapping settings block—here you can configure mapping of original event fields to fields of the event in KUMA format:
- Source—column for the names of the original event fields that you want to convert into KUMA event fields.
Clicking the
 button next to the field names in the Source column opens the Conversion window, in which you can use the Add conversion button to create rules for modifying the original data before they are written to the KUMA event fields.
 - KUMA field—drop-down list for selecting the required fields of KUMA events. You can search for fields by entering their names in the field.
- Label—in this column, you can add a unique custom label to event fields that begin with DeviceCustom*.
New table rows can be added by using the Add row button. Rows can be deleted individually using the
button or all at once using the Clear all button.If you have loaded data into the Event examples field, the table will have an Examples column containing examples of values carried over from the raw event field to the KUMA event field.
- Source—column for the names of the original event fields that you want to convert into KUMA event fields.
Enrichment
This tab is used to add additional data to fields of a normalized event by using enrichment rules similar to the rules in enrichment rule resources. These enrichment rules are stored in the normalizer resource where they were created. There can be more than one enrichment rule. Enrichments are created by using the Add enrichment button.
Settings available in the enrichment rule settings block:
- Source kind (required)—drop-down list for selecting the type of enrichment. Depending on the selected type, you may see advanced settings that will also need to be completed.
Available Enrichment rule source types:
- constant
- dictionary
- event
This type of enrichment is used when you need to write a value from another event field to the current event field.
When this type is selected in the Source field drop-down list, you must select the event field from where the value will be copied to the target field. Clicking the
button opens the Conversion window in which you can, using the Add conversion button, create rules for modifying the original data before writing them to the KUMA event fields. - template
- Target field (required)—drop-down list for selecting the KUMA event field that should receive the data.
Condition for forwarding data to an extra normalizer
The Add normalizer to normalization scheme window is used to specify the conditions under which the data will be sent to an extra normalizer.
Available settings:
- Fields to pass into normalizer—used to indicate event fields in case you want to send only events with specific fields to the extra normalizer.
If you leave this field blank, the full event will be sent to the extra normalizer for processing.
- Use normalizer for events with specific event field values—used to indicate event fields if you want the extra normalizer to receive only events in which specific values are assigned to certain fields. The value is specified in the Condition value field.
The data processed by these conditions can be preconverted by clicking the
button. This opens the Conversion window, in which you can use the Add conversion button to create rules for modifying the original data before it is written to the KUMA event fields.
Preset normalizers
The normalizers listed in the table below are included in the KUMA kit.
Normalizer name |
Source of events |
Type |
Comment |
[Example] Apache Access Syslog (Common or Combined Log Format) |
Apache access.log in Common or Combined Log format), with Syslog header |
syslog |
|
[Example] Apache Access file (Common or Combined Log Format) |
Apache access.log in Common or Combined Log format) |
regexp |
Reading file |
[Example] BIND Syslog |
BIND server DNS logs, with Syslog header |
syslog |
|
[Example] BIND file |
BIND server DNS logs |
regexp |
Reading file |
[Example] Bastion SKDPU-GW |
IT Bastion SKDPU system |
syslog |
|
[Example] CEF |
Events in CEF format from arbitrary sources |
cef |
|
[Example] Checkpoint Syslog CEF by CheckPoint |
Checkpoint, normalization based on the vendor's CEF event representation diagram |
syslog |
|
[Example] Checkpoint Syslog basic |
Custom mapping of Checkpoint fields, normalization depending on the type of asset |
syslog |
|
[Example] Cisco Basic |
Cisco ASA base set of events |
syslog |
|
[Example] Cisco ASA Extended v 0.1 |
Cisco ASA base extended set of events |
syslog |
|
[Example] Cisco WSA AccessFile |
Cisco WSA proxy server, access.log file |
regexp |
Reading file |
[Example] Continent DB AlertLog |
Hardware and software encryption system Continent, DB query, AlertLog table |
sql |
|
[Example] Continent DB PacketLog |
Hardware and software encryption system Continent, DB query, PacketLog table |
sql |
|
[Example] Continent DB ServerAccessLog |
Hardware and software encryption system Continent, DB query, ServerAccessLog table |
sql |
|
[Example] Continent DB SystemLog |
Hardware and software encryption system Continent, DB query, SystemLog table |
sql |
|
[Example] CyberTrace |
Kaspersky CyberTrace events |
regexp |
|
[Example] DNS Windows |
Windows DNS server logs |
regexp |
Reading file |
[Example] Dovecot Syslog |
dovecpt server POP3/IMAP logs |
syslog |
|
[Example] Exchange CSV |
Exchange server MTA logs |
csv |
Reading file |
[Example] Fortimail |
Fortimail mail system logs |
regexp |
Only KUMA v 1.5+ |
[Example] IIS Log File Format |
Microsoft IIS logs |
regexp |
Reading file |
[Example] IPFIX |
IPFIX format Netflow events |
ipfix |
|
[Example] InfoWatch Traffic Monitor |
DLP system Traffic Monitor by InfoWatch |
sql |
|
[Example] KATA |
Kaspersky Anti Targeted Attack |
cef |
|
[Example] KICS4Net v2.x |
Kaspersky Industrial Cyber Security v 2.x |
cef |
|
[Example] KICS4Net v3.x |
Kaspersky Industrial Cyber Security v 3.x |
syslog |
|
[Example] KSC |
Kaspersky Security Center |
cef |
Passive receiving of events from KSC: KUMA is listening to the port, KSC is sending events |
[Example] KSC from SQL |
Kaspersky Security Center |
sql |
Active receiving of events from KSC: KUMA receives events from the KSC DB |
[Example] KSMG |
Kaspersky Security Mail Gateway |
syslog |
|
[Example] Linux audit and iptables Syslog |
Linux events |
syslog |
|
[Example] Linux audit.log file |
Linux events |
regexp |
Reading file |
[Example] Syslog |
Events in Syslog format from arbitrary sources |
syslog |
|
[Example] Syslog-CEF |
Events in CEF format from arbitrary sources, with Syslog header |
syslog |
|
[Example] VipNet Coordinator Syslog |
VipNet Coordinator logs |
syslog |
|
[Example] Windows Basic |
Basic set of Windows Security events |
xml |
|
[Example] Windows Extended v.0.1 |
Extended set of Windows events |
xml |
|
[Example] pfSense Syslog |
pfSence events |
syslog |
|
[Example] pfSense w/o hostname |
Custom pfSence event normalizer (invalid Syslog header format) |
regexp |
|
[Example][Syslog] Continent IPS/IDS & TLS |
Continent intrusion detection system, TSL |
syslog |
Receiving from Syslog |
[Example][regexp] Continent IPS/IDS & TLS |
Continent intrusion detection system, TSL |
regexp |
Reading file |
[Example] NetFlow v5 |
Netflow v5 events |
netflow5 |
|
[Example] NetFlow v9 |
Netflow v9 events |
netflow9 |
|
[Example] MS DHCP file |
Windows DHCP server logs |
csv |
Reading file |
[Example] Nginx regexp |
Nginx log |
regexp |
|
[Example] PA-NGFW (Syslog-CSV) |
Palo Alto logs in CSV format |
csv |
The preferred option for sending logs is CEF format. Logs may only be sent in CSV if sending in CEF is not possible |
[Example] PT WAF |
Web Application Firewall by Positive Technologies |
syslog |
|
[Example] Squid access Syslog |
access.log logs of the Squid proxy server |
syslog |
|
[Example] Squid access.log file |
access.log logs of the Squid proxy server |
regexp |
Reading file |
[Example] Unbound Syslog |
Unbound DNS server logs |
syslog |
|
Filters
Filter resources are used to select events based on user-defined conditions.
This is not true only when filters are used in the collector service, in which the filters select all events that DO NOT satisfy filter conditions.
Filters can be used in collector services, enrichment rule resources, aggregation rule resources, response rule resources, correlation rule resources, and destination resources either as separate filter resources or as built-in filters stored in the service or resource where they were created.
For these resources, you can enable the display of control characters in all input fields except the Description field.
Available settings for filter resources:
- Name (required)—a unique name for this type of resource. Must contain from 1 to 128 Unicode characters. Inline filters are created in other resources or services and do not have names.
- Tenant (required)—name of the tenant that owns the resource.
- Conditions settings block—here you can formulate filtering criteria by creating filter conditions and groups of filters, and by adding existing filter resources.
You can use the Add group button to add a group of filters. Group operators can be switched between AND, OR, and NOT. Groups, conditions, and existing filter resources can be added to groups of filters.
You can use the Add filter button to add an existing filter resource, which should be selected in the Select filter drop-down list.
You can use the Add condition button to add a string containing fields for identifying the condition (see below).
Conditions, groups, and filters can be deleted by using the
button.
Settings of conditions:
- When (required)—in this drop-down list, you can specify whether or not to use the inverted function of the operator.
- Left operand and Right operand (required)—used to specify the values that the operator will process. The available types depend on the selected operator.
- Operator (required)—used to select the condition operator.
In this drop-down list, you can select the do not match case check box if the operator should ignore the case of values. This check box is ignored if the InSubnet, InActiveList, InCategory, and InActiveDirectoryGroup operators are selected. This check box is cleared by default.
The available operand kinds depends on whether the operand is left (L) or right (R).
Available operand kinds for left (L) and right (R) operands
Operator |
Event field type |
Active list type |
Dictionary type |
Constant type |
List type |
TI type |
= |
L,R |
L,R |
L,R |
R |
R |
L,R |
> |
L,R |
L,R |
L,R |
R |
|
L,R |
>= |
L,R |
L,R |
L,R |
R |
|
L,R |
< |
L,R |
L,R |
L,R |
R |
|
L,R |
<= |
L,R |
L,R |
L,R |
R |
|
L,R |
contains |
L,R |
L,R |
L,R |
R |
R |
L,R |
startsWith |
L,R |
L,R |
L,R |
R |
R |
L,R |
endsWith |
L,R |
L,R |
L,R |
R |
R |
L,R |
match |
L |
L |
L |
R |
R |
L |
inSubnet |
L,R |
L,R |
L,R |
R |
R |
L,R |
inCategory |
L |
L |
L |
R |
R |
|
inActiveDirectoryGroup |
L |
L |
L |
R |
R |
|
inActiveList |
|
L |
|
|
|
|
TIDetect |
|
|
|
|
|
|
Enrichment rules
Enrichment rule resources are used to update the event fields.
Available Enrichment rule resource parameters:
- Name (required)—a unique name for this type of resource. Must contain from 1 to 128 Unicode characters.
- Tenant (required)—name of the tenant that owns the resource.
- Source kind (required)—drop-down list for selecting the type of incoming events. Depending on the selected type, you may see the following additional settings:
- constant
- dictionary
- event
- template
- dns
- cybertrace
This type of enrichment is used to add information from CyberTrace data streams to event fields.
Available settings:
- URL (required)—in this field, you can specify the URL of a CyberTrace server to which you want to send requests.
- Number of connections—maximum number of connections to the CyberTrace server that can be simultaneously established by KUMA. By default, this value is equal to the number of vCPUs of the KUMA Core server.
- RPS—maximum number of requests sent to the server per second. The default value is
1000. - Timeout—amount of time to wait for a response from the CyberTrace server, in seconds. The default value is
30. - Mapping (required)—this settings block contains the mapping table for mapping KUMA event fields to CyberTrace indicator types. The KUMA field column shows the names of KUMA event fields, and the CyberTrace indicator column shows the types of CyberTrace indicators.
Available types of CyberTrace indicators:
- ip
- url
- hash
In the mapping table, you must provide at least one string. You can use the Add row button to add a string, and can use the
button to remove a string.
- Debug—you can use this drop-down list to enable logging of service operations. Logging is disabled by default.
- Description—up to 256 Unicode characters describing the resource.
- Filter—settings block in which you can specify the conditions for identifying events that will be processed by the aggregation rule resource. You can select an existing filter resource from the drop-down list, or select Create new to create a new filter.
Creating a filter in resources
- In the Filter drop-down list, select Create new.
- If you want to keep the filter as a separate resource, set the Save filter toggle switch.
In this case, you will be able to use the created filter in various services.
The toggle switch is turned off by default.
- If you toggle the Save filter switch on, enter a name for the created filter resource in the Name field. The name must contain from 1 to 128 Unicode characters.
- In the Conditions settings block, specify the conditions that the events must meet:
- Click the Add condition button.
- In the Left operand and Right operand drop-down lists, specify the search parameters.
Depending on the data source selected in the Right operand field, you may see fields of additional parameters that you need to use to define the value that will be passed to the filter. For example, when choosing active list you will need to specify the name of the active list, the entry key, and the entry key field.
- In the operator drop-down list, select the relevant operator.
- If necessary, select the do not match case check box. When this check box is selected, the operator ignores the case of the values.
The selection of this check box does not apply to the InSubnet, InActiveList, InCategory or InActiveDirectoryGroup operators.
This check box is cleared by default.
- If you want to add a negative condition, select If not from the If drop-down list.
- You can add multiple conditions or a group of conditions.
- If you have added multiple conditions or groups of conditions, choose a search condition (and, or, not) by clicking the AND button.
- If you want to add existing filters that are selected from the Select filter drop-down list, click the Add filter button.
You can view the nested filter settings by clicking the
button.
Aggregation rules
Aggregation rule resources are used to group repeated events into aggregation events.
Available settings:
- Name (required)—a unique name for this type of resource. Must contain from 1 to 128 Unicode characters.
- Tenant (required)—name of the tenant that owns the resource.
- Threshold—the number of events that should be received before the aggregation rule is triggered and the events are aggregated. The default value is
100. - Triggered rule lifetime (required)—time period (in seconds) when events are received for aggregation. On the timeout, the aggregation rule is triggered and a new event is created. The default value is
60. - Description—up to 256 Unicode characters describing the resource.
- Identical fields (required)—in this drop-down list you can select fields that should be used to group events for aggregation.
- Unique fields—in this drop-down list you can select the fields that will disqualify events from aggregation even if their Identical fields parameter match the aggregation rule condition.
- Sum fields—in this drop-down list, you can select the fields whose values should be summed during aggregation.
- Filter—settings block in which you can specify the conditions for identifying events that will be processed by this resource. You can select an existing filter resource from the drop-down list, or select Create new to create a new filter.
In aggregation rule resources, do not use filters with the TI operand or the TIDetect and inActiveDirectoyGroup operators. The Active Directory fields for which you can use the inActiveDirectoyGroup operator will appear during the enrichment stage (after aggregation rules are executed).
Creating a filter in resources
- In the Filter drop-down list, select Create new.
- If you want to keep the filter as a separate resource, set the Save filter toggle switch.
In this case, you will be able to use the created filter in various services.
The toggle switch is turned off by default.
- If you toggle the Save filter switch on, enter a name for the created filter resource in the Name field. The name must contain from 1 to 128 Unicode characters.
- In the Conditions settings block, specify the conditions that the events must meet:
- Click the Add condition button.
- In the Left operand and Right operand drop-down lists, specify the search parameters.
Depending on the data source selected in the Right operand field, you may see fields of additional parameters that you need to use to define the value that will be passed to the filter. For example, when choosing active list you will need to specify the name of the active list, the entry key, and the entry key field.
- In the operator drop-down list, select the relevant operator.
- If necessary, select the do not match case check box. When this check box is selected, the operator ignores the case of the values.
The selection of this check box does not apply to the InSubnet, InActiveList, InCategory or InActiveDirectoryGroup operators.
This check box is cleared by default.
- If you want to add a negative condition, select If not from the If drop-down list.
- You can add multiple conditions or a group of conditions.
- If you have added multiple conditions or groups of conditions, choose a search condition (and, or, not) by clicking the AND button.
- If you want to add existing filters that are selected from the Select filter drop-down list, click the Add filter button.
You can view the nested filter settings by clicking the
button.
Destinations
Destination resources are used to receive events and then forward them to other services. The settings of destinations are configured on two tabs: Basic settings and Advanced settings. The available settings depend on the selected type of destination.
Basic settings
- Name (required)—a unique name for this type of resource. Must contain from 1 to 128 Unicode characters.
- Tenant (required)—name of the tenant that owns the resource.
- Disabled toggle switch—used if you do not need to send events to a destination. By default, sending events is enabled.
- Type (required)—drop-down list for selecting the type of destination:
- nats—used for NATS communications.
- tcp—used for communications over TCP.
- http—used for HTTP communications.
- kafka—used for Kafka communications.
- file—used for writing to a file.
- storage—used to transmit data to the storage.
- correlator—used to transmit data to the correlator.
- URL (required)—URL where events should be sent. The port must be specified together with the URL. For example:
hostname:port.You can specify multiple destination URLs using the URL button for all types except nats and file, if your KUMA license includes High Level Availability module.
If you have selected storage or correlator as the destination type, the URL field can be populated automatically using the Copy service URL drop-down list that displays active services of the selected type.
- Topic (required)—setting for the types of destinations: nats and kafka. The topic that data should be written to. The topic name must contain from 1 to 255 Unicode characters.
- Description—up to 256 Unicode characters describing the resource.
Advanced settings
- Compression is a drop-down list where you can enable Snappy compression. By default, compression is disabled.
- Proxy is a drop-down list for proxy server resource selection.
- Buffer size field is used to set buffer size (in bytes) for the destination resource. The default value is 1 MB, and the maximum value is 64 MB.
- Timeout field is used to set the timeout (in seconds) for another service or component response. The default value is
30. - Disk buffer size limit field is used to specify the size of the disk buffer in bytes. The default size is 10 GB.
- Storage ID is a NATS storage identifier.
- TLS mode specifies whether TLS encryption is used:
- Disabled (default)—do not use TLS encryption.
- Enabled—use encryption without certificate verification.
- With verification—use encryption with verification that the certificate was signed with the KUMA root certificate. The root certificate and key of KUMA are created automatically during program installation and are stored on the KUMA Core server in the folder /opt/kaspersky/kuma/core/certificates/.
- Custom CA—use encryption with verification that the certificate was signed by a Certificate Authority. The secret containing the certificate is selected from the Custom CA drop-down list, which is displayed when this option is selected. This option is available in the http, nats, and kafka destination types.
When using TLS, it is impossible to specify an IP address as a URL.
- TLS mode specifies whether TLS encryption is used:
- URL selection policy is a drop-down list in which you can select a method for determining which URL to send events to if several URLs have been specified:
- Any
- Prefer first
- Round robin
- Delimiter is used to specify the character delimiting the events. By default,
\nis used. - Path—the file path if the file destination type is selected.
- Flush interval sets the time (in seconds) between sending data to the destination resource. The default value is
100. - Workers—this field is used to set the number of services processing the queue. By default, this value is equal to the number of vCPUs of the KUMA Core server.
- You can set health checks using the Health check path and Health check timeout fields. You can also disable health checks by selecting the Health Check Disabled check box.
- Debug—a drop-down list where you can specify whether resource logging should be enabled. By default it is Disabled.
- The Disk buffer disabled drop-down list is used to enable or disable the use of a disk buffer. By default, the disk buffer is disabled.
- In the Filter section you can specify conditions to identify events that will be processed by the aggregation rule resource. You can select an existing filter resource from the drop-down list, or select Create new to create a new filter.
Creating a filter in resources
- In the Filter drop-down list, select Create new.
- If you want to keep the filter as a separate resource, set the Save filter toggle switch.
In this case, you will be able to use the created filter in various services.
The toggle switch is turned off by default.
- If you toggle the Save filter switch on, enter a name for the created filter resource in the Name field. The name must contain from 1 to 128 Unicode characters.
- In the Conditions settings block, specify the conditions that the events must meet:
- Click the Add condition button.
- In the Left operand and Right operand drop-down lists, specify the search parameters.
Depending on the data source selected in the Right operand field, you may see fields of additional parameters that you need to use to define the value that will be passed to the filter. For example, when choosing active list you will need to specify the name of the active list, the entry key, and the entry key field.
- In the operator drop-down list, select the relevant operator.
- If necessary, select the do not match case check box. When this check box is selected, the operator ignores the case of the values.
The selection of this check box does not apply to the InSubnet, InActiveList, InCategory or InActiveDirectoryGroup operators.
This check box is cleared by default.
- If you want to add a negative condition, select If not from the If drop-down list.
- You can add multiple conditions or a group of conditions.
- If you have added multiple conditions or groups of conditions, choose a search condition (and, or, not) by clicking the AND button.
- If you want to add existing filters that are selected from the Select filter drop-down list, click the Add filter button.
You can view the nested filter settings by clicking the
button.
Dictionaries
Dictionary resources are key-value stores that can be used by other KUMA resources and services. The stored information is displayed in the table.
Available settings:
- Name (required)—a unique name for this type of resource. Must contain from 1 to 128 Unicode characters.
- Tenant (required)—name of the tenant that owns the resource.
- Description—you can add up to 256 Unicode characters describing the resource.
- Values settings block—contains a table of Key–Value pairs. You can click the Blank fields button to add new strings to the table or click the button to remove strings from the table.
You can also import or export dictionary information in the CSV format using the Import CSV or Export CSV links.
Importing CSV
You can import information into the dictionary in CSV format {KEY},{VALUE}\n, where:
{KEY}—unique key for both CSV file and the dictionary, where the CSV is being imported to.,—comma delimiter.{VALUE}—key value.
When CSV file is imported, the name of the dictionary is changed to reflect the name of the imported file. Imported keys and values are added to the dictionary. You can import data to the Dictionary multiple times.
Exporting CSV
You can export information from the dictionary in CSV format {KEY},{VALUE}\n, where:
{KEY}—unique key for both CSV file and the dictionary, where the CSV is being imported to.- Comma is used as a delimiter.
{VALUE}—key value.
If the key or value contain comma or quotation mark characters (, and "), they are enclosed in quotation marks ("). Also, quotation mark character (") is shielded with additional quotation mark (").
Page top
Correlation rules
Correlation rule resources are used in services of correlators to recognize specific sequences of processed events and to take certain actions after recognition, such as creating correlation events/alerts or interacting with an active list.
The available correlation rule settings depend on the selected type. Types of correlation rules:
- standard—used to find correlations between several events. Resources of this kind can create correlation events.
This resource kind is used to determine complex correlation patterns. For simpler patterns you should use other correlation rule kinds that require less resources to operate.
- simple—used to create correlation events if a certain event was found.
- operational—used for operations with Active lists. This resource kind cannot create correlation events.
For these resources, you can enable the display of control characters in all input fields except the Description field.
If a correlation rule is used in the correlator and an alert was created based on it, any change to the correlation rule resource will not result in a change to the existing alert even if the correlator service is restarted. For example, if the name of a correlation rule is changed, the name of the alert will remain the same. If you close the existing alert, a new alert will be created and it will take into account the changes made to the correlation rule resource.
Standard correlation rules
Standard correlation rules are used to identify complex patterns in processed events.
The search for patterns is conducted by using containers
The correlation rule resource window contains the following configuration tabs:
- General—used to specify the main settings of the correlation rule resource. On this tab, you can select the type of correlation rule.
- Selectors—used to define the conditions that the processed events must fulfill to trigger the correlation rule. Available parameters vary based on the selected resource type.
- Actions—used to set the triggers that will activate when the conditions configured in the Selectors settings block are fulfilled. The Correlation rule resource must have at least one trigger. Available parameters vary based on the selected resource type.
General tab
- Name (required)—a unique name for this type of resource. Must contain from 1 to 128 Unicode characters.
- Tenant (required)—the tenant that owns the correlation rule.
- Type (required)—a drop-down list for selecting the type of correlation rule. Select standard if you want to create a standard correlation rule.
- Identical fields (required)—the event fields that should be grouped in a Bucket. The hash of the values of the selected fields is used as the Bucket key. If the selector (see below) triggers, the selected fields will be copied to the correlation event.
- Unique fields—event fields that should be sent to the Bucket. If this parameter is set, the Bucket will receive only unique events. The hash of the selected fields' values is used as the Bucket key. If the Correlation rule triggers, the selected fields will be copied to the correlation event.
- Rate limit—maximum number of times a correlation rule can be triggered per second. The default value is 100.
If correlation rules employing complex logic for pattern detection are not triggered, this may be due to the specific method used to count rule triggers in KUMA. In this case, try to increase the value of Rate limit to
1000000, for example. - Window, sec (required)—container lifetime, in seconds. This timer starts when the Bucket is created (when it receives the first event). The lifetime is not updated, and when it runs out, the On timeout trigger from the Actions group of settings is activated and the bucket is deleted. The On every threshold and On subsequent thresholds triggers can be activated more than once during the lifetime of the Bucket.
- Base events keep policy—this drop-down list is used to specify which base events must be stored in the correlation event:
- first (default value)—this option is used to store the first base event of the event collection that triggered creation of the correlation event.
- last—this option is used to store the last base event of the event collection that triggered creation of the correlation event.
- all—this option is used to store all base events of the event collection that triggered creation of the correlation event.
- Priority—base coefficient used to determine the importance of a correlation rule. The default value is
Low. - Description—the description of a resource. Up to 256 Unicode characters.
Selectors tab
There can be multiple selectors in the standard resource kind. You can add selectors by clicking the Add selector button and can remove them by clicking the Delete selector button. Selectors can be moved by using the button.
For each selector, the following parameters are available
- Alias (required)—unique name of the event group that meets the conditions of the selector. This name is used to identify events in the filter. Must contain from 1 to 128 Unicode characters.
- Selector threshold (event count) (required)—the number of events that must be received by the selector to trigger.
- Filter (required)—used to set the criteria for determining events that should trigger the selector. You can select an existing filter resource from the drop-down list, or select Create new to create a new filter.
Creating a filter in resources
- In the Filter drop-down list, select Create new.
- If you want to keep the filter as a separate resource, set the Save filter toggle switch.
In this case, you will be able to use the created filter in various services.
The toggle switch is turned off by default.
- If you toggle the Save filter switch on, enter a name for the created filter resource in the Name field. The name must contain from 1 to 128 Unicode characters.
- In the Conditions settings block, specify the conditions that the events must meet:
- Click the Add condition button.
- In the Left operand and Right operand drop-down lists, specify the search parameters.
Depending on the data source selected in the Right operand field, you may see fields of additional parameters that you need to use to define the value that will be passed to the filter. For example, when choosing active list you will need to specify the name of the active list, the entry key, and the entry key field.
- In the operator drop-down list, select the relevant operator.
- If necessary, select the do not match case check box. When this check box is selected, the operator ignores the case of the values.
The selection of this check box does not apply to the InSubnet, InActiveList, InCategory or InActiveDirectoryGroup operators.
This check box is cleared by default.
- If you want to add a negative condition, select If not from the If drop-down list.
- You can add multiple conditions or a group of conditions.
- If you have added multiple conditions or groups of conditions, choose a search condition (and, or, not) by clicking the AND button.
- If you want to add existing filters that are selected from the Select filter drop-down list, click the Add filter button.
You can view the nested filter settings by clicking the
button.
- Recovery—this check box must be selected when the Correlation rule must NOT trigger if a certain number of events are received from the selector. By default, this check box is cleared.
If more than one selector is added to the correlation rule resource, the Join filter settings block becomes available. This filter is used to compare the fields of different events. The Join filter is configured by using the Filter drop-down list as described above.
Actions tab
There can be multiple triggers in a standard type of resource.
- On first threshold—this trigger activates when the Bucket registers the first triggering of the selector during the lifetime of the Bucket.
- On subsequent thresholds—this trigger activates when the Bucket registers the second and all subsequent triggering of the selector during the lifetime of the Bucket.
- On every threshold—this trigger activates every time the Bucket registers the triggering of the selector.
- On timeout—this trigger activates when the lifetime of the Bucket ends, and is linked to the selector with the Recovery check box selected. In other words, this trigger activates if the situation detected by the correlation rule is not resolved within the defined amount of time.
Every trigger is represented as a group of settings with the following parameters available:
- Output—if this check box is selected, the correlation event will be sent for post-processing: for enrichment, for a response, and to destinations.
- Loop—if this check box is selected, the correlation event will be processed by the current correlation rule resource. This allows hierarchical correlation.
If both check boxes are selected, the correlation rule will be sent for post-processing first and then to the current correlation rule selectors.
- Do not create alert—if this check box is selected, an alert will not be created when this correlation rule is triggered.
- Active lists update settings group—used to assign the trigger for one or more operations with active lists. You can use the Add active list action and Delete active list action buttons to add or delete operations with active lists, respectively.
Available settings:
- Name (required)—this drop-down list is used to select the Active list resources.
- Operation (required)—this drop-down list is used to select the operation that must be performed:
- Get—get the Active list entry and write the values of the selected fields into the correlation event.
- Set—write the values of the selected fields of the correlation event into the Active list by creating a new or updating an existing Active list entry. When the Active list entry is updated, the data is merged and only the specified fields are overwritten.
- Delete—delete the Active list entry.
- Key fields (required)—this is the list of event fields used to create the Active list entry. It is also used as the Active list entry key.
The active list entry key depends on the available fields and does not depend on the order in which they are displayed in the KUMA web interface.
- Mapping (required for Get and Set operations)—used to map Active list fields with events fields. More than one mapping rule can be set.
The left field is used to specify the Active list field. The middle drop-down list is used to select event fields. The right field can be used to assign a constant to the Active list field is the Set operation was selected.
- Enrichment settings block—you can update the field values of correlation events by using enrichment rules similar to enrichment rule resources. These enrichment rules are stored in the Correlation rule resource where they were created. It is possible to have more than one enrichment rule. Enrichment rules can be added or deleted by using the Add enrichment or Remove enrichment buttons, respectively.
- Source kind—you can select the type of enrichment in this drop-down list. Depending on the selected type, you may see advanced settings that will also need to be completed.
Available types of enrichment:
- constant
- dictionary
- event
This type of enrichment is used when you need to write a value from another event field to the current event field.
When this type is selected in the Source field drop-down list, you must select the event field from where the value will be copied to the target field. Clicking the
button opens the Conversion window in which you can, using the Add conversion button, create rules for modifying the original data before writing them to the KUMA event fields. - template
- Target field—in this drop-down list, you can select the KUMA event field that should receive the data.
- Debug—you can use this drop-down list to enable logging of service operations.
- Description—the description of a resource. Up to 256 Unicode characters.
- Filter settings block—lets you select which events will be forwarded for enrichment. Configuration is performed as described above.
- Source kind—you can select the type of enrichment in this drop-down list. Depending on the selected type, you may see advanced settings that will also need to be completed.
- Categorization settings group—used to change the categories of assets indicated in events. There can be several categorization rules. You can add or delete them by using the Add categorization or Remove categorization buttons. Only reactive categories can be added to assets or removed from assets.
- Operation—this drop-down list is used to select the operation to perform on the category:
- Add—assign the category to the asset.
- Delete—unbind the asset from the category.
- Event field—event field that indicates the asset requiring the operation.
- Category ID—you can click the
 button to select the category requiring the operation. Clicking this button opens the Select categories window showing the category tree.
- Operation—this drop-down list is used to select the operation to perform on the category:
Simple correlation rules
Simple correlation rules are used to define simple sequences of events.
The correlation rule resource window contains the following configuration tabs:
- General—used to specify the main settings of the correlation rule resource. On this tab, you can select the type of correlation rule.
- Selectors—used to define the conditions that the processed events must fulfill to trigger the correlation rule. Available parameters vary based on the selected resource type.
- Actions—used to set the triggers that will activate when the conditions configured in the Selectors settings block are fulfilled. The Correlation rule resource must have at least one trigger. Available parameters vary based on the selected resource type.
General tab
- Name (required)—a unique name for this type of resource. Must contain from 1 to 128 Unicode characters.
- Tenant (required)—the tenant that owns the correlation rule.
- Type (required)—a drop-down list for selecting the type of correlation rule. Select simple if you want to create a simple correlation rule.
- Identical fields (required)—event fields used for event selection. If the selector (see below) triggers, the selected fields will be copied to the correlation event.
- Rate limit—maximum number of times a correlation rule can be triggered per second. The default value is 100.
If correlation rules employing complex logic for pattern detection are not triggered, this may be due to the specific method used to count rule triggers in KUMA. In this case, try to increase the value of Rate limit to
1000000, for example. - Priority—base coefficient used to determine the importance of a correlation rule. The default value is
Low. - Description—the description of a resource. Up to 256 Unicode characters.
Selectors tab
A simple resource can have only one selector with a Filter settings block:
- Filter (required)—used to set the criteria for determining events that should trigger the selector. You can select an existing filter resource from the drop-down list, or select Create new to create a new filter.
Creating a filter in resources
- In the Filter drop-down list, select Create new.
- If you want to keep the filter as a separate resource, set the Save filter toggle switch.
In this case, you will be able to use the created filter in various services.
The toggle switch is turned off by default.
- If you toggle the Save filter switch on, enter a name for the created filter resource in the Name field. The name must contain from 1 to 128 Unicode characters.
- In the Conditions settings block, specify the conditions that the events must meet:
- Click the Add condition button.
- In the Left operand and Right operand drop-down lists, specify the search parameters.
Depending on the data source selected in the Right operand field, you may see fields of additional parameters that you need to use to define the value that will be passed to the filter. For example, when choosing active list you will need to specify the name of the active list, the entry key, and the entry key field.
- In the operator drop-down list, select the relevant operator.
- If necessary, select the do not match case check box. When this check box is selected, the operator ignores the case of the values.
The selection of this check box does not apply to the InSubnet, InActiveList, InCategory or InActiveDirectoryGroup operators.
This check box is cleared by default.
- If you want to add a negative condition, select If not from the If drop-down list.
- You can add multiple conditions or a group of conditions.
- If you have added multiple conditions or groups of conditions, choose a search condition (and, or, not) by clicking the AND button.
- If you want to add existing filters that are selected from the Select filter drop-down list, click the Add filter button.
You can view the nested filter settings by clicking the
button.
Actions tab
There can be only one trigger in the simple resource kind: On every event. It is activated every time the selector triggers.
Available parameters of the trigger:
- Output—if this check box is selected, the correlation event will be sent for post-processing: for enrichment, for a response, and to destinations.
- Loop—if this check box is selected, the correlation event will be processed by the current correlation rule resource. This allows hierarchical correlation.
If both check boxes are selected, the correlation rule will be sent for post-processing first and then to the current correlation rule selectors.
- Do not create alert—if this check box is selected, an alert will not be created when this correlation rule is triggered.
- Active lists update settings group—used to assign the trigger for one or more operations with active lists. You can use the Add active list action and Delete active list action buttons to add or delete operations with active lists, respectively.
Available settings:
- Name (required)—this drop-down list is used to select the Active list resources.
- Operation (required)—this drop-down list is used to select the operation that must be performed:
- Get—get the Active list entry and write the values of the selected fields into the correlation event.
- Set—write the values of the selected fields of the correlation event into the Active list by creating a new or updating an existing Active list entry. When the Active list entry is updated, the data is merged and only the specified fields are overwritten.
- Delete—delete the Active list entry.
- Key fields (required)—this is the list of event fields used to create the Active list entry. It is also used as the Active list entry key.
The active list entry key depends on the available fields and does not depend on the order in which they are displayed in the KUMA web interface.
- Mapping (required for Get and Set operations)—used to map Active list fields with events fields. More than one mapping rule can be set.
The left field is used to specify the Active list field. The middle drop-down list is used to select event fields. The right field can be used to assign a constant to the Active list field is the Set operation was selected.
- Enrichment settings block—you can update the field values of correlation events by using enrichment rules similar to enrichment rule resources. These enrichment rules are stored in the Correlation rule resource where they were created. It is possible to have more than one enrichment rule. Enrichment rules can be added or deleted by using the Add enrichment or Remove enrichment buttons, respectively.
- Source kind—you can select the type of enrichment in this drop-down list. Depending on the selected type, you may see advanced settings that will also need to be completed.
Available types of enrichment:
- constant
- dictionary
- event
This type of enrichment is used when you need to write a value from another event field to the current event field.
When this type is selected in the Source field drop-down list, you must select the event field from where the value will be copied to the target field. Clicking the
button opens the Conversion window in which you can, using the Add conversion button, create rules for modifying the original data before writing them to the KUMA event fields. - template
- Target field—in this drop-down list, you can select the KUMA event field that should receive the data.
- Debug—you can use this drop-down list to enable logging of service operations.
- Description—the description of a resource. Up to 256 Unicode characters.
- Filter settings block—lets you select which events will be forwarded for enrichment. Configuration is performed as described above.
- Source kind—you can select the type of enrichment in this drop-down list. Depending on the selected type, you may see advanced settings that will also need to be completed.
- Categorization settings group—used to change the categories of assets indicated in events. There can be several categorization rules. You can add or delete them by using the Add categorization or Remove categorization buttons. Only reactive categories can be added to assets or removed from assets.
- Operation—this drop-down list is used to select the operation to perform on the category:
- Add—assign the category to the asset.
- Delete—unbind the asset from the category.
- Event field—event field that indicates the asset requiring the operation.
- Category ID—you can click the button to select the category requiring the operation. Clicking this button opens the Select categories window showing the category tree.
- Operation—this drop-down list is used to select the operation to perform on the category:
Operational correlation rules
Operational correlation rules are used for working with active lists.
The correlation rule resource window contains the following configuration tabs:
- General—used to specify the main settings of the correlation rule resource. On this tab, you can select the type of correlation rule.
- Selectors—used to define the conditions that the processed events must fulfill to trigger the correlation rule. Available parameters vary based on the selected resource type.
- Actions—used to set the triggers that will activate when the conditions configured in the Selectors settings block are fulfilled. The Correlation rule resource must have at least one trigger. Available parameters vary based on the selected resource type.
General tab
- Name (required)—a unique name for this type of resource. Must contain from 1 to 128 Unicode characters.
- Tenant (required)—the tenant that owns the correlation rule.
- Type (required)—a drop-down list for selecting the type of correlation rule. Select operational if you want to create an operational correlation rule.
- Rate limit—maximum number of times a correlation rule can be triggered per second. The default value is 100.
If correlation rules employing complex logic for pattern detection are not triggered, this may be due to the specific method used to count rule triggers in KUMA. In this case, try to increase the value of Rate limit to
1000000, for example. - Description—the description of a resource. Up to 256 Unicode characters.
Selectors tab
There can be one selector in an operational resource. Only the Filter settings block is available in selector:
- Filter (required)—used to set the criteria for determining events that should trigger the selector. You can select an existing filter resource from the drop-down list, or select Create new to create a new filter.
Creating a filter in resources
- In the Filter drop-down list, select Create new.
- If you want to keep the filter as a separate resource, set the Save filter toggle switch.
In this case, you will be able to use the created filter in various services.
The toggle switch is turned off by default.
- If you toggle the Save filter switch on, enter a name for the created filter resource in the Name field. The name must contain from 1 to 128 Unicode characters.
- In the Conditions settings block, specify the conditions that the events must meet:
- Click the Add condition button.
- In the Left operand and Right operand drop-down lists, specify the search parameters.
Depending on the data source selected in the Right operand field, you may see fields of additional parameters that you need to use to define the value that will be passed to the filter. For example, when choosing active list you will need to specify the name of the active list, the entry key, and the entry key field.
- In the operator drop-down list, select the relevant operator.
- If necessary, select the do not match case check box. When this check box is selected, the operator ignores the case of the values.
The selection of this check box does not apply to the InSubnet, InActiveList, InCategory or InActiveDirectoryGroup operators.
This check box is cleared by default.
- If you want to add a negative condition, select If not from the If drop-down list.
- You can add multiple conditions or a group of conditions.
- If you have added multiple conditions or groups of conditions, choose a search condition (and, or, not) by clicking the AND button.
- If you want to add existing filters that are selected from the Select filter drop-down list, click the Add filter button.
You can view the nested filter settings by clicking the
button.
Actions tab
There can be only one trigger in the operational resource kind: On every event. It is activated every time the selector triggers.
Available parameters of the trigger:
- Active lists update settings group—used to assign the trigger for one or more operations with active lists. You can use the Add active list action and Delete active list action buttons to add or delete operations with active lists, respectively.
Available settings:
- Name (required)—this drop-down list is used to select the Active list resources.
- Operation (required)—this drop-down list is used to select the operation that must be performed:
- Get—get the Active list entry and write the values of the selected fields into the correlation event.
- Set—write the values of the selected fields of the correlation event into the Active list by creating a new or updating an existing Active list entry. When the Active list entry is updated, the data is merged and only the specified fields are overwritten.
- Delete—delete the Active list entry.
- Key fields (required)—this is the list of event fields used to create the Active list entry. It is also used as the Active list entry key.
The active list entry key depends on the available fields and does not depend on the order in which they are displayed in the KUMA web interface.
- Mapping (required for Get and Set operations)—used to map Active list fields with events fields. More than one mapping rule can be set.
The left field is used to specify the Active list field. The middle drop-down list is used to select event fields. The right field can be used to assign a constant to the Active list field is the Set operation was selected.
Active lists
Active list resources are dynamically updated data containers used by the KUMA correlators to read and write information when analyzing events according to correlation rules.
The same resource of an active list can be used by different correlator services. However, a separate entity of the active list is created for each correlator. Therefore, the contents of the active lists used by different correlators differ even if the active lists have the same names and IDs. The contents of the active list can be opened from the active services window.
Available active list resource settings:
- ID—identifier selected Active list. This setting is displayed for active lists that have been created. You can copy this value by using the
 button.
 - Name (required)—a unique name for this type of resource. Must contain from 1 to 128 Unicode characters.
- Tenant (required)—name of the tenant that owns the resource.
- TTL—time to live parameter of entries stored in the Active list, in seconds. The default value is
0. The maximum time to live is31536000(one year). When the time to live expires, the entry is deleted, and an event is generated for deleting the entry from the active list (see below). - Description—you can add up to 256 Unicode characters describing the resource.
During the correlation process, when entries are deleted from active lists, service events are generated in the correlators. These events only exist in the correlators, and they are not redirected to other destinations. Correlation rules can be configured to track these events so that they can be used to identify threats. Service event fields for deleting an entry from the active list are described below.
Event field |
Value or comment |
|
Event identifier |
|
Time when the expired entry was deleted |
|
|
|
|
|
|
|
Correlator ID |
|
Correlator name |
|
Active list ID |
|
Key of the expired entry |
|
Number of deleted entry updates increased by one |
Response rules
Response rule resources are used to automatically send messages when certain conditions are met. Resources of this type are used in correlators.
Available Response rule resources parameters:
- Name (required)—a unique name for this type of resource. Must contain from 1 to 128 Unicode characters.
- Tenant (required)—name of the tenant that owns the resource.
- Type (required)—available response types:
- ksctasks—if KUMA is integrated with Kaspersky Security Center, you can configure response rules to start Kaspersky Security Center tasks related to assets. For example, you can run a virus scan or database update. You can start these tasks only for assets that were imported from Kaspersky Security Center.
Settings of ksctasks responses
If a response rule resource is owned by the shared tenant, the displayed Kaspersky Security Center tasks that are available for selection are from the Kaspersky Security Center server that the main tenant is connected to.
If a response rule resource has a selected task that is absent from the Kaspersky Security Center server that the tenant is connected to, the task will not be performed for assets of this tenant. This situation could arise when two tenants are using a common correlator, for example.
- script—used for running a sequence of instructions written to a file. The script file is stored on the server where the correlator service using the response resource is installed: /opt/kaspersky/kuma/correlator/<Correlator ID>/scripts. The
kumauser of the operating system must be able to run the script.
- ksctasks—if KUMA is integrated with Kaspersky Security Center, you can configure response rules to start Kaspersky Security Center tasks related to assets. For example, you can run a virus scan or database update. You can start these tasks only for assets that were imported from Kaspersky Security Center.
- Description—you can add up to 256 Unicode characters describing the resource.
- Workers—the number of response processes that can be run simultaneously.
- Filter—used to define the conditions determining when events will be processed by the response rule resource. You can select an existing filter resource from the drop-down list, or select Create new to create a new filter.
Creating a filter in resources
- In the Filter drop-down list, select Create new.
- If you want to keep the filter as a separate resource, set the Save filter toggle switch.
In this case, you will be able to use the created filter in various services.
The toggle switch is turned off by default.
- If you toggle the Save filter switch on, enter a name for the created filter resource in the Name field. The name must contain from 1 to 128 Unicode characters.
- In the Conditions settings block, specify the conditions that the events must meet:
- Click the Add condition button.
- In the Left operand and Right operand drop-down lists, specify the search parameters.
Depending on the data source selected in the Right operand field, you may see fields of additional parameters that you need to use to define the value that will be passed to the filter. For example, when choosing active list you will need to specify the name of the active list, the entry key, and the entry key field.
- In the operator drop-down list, select the relevant operator.
- If necessary, select the do not match case check box. When this check box is selected, the operator ignores the case of the values.
The selection of this check box does not apply to the InSubnet, InActiveList, InCategory or InActiveDirectoryGroup operators.
This check box is cleared by default.
- If you want to add a negative condition, select If not from the If drop-down list.
- You can add multiple conditions or a group of conditions.
- If you have added multiple conditions or groups of conditions, choose a search condition (and, or, not) by clicking the AND button.
- If you want to add existing filters that are selected from the Select filter drop-down list, click the Add filter button.
You can view the nested filter settings by clicking the
button.
Proxies
Proxy server resources are used to store configuration settings for proxy servers.
Available settings:
- Name (required)—a unique name for this type of resource. Must contain from 1 to 128 Unicode characters.
- Tenant (required)—name of the tenant that owns the resource.
- Use URL from the secret (required)—drop-down list to select a secret resource that stores URLs of proxy servers. If required, a secret can be created in the proxy server creation window by using the button. The selected secret can be changed by clicking on the button.
- Do not use for domains—one or more domains that require direct access.
- Description—you can add up to 256 Unicode characters describing the resource.
Secrets
Secret resources are used to securely store sensitive information such as user names and passwords that must be used by KUMA to interact with external services.
Available settings:
- Name (required)—a unique name for this type of resource. Must contain from 1 to 128 Unicode characters.
- Tenant (required)—name of the tenant that owns the resource.
- Type (required)—the type of secret.
When you select the type in the drop-down list, the parameters for configuring this secret type also appear. These parameters are described below.
- Description—you can add up to 256 Unicode characters describing the resource.
Depending on the secret type, different fields are available. You can select one of the following secret types:
- credentials—this secret type is used to store account credentials required to connect to external services, such as an SMTP server. If you select this type of secret, you must fill in the User and Password fields.
- token—this secret type is used to store tokens for API requests. Tokens are used when connecting to IRP systems, for example. If you select this type of secret, you must fill in the Token field.
- ktl—this secret type is used to store Kaspersky Threat Intelligence Portal account credentials. If you select this type of secret, you must fill in the following fields:
- User and Password (required fields)—user name and password of your Kaspersky Threat Intelligence Portal account.
- PFX file (required)—lets you upload a Kaspersky Threat Intelligence Portal certificate key.
- PFX password (required)—the password for accessing the Kaspersky Threat Intelligence Portal certificate key.
- urls—this secret type is used to store URLs for connecting to SQL databases and proxy servers. In the Description field, you must provide a description of the connection for which you are using the secret of urls type. You can add URLs to URL fields by clicking the Add button, and remove them by clicking the button.
You can specify URLs in the following formats: hostname:port, IPv4:port, IPv6:port, :port.
- pfx—this type of secret is used for importing a PFX file containing certificates. If you select this type of secret, you must fill in the following fields:
- PFX file (required)—this is used to upload a PFX file. The file must contain a certificate and key. PFX files may include CA-signed certificates for server certificate verification.
- PFX password (required)—this is used to enter the password for accessing the certificate key.
- snmpV1—this type of secret is used to store the values of Community access (for example,
publicorprivate) that is required for interaction over the Simple Network Management Protocol. - snmpV3—this type of secret is used for storing data required for interaction over the Simple Network Management Protocol. If you select this type of secret, you must fill in the following fields:
- User—user name indicated without a domain.
- Security level—security level of the user.
- NoAuthNoPriv—messages are forwarded without authentication and without ensuring confidentiality.
- AuthNoPriv—messages are forwarded with authentication but without ensuring confidentiality.
- AuthPriv—messages are forwarded with authentication and ensured confidentiality.
You may see additional settings depending on the selected level.
- Password—user password. This field becomes available when the AuthNoPriv or AuthPriv security level is selected.
- Authentication protocol—the following protocols are available: MD5, SHA, SHA224, SHA256, SHA384, SHA512. This field becomes available when the AuthNoPriv or AuthPriv security level is selected.
- Privacy Protocol—protocol used for encrypting messages. Available protocols: DES, AES. This field becomes available when the AuthPriv security level is selected.
- Privacy password—encryption password that was set when the user was created. This field becomes available when the AuthPriv security level is selected.
- certificate—this secret type is used for storing certificate files. Files are uploaded to a resource by clicking the Upload certificate file button. X.509 certificate public keys in Base64 are supported.
KUMA services
Services are the main components of KUMA that work with events: receiving, processing, analyzing, and storing them. Each service consists of two parts that work together:
- One part of the service is created inside the KUMA web interface based on set of resources for services.
- The second part of the service is installed in the network infrastructure where the KUMA system is deployed as one of its components. The server part of a service can consist of several instances: for example, services of the same agent or storage can be installed on several computers at once.
On the server side, KUMA services are located in the
/opt/kaspersky/kumadirectory.
Parts of services are connected to each other by using the IDs of services.
Service types:
- Collectors are used to receive events and convert them to KUMA format.
- Correlators are used to analyze events and search for defined patterns.
- Storages are used to save events.
- Agents are used to receive events on remote devices and forward them to KUMA collectors.
In the KUMA web interface, services are displayed in the Resources → Active services section in table format. The table of services can be updated using the Refresh button and sorted by columns by clicking on the active headers.
Table columns:
- Type—type of service: agent, collector, correlator, or storage.
- Name—name of the service. Clicking on the name of the service opens its settings.
- Version—service version.
- Tenant—the name of the tenant that owns the service.
- FQDN—fully qualified domain name of the service server.
- IP address—IP address of the server where the service is installed.
- API Port—Remote Procedure Call port number.
- Status—service status:
- Green means that the service is running.
- Red means that the service is not running.
- Yellow means that there is no connection with ClickHouse nodes (this status is applied only to storage services). The reason for this is indicated in the service log if logging was enabled.
- Uptime—the time showing how long the service has been running.
Using the Add service button, you can create new services based on existing resource sets for services. In this window, you can restart a service or delete its certificate, copy the service identifier, or delete the service. In this section you can also view storage partitions and active correlator lists
Services can be edited by clicking on them under Resources → Active services. This opens a window containing the set of resources that were used to create the service. A service is edited by changing the settings of the resource set. Changes are saved by clicking the Save button and will take effect after the service is restarted.
If you modify or delete conversions in the normalizer resource within the existing set of resources for the collector, the changes in the normalizer are not saved and the resource may become corrupted. If you need to modify conversions in a normalizer that is already part of a service, the changes must be made directly to the resource under Resources → Normalizers in the web interface.
Services tools
This section describes the tools for working with services available in the Resources → Active services section of the KUMA web interface.
Getting service identifier
The service identifier is used to bind parts of the service residing within KUMA and installed in the network infrastructure into a single complex. An identifier is assigned to a service when it is created in KUMA, and is then used when installing the service to the server.
To get the identifier of a service:
- Log in to the KUMA web interface and open Resources → Active services.
- Select the check box next to the service whose ID you want to obtain, and click Copy ID.
The identifier of the service will be copied to the clipboard. It can be used, for example, for installing the service on a server.
Page top
Restarting the service
To restart the service:
- Log in to the KUMA web interface and open Resources → Active services.
- Select the check box next to the service and select the necessary option:
- Reload—perform a hot update of a running service configuration. For example, you can change the field mapping settings or the destination point settings this way.
- Restart—stop a service and start it again. This is used to change settings such as port number or connector type.
KUMA Windows Agent can be restarted as described above only if it is running on a remote computer. If the service on the remote computer is inactive, you will receive an error when trying to restart from KUMA. In that case you must restart KUMA Windows Agent service on the remote Windows machine. For information on restarting Windows services, refer to the documentation specific to the operating system version of your remote Windows computer.
- Reset certificate—remove certificates that the service uses for internal communication. For example, this can be used when Core certificate was updated.
When working with KUMA agents, this certificate reset method is available only for running agents (that have a green status). For agents with a red status, the certificate must be changed manually.
The service will be restarted.
Page top
Deleting the service
Before deleting the service get its ID. It will be required to remove the service for the server.
To delete the service:
- Log in to the KUMA web interface and open Resources → Active services.
- Select the check box next to the service you want to delete, and click Delete.
A confirmation window opens.
- Click OK.
The service has been deleted from the KUMA.
To remove the service from the server:
Delete the file /usr/lib/systemd/system/kuma-<Service type: collector, correlator, or storage >-<ID of the service>.service from the server where the service was installed.
Page top
Partitions window
If the Storage service was created and installed, you can view its partitions in the Partitions table.
To open Partitions table:
- Log in to the KUMA web interface and open Resources → Active services.
- Select the check box next to the relevant storage and click Go to partitions.
The Partitions table opens.
The table has the following columns:
- Tenant—the name of the tenant that owns the stored data.
- Date—the date when the space was created.
- Space—the name of the space.
- Size—the size of the space.
- Events—the number of stored events.
- Expires—the date when this space expires.
You can delete spaces.
To delete space:
- Open the Partitions table (see above).
- Open the drop-down list to the left from the required space.
- Select Delete.
A confirmation window opens.
- Click OK.
The space is deleted.
Page top
Correlator active list window
The Correlator active list table displays the active lists that are used by a specific correlator.
To open the Correlator active list table:
- Log in to the KUMA web interface and open Resources → Active services.
- Select the check box next to the relevant correlator and click Go to active lists.
The Correlator active list table opens.
The table has the following columns:
- Name—the name of the correlator list.
- Records—the number of record the active list contains.
- Size on disk—the size of the active list.
- Directory—the path to the active list on the KUMA Core server.
You can view, import, export, or clear active lists.
To view active list:
Open the Correlator active list table (see above) and click the name of the relevant active list.
The table with active list records opens. If you want to view the contents of a record, click on the value of its key (the Key column). If you want to delete the entry, click on the ![]() icon. You can also search records using the Search field.
icon. You can also search records using the Search field.
To export active list:
- Open the Correlator active list table (see above).
- Open the drop-down list to the left from the required active list.
- Click Export.
Active list is downloaded in JSON format using your browsers settings. The name of the downloaded file reflects the name of active list.
To import active list:
- Open the Correlator active list table (see above).
- Open the drop-down list to the left from the required active list.
- Select Import.
The active list import window opens.
- In the File field select the file you wan to import.
- In the Format drop-down list select the format of the file:
- csv
- tsv
- internal
- Under Key field, enter the name of the column containing the active list record keys.
- Select Import.
The data from the file is imported into the active list.
Page top
Searching for related events
You can search for events processed by the Correlator or the Collector services.
To search for events related to the Correlator or the Collector service:
- Log in to the KUMA web interface and open Resources → Active services.
- Select the check box next to the required correlator or collector and click Go to Events.
A new browser tab opens showing KUMA Events section with the services selected using the following search: ServiceID = <ID of the selected service>.
Service resource sets
Service resource sets are a resource type, a KUMA component, a set of settings based on which the KUMA services are created and operate. Resource sets for services are collections of resources.
Any resources added to a set of resources must be owned by the same tenant that owns the created set of resources. An exception is the shared tenant, whose owned resources can be used in the sets of resources of other tenants.
Resource sets for services are displayed in the Resources → <Resource set type for the service> section of the KUMA web interface. Available types:
- Collectors
- Correlators
- Storages
- Agents
When you select the required type, a table opens with the available sets of resources for services of this type. The resource table contains the following columns:
- Name—the name of a resource set. Can be used for searching and sorting.
- Time updated—date and time of the resource set last update. Can be used for sorting.
- Created by—the name of the user who created the resource set.
- Description—the description of the resource set.
Creating a collector
A collector consists of two parts: one part is created inside the KUMA web interface, and the other part is installed on a server in the network infrastructure intended for receiving events.
Actions in the KUMA web interface.
The creation of a collector in the KUMA web interface is carried out by using the Installation Wizard. This Wizard combines the required resources into a set of resources for a collector. Upon completion of the Wizard, the service itself is automatically created based on this set of resources.
To create a collector in the KUMA web interface,
Start the Collector Installation Wizard:
- In the KUMA web interface, in the Resources section, click Add event source.
- In the KUMA web interface in the Resources → Collectors section click Add collector.
As a result of completing the steps of the Wizard, a collector service is created in the KUMA web interface.
A resource set for a collector includes the following resources:
- Connector
- Normalizer (at least one)
- Filters (if required)
- Aggregation rules (if required)
- Enrichment rules (if required)
- Destinations (normally two are defined for sending events to the correlator and storage)
These resources can be prepared in advance, or you can create them while the Installation Wizard is running.
If you specified deploy_example_services: true parameter when installing KUMA and want to use the [Example] WEC Collector predefined resource set, make sure that a unique port is specified in the URL field in the collector settings in the Transport section.
Actions on the KUMA Collector Server
Install the collector on the server that you intend to use to receive events. On this server, you must run the command displayed at the last step of the Installation Wizard. When installing, you must specify the identifier automatically assigned to the service in the KUMA web interface, as well as the port used for communication.
Testing the installation
After creating a collector, you are advised to make sure that it is working correctly.
Starting the Collector Installation Wizard
A collector consists of two parts: one part is created inside the KUMA web interface, and the other part is installed on the network infrastructure server intended for receiving events. The Installation Wizard creates the first part of the collector.
To start the Collector Installation Wizard:
- In the KUMA web interface, in the Resources section, click Add event source.
- In the KUMA web interface in the Resources → Collectors section click Add collector.
Follow the instructions of the Wizard.
Aside from the first and last steps of the Wizard, the steps of the Wizard can be performed in any order. You can switch between steps by using the Next and Previous buttons, as well as by clicking the names of the steps in the left side of the window.
After the Wizard completes, a resource set for a collector is created in the KUMA web interface under Resources → Collectors, and a collector service is added under Resources → Active services.
Step 1. Connect event sources
This is a required step of the Installation Wizard. At this step, you specify the main settings of the collector: its name and the tenant that will own it.
To specify the basic settings of the collector:
- In the Name field, enter a unique name for the service you are creating. The name must contain from 1 to 128 Unicode characters.
When certain types of collectors are created, agents named "agent: <Collector name>, auto created" are also automatically created together with the collectors. If this type of agent was previously created and has not been deleted, it will be impossible to create a collector named <Collector name>. If this is the case, you will have to either specify a different name for the collector or delete the previously created agent.
- In the Tenant drop-down list, select the tenant that will own the collector. The tenant selection determines what resources will be available when the collector is created.
If you return to this window from another subsequent step of the Installation Wizard and select another tenant, you will have to manually edit all the resources that you have added to the service. Only resources from the selected tenant and shared tenant can be added to the service.
- If required, specify the number of processes that the service can run concurrently in the Workers field. By default, the number of worker processes is the same as the number of vCPUs on the server where the service is installed.
- If necessary, use the Debug drop-down list to enable logging of service operations.
- You can optionally add up to 256 Unicode characters describing the service in the Description field.
The main settings of the collector are specified. Proceed to the next step of the Installation Wizard.
Step 2. Transportation
This is a required step of the Installation Wizard. On the Transport tab of the Installation Wizard, select or create a connector resource with the settings indicating from where the collector service should receive events.
To add an existing connector to a resource set:
Select the name of the required connector from the Connector drop-down list.
The Transport tab of the Installation Wizard will display the settings of the selected connector. You can open the selected resource for editing in a new browser tab using the button.
To create a new connector:
- Select Create new from the Connector drop-down list.
- In the Type drop-down list, select the connector type and define its settings on the Basic settings and Advanced settings tabs. The available settings depend on the selected type of connector:
- internal
- tcp
- udp
- netflow
- nats
- kafka
- http
- sql
- file
- ftp
- nfs
- wmi
- wec
If you change the kind of connector from wec to wmi in an already created collector, there may be errors receiving events. If you want to make this type of change to the connector kind, you must create a new WMI connector with the necessary settings and connect it to the collector instead of the WEC connector.
- snmp
When using the tcp or upd connector type at the normalization stage, IP addresses of the assets from which the events were received will be written in the DeviceAddress event field if it is empty.
When using a wmi or wec connector, agents will be automatically created for receiving Windows events.
It is recommended to use the default encoding (UTF-8), and to apply other settings only if bit characters are received in the fields of events.
The connector resource has been added to the resource set of the collector. The created resource is only available in this resource set and is not displayed in the web interface Resources → Connectors section.
Proceed to the next step of the Installation Wizard.
Step 3. Event parsing
This is a required step of the Installation Wizard. On the Event parsing tab of the Installation Wizard, select or create a normalizer resource whose settings will define the rules for converting raw events into normalized events. You can add more than one normalizer to implement complex processing logic.
When creating a new normalizer in the Installation Wizard, it will be saved in the set of resources for the collector and cannot be used in other collectors. If you want to use the same normalizer in different services, it is recommended to create it as an individual resource.
If you modify or delete conversions in the normalizer resource within the existing set of resources for the collector, the changes in the normalizer are not saved and the resource may become corrupted. If you need to modify conversions in a normalizer that is already part of a service, the changes must be made directly to the resource under Resources → Normalizers in the web interface.
Adding a normalizer
To add an existing normalizer to a resource set:
- Click the Add event parsing button.
The Event parsing window will open with the normalizer settings and an active Normalization scheme tab.
- In the Normalizer drop-down list, select the required normalizer.
The Event parsing window will display the parameters of the selected normalizer. You can open the selected resource for editing in a new browser tab using the
button. - Click OK.
The normalizer is displayed as a dark circle on the Event parsing tab of the Installation Wizard. Clicking on the circle will open the normalizer options for editing. When you hover over the circle, a plus sign is displayed: click on it to add more normalizers (see below).
To create a new normalizer:
- Select Create new from the Normalizer drop-down list.
The Event parsing window will open with the normalizer settings and an active Normalization scheme tab.
- In the Name field, enter a unique name for the normalizer. The name must contain from 1 to 128 Unicode characters.
- In the Parsing method drop-down list, select the type of events to receive. Depending on your choice, you can use the preconfigured rules for matching event fields or set your own rules. When you select some parsing methods, additional parameter fields required for filling in may become available.
Available parsing methods:
- json
- cef
- regexp
This parsing method is used to create custom rules for processing JSON data.
In the Normalization parameter block field, add a regular expression (RE2 syntax) with named capture groups. The name of a group and its value will be interpreted as the field and the value of the raw event, which can be converted into an event field in KUMA format.
To add event handling rules:
- Copy an example of the data you want to process to the Event examples field. This is an optional but recommended step.
- In the Normalization parameter block field add a regular expression with named capture groups in RE2 syntax, for example "(?P<name>regexp)".
You can add multiple regular expressions by using the Add regular expression button. If you need to remove the regular expression, use the
button. - Click the Copy field names to the mapping table button.
Capture group names are displayed in the KUMA field column of the Mapping table. Now you can select the corresponding KUMA field in the column next to each capture group. Otherwise, if you named the capture groups in accordance with the CEF format, you can use the automatic CEF mapping by selecting the Use CEF syntax for normalization check box.
Event handling rules were added.
- syslog
- csv
- kv
- xml
- netflow5
- netflow9
- ipfix
- sql—this method becomes available only when using a sql type connector.
- In the Keep raw log drop-down list, specify whether the original raw event should be stored in the newly created normalized event. Available values:
- Never—do not save the raw event This is the default setting.
- Only errors—save the raw event in the
Rawfield of the normalized event if errors occurred when parsing it. This value is convenient to use when debugging a service. In this case, every time an event has a non-emptyRawfield, you know there was a problem. - Always—always save the raw event in the
Rawfield of the normalized event.
- In the Save extra fields drop-down list, choose whether you want to store the raw event fields in the normalized event if no mapping rules have been configured for them (see below). The data is stored in the Extra event field. By default, fields are not saved.
- Copy an example of the data you want to process to the Event examples field. This is an optional but recommended step.
Event examples can also be loaded from a TSV, CSV, or TXT file by using the Load from file button.
- Configure the mapping of the raw event fields to event fields in KUMA format In the Mapping table:
- In the Source column, provide the name of the raw event field that you want to convert into the KUMA event field.
Clicking the
button next to the field names in the Source column opens the Conversion window, in which you can use the Add conversion button to create rules for modifying the original data before they are written to the KUMA event fields. - In the KUMA field column, select the required KUMA event field from the drop-down list. You can search for fields by entering their names in the field.
- If the name of the KUMA event field selected at the previous step begins with DeviceCustom*, you can add a unique custom label in the Label field if necessary.
New table rows can be added by using the Add row button. Rows can be deleted individually using the
button or all at once using the Clear all button.If you have loaded data into the Event examples field, the table will have an Examples column containing examples of values carried over from the raw event field to the KUMA event field.
- In the Source column, provide the name of the raw event field that you want to convert into the KUMA event field.
- Click OK.
The normalizer is displayed as a dark circle on the Event parsing tab of the Installation Wizard. Clicking on the circle will open the normalizer options for editing. When you hover over the circle, a plus sign is displayed: click on it to add more normalizers (see below).
Enriching normalized events with additional data
You can add additional data to the newly created normalized events by creating enrichment rules in the normalizer similar to those in enrichment rule resources. These enrichment rules are stored in the normalizer resource where they were created. There can be more than one enrichment rule.
To add enrichment rules to the normalizer:
- Select the normalizer and go to the Enrichment tab in the Event parsing window.
- Click the Add enrichment button.
The enrichment rule parameter block appears. Close the parameter block using the
button. - Select the enrichment type from the Source kind drop-down list. Depending on the selected type, you may see advanced settings that will also need to be completed.
Available Enrichment rule source types:
- constant
- dictionary
- event
This type of enrichment is used when you need to write a value from another event field to the current event field.
When this type is selected in the Source field drop-down list, you must select the event field from where the value will be copied to the target field. Clicking the
button opens the Conversion window in which you can, using the Add conversion button, create rules for modifying the original data before writing them to the KUMA event fields. - template
- In the Target field drop-down list, select the KUMA event field to which you want to write the data.
- Click OK.
Enrichment rules are added to the normalizer, and the Event parsing window is closed.
Creating a structure of normalizers
You can create several extra normalizers within a normalizer. This allows you to customize complex event handling logic.
The sequence in which normalizers are created matters: events are processed sequentially, and their path is shown using arrows.
To create an extra normalizer:
- Create the initial normalizer (see above).
The created normalizer will be displayed in the window as a dark circle.
- Hover over the initial normalizer and click the plus sign button that appears.
- In the Add normalizer to normalization scheme window, specify the conditions under which the data will be sent to the extra normalizer:
- If you want to send only events with specific fields to the extra normalizer, list them in the Fields to pass into normalizer field.
- If you want to send only events in which certain fields have been assigned specific values to the extra normalizer, specify the name of the event field in the Use normalizer for events with specific event field values field and the value that should match it in the Condition value field.
The data processed by these conditions can be preconverted by clicking the
button. This opens the Conversion window, in which you can use the Add conversion button to create rules for modifying the original data before it is written to the KUMA event fields. - Click OK.
This will open the Event parsing window, in which you can configure the rules for processing events as you did in the initial normalizer (see above). The Keep raw log parameter is not available. The Event examples field displays the values specified when the initial normalizer was created.
- Specify the extra normalizer settings similar to the initial normalizer
- Click OK.
The extra normalizer is displayed as a dark block that indicates the conditions under which this normalizer will be used. The conditions can be changed by moving your mouse cursor over the extra normalizer and clicking the button showing the pencil image. If you hover the mouse pointer over the extra normalizer, a plus button appears, which you can use to create a new extra normalizer. To delete a normalizer, use the button with the trash icon.
Proceed to the next step of the Installation Wizard.
Step 4. Filtering events
This is an optional step of the Installation Wizard. The Event filtering tab of the Installation Wizard allows you to select or create a filter resource whose settings specify the conditions for filtering out irrelevant events. You can add more than one filter to a collector. You can swap the filters by dragging them by the icon as well as delete them. Filters are combined by the AND operator.
To add an existing filter to a collector resource set,
Click the Add filter button and select the required filter from the Filter drop-down menu.
To add a new filter to the collector resource set:
- Click the Add filter button and select Create new from the Filter drop-down menu.
- If you want to keep the filter as a separate resource, set the Save filter toggle switch. This can be useful if you decide to reuse the same filter across different services. The toggle switch is turned off by default.
- If you toggle the Save filter switch on, enter a name for the created filter resource in the Name field. The name must contain from 1 to 128 Unicode characters.
- In the Conditions section, specify the conditions that must be met by the filtered events:
- The Add condition button is used to add filtering conditions. You can select two values (two operands, left and right) and assign the operation you want to perform with the selected values. The result of the operation is either True or False.
- In the operator drop-down list, select the function to be performed by the filter.
In this drop-down list, you can select the do not match case check box if the operator should ignore the case of values. This check box is ignored if the InSubnet, InActiveList, InCategory, and InActiveDirectoryGroup operators are selected. This check box is cleared by default.
- In the Left operand and Right operand drop-down lists, select where the data to be filtered will come from. As a result of the selection, Advanced settings will appear. Use them to determine the exact value that will be passed to the filter. For example, when choosing active list you will need to specify the name of the active list, the entry key, and the entry key field.
- You can use the If drop-down list to choose whether you need to create a negative filter condition.
Conditions can be deleted using the
button. - In the operator drop-down list, select the function to be performed by the filter.
- The Add group button is used to add groups of conditions. Operator AND can be switched between AND, OR, and NOT values.
A condition group can be deleted using the
button. - Using the Add filter button you can add existing filter resources selected in the Select filter drop-down list to the conditions. You can navigate to a nested filter resource using the button.
A nested filter can be deleted using the
button.
- The Add condition button is used to add filtering conditions. You can select two values (two operands, left and right) and assign the operation you want to perform with the selected values. The result of the operation is either True or False.
The filter has been added.
Proceed to the next step of the Installation Wizard.
Page top
Step 5. Event aggregation
This is an optional step of the Installation Wizard. The Event aggregation tab of the Installation Wizard allows you to select or create an aggregation rule resource whose settings specify the conditions for aggregating events of the same type. More than one aggregation rule can be added to a collector.
To add an existing aggregation rule to a set of collector resources:
Click the Add aggregation rule button and select the required resource from the Aggregation rule drop-down menu.
To add a new aggregation rule to a set of collector resources:
- Click the Add aggregation rule button and select Create new from the Aggregation rule drop-down menu.
- Enter the name of the newly created filter in the Name field. The name must contain from 1 to 128 Unicode characters.
- In the Threshold field, specify the number of events that should be received before the aggregation rule triggers and the events are aggregated. The default value is 100.
- In the Triggered rule lifetime field, indicate how long the program should receive events for aggregation. On the timeout, the aggregation rule is triggered and a new event is created. The default value is 60.
- In the Identical fields section, use the Add field button to select the fields that will be used to identify the same types of events. Selected events can be deleted using the buttons with a cross icon.
- In the Unique fields section, you can use the Add field button to select the fields that will disqualify events from aggregation even if they have fields listed in the Identical fields section. Selected events can be deleted using the buttons with a cross icon.
- In the Sum fields section, you can use the Add field button to select the fields whose values will be summed during the aggregation process. Selected events can be deleted using the buttons with a cross icon.
- In the Filter section, you can specify the conditions to define events that will be processed by this resource. You can select an existing filter resource from the drop-down list, or select Create new to create a new filter.
Creating a filter in resources
- In the Filter drop-down list, select Create new.
- If you want to keep the filter as a separate resource, set the Save filter toggle switch.
In this case, you will be able to use the created filter in various services.
The toggle switch is turned off by default.
- If you toggle the Save filter switch on, enter a name for the created filter resource in the Name field. The name must contain from 1 to 128 Unicode characters.
- In the Conditions settings block, specify the conditions that the events must meet:
- Click the Add condition button.
- In the Left operand and Right operand drop-down lists, specify the search parameters.
Depending on the data source selected in the Right operand field, you may see fields of additional parameters that you need to use to define the value that will be passed to the filter. For example, when choosing active list you will need to specify the name of the active list, the entry key, and the entry key field.
- In the operator drop-down list, select the relevant operator.
- If necessary, select the do not match case check box. When this check box is selected, the operator ignores the case of the values.
The selection of this check box does not apply to the InSubnet, InActiveList, InCategory or InActiveDirectoryGroup operators.
This check box is cleared by default.
- If you want to add a negative condition, select If not from the If drop-down list.
- You can add multiple conditions or a group of conditions.
- If you have added multiple conditions or groups of conditions, choose a search condition (and, or, not) by clicking the AND button.
- If you want to add existing filters that are selected from the Select filter drop-down list, click the Add filter button.
You can view the nested filter settings by clicking the
button.
Aggregation rule added. You can delete it using the button.
Proceed to the next step of the Installation Wizard.
Page top
Step 6. Event enrichment
This is an optional step of the Installation Wizard. On the Event enrichment tab of the Installation Wizard, you can specify which data from which sources should be added to events processed by the collector. You can enrich events with data received using LDAP or via enrichment rules.
LDAP enrichment
To enable enrichment using LDAP:
- Click Add enrichment with LDAP data.
This opens the settings block for LDAP enrichment.
- In the LDAP accounts mapping settings block, use the New domain button to specify the domain of the user accounts. You can specify multiple domains.
- In the LDAP enrichment mapping table, define the rules for mapping KUMA fields to LDAP attributes:
- In the KUMA field column, indicate the KUMA event field which data should be compared to LDAP attribute.
- In the column, the LDAP attribute with which you want to compare the KUMA event field.
- In the KUMA event field to write to column, specify in which field of the KUMA event the ID of the user account imported from LDAP should be placed if the mapping was successful.
You can use the Add row button to add a string to the table, and can use the
button to remove a string. You can use the Apply default mapping button to fill the mapping table with standard values.
Event enrichment rules for data received from LDAP were added to the group of resources for the collector.
If you add an enrichment to an existing collector using LDAP, then you must stop and restart the service.
Rule-based enrichment
There can be more than one enrichment rule. You can add them by clicking the Add enrichment button and can remove them by clicking the button. You can use existing resources of enrichment rules or create rules directly in the Installation Wizard.
To add an existing enrichment rule to a set of resources:
- Click Add enrichment.
This opens the response rule settings block.
- In the Enrichment rule drop-down list, select the relevant resource.
The enrichment rule is added to the set of resources for the collector.
To create a new enrichment rule in a set of resources:
- Click Add enrichment.
This opens the response rule settings block.
- In the Enrichment rule drop-down list, select Create new.
- In the Source kind drop-down list, select the source of data for enrichment and define its corresponding settings:
- constant
- dictionary
- event
- template
- dns
- cybertrace
This type of enrichment is used to add information from CyberTrace data streams to event fields.
Available settings:
- URL (required)—in this field, you can specify the URL of a CyberTrace server to which you want to send requests.
- Number of connections—maximum number of connections to the CyberTrace server that can be simultaneously established by KUMA. By default, this value is equal to the number of vCPUs of the KUMA Core server.
- RPS—maximum number of requests sent to the server per second. The default value is
1000. - Timeout—amount of time to wait for a response from the CyberTrace server, in seconds. The default value is
30. - Mapping (required)—this settings block contains the mapping table for mapping KUMA event fields to CyberTrace indicator types. The KUMA field column shows the names of KUMA event fields, and the CyberTrace indicator column shows the types of CyberTrace indicators.
Available types of CyberTrace indicators:
- ip
- url
- hash
In the mapping table, you must provide at least one string. You can use the Add row button to add a string, and can use the
button to remove a string.
- In the Target field drop-down list, select the KUMA event field to which you want to write the data.
- Use the Debug drop-down list to indicate whether or not to enable logging of service operations. Logging is disabled by default.
- In the Filter section, you can specify conditions to identify events that will be processed by the enrichment rule resource. You can select an existing filter resource from the drop-down list, or select Create new to create a new filter.
Creating a filter in resources
- In the Filter drop-down list, select Create new.
- If you want to keep the filter as a separate resource, set the Save filter toggle switch.
In this case, you will be able to use the created filter in various services.
The toggle switch is turned off by default.
- If you toggle the Save filter switch on, enter a name for the created filter resource in the Name field. The name must contain from 1 to 128 Unicode characters.
- In the Conditions settings block, specify the conditions that the events must meet:
- Click the Add condition button.
- In the Left operand and Right operand drop-down lists, specify the search parameters.
Depending on the data source selected in the Right operand field, you may see fields of additional parameters that you need to use to define the value that will be passed to the filter. For example, when choosing active list you will need to specify the name of the active list, the entry key, and the entry key field.
- In the operator drop-down list, select the relevant operator.
- If necessary, select the do not match case check box. When this check box is selected, the operator ignores the case of the values.
The selection of this check box does not apply to the InSubnet, InActiveList, InCategory or InActiveDirectoryGroup operators.
This check box is cleared by default.
- If you want to add a negative condition, select If not from the If drop-down list.
- You can add multiple conditions or a group of conditions.
- If you have added multiple conditions or groups of conditions, choose a search condition (and, or, not) by clicking the AND button.
- If you want to add existing filters that are selected from the Select filter drop-down list, click the Add filter button.
You can view the nested filter settings by clicking the
button.
The new enrichment rule was added to the set of resources for the collector.
Proceed to the next step of the Installation Wizard.
Page top
Step 7. Routing
This is an optional step of the Installation Wizard. On the Routing tab of the Installation Wizard, you can select or create destination resources with parameters indicating where the events processed by the collector should be redirected. Typically, events from the collector are routed to two points: to the correlator to analyze and search for threats; and to the storage, both for storage and so that processed events can be viewed later. Events can be sent to other locations as needed. There can be more than one destination point.
To add an existing destination to a collector resource set:
- In the Add destination drop-down list, select the type of destination resource you want to add:
- Select Storage if you want to configure forwarding of processed events to the storage.
- Select Correlator if you want to configure forwarding of processed events to a correlator.
- Select Other if you want to send events to other locations.
This type of resource includes correlator and storage services that were created in previous versions of the program.
The Add destination window opens where you can specify parameters for events forwarding.
- In the Destination drop-down list, select the necessary destination.
The window name changes to Edit destination, and it displays the settings of the selected resource. The resource can be opened for editing in a new browser tab using the
button. - Click Save.
The selected destination is displayed on the Installation Wizard tab. A destination resource can be removed from the resource set by selecting it and clicking Delete in the opened window.
To add a new destination resource to a collector resource set:
- In the Add destination drop-down list, select the type of destination resource you want to add:
- Select Storage if you want to configure forwarding of processed events to the storage.
- Select Correlator if you want to configure forwarding of processed events to a correlator.
- Select Other if you want to send events to other locations.
This type of resource includes correlator and storage services that were created in previous versions of the program.
The Add destination window opens where you can specify parameters for events forwarding.
- Specify the settings on the Basic settings tab:
- In the Destination drop-down list, select Create new.
- In the Name field, enter a unique name for the destination resource. The name must contain from 1 to 128 Unicode characters.
- Use the Disabled toggle button to specify whether events will be sent to this destination. By default, sending events is enabled.
- Select the Type for the destination resource:
- Select storage if you want to configure forwarding of processed events to the storage.
- Select correlator if you want to configure forwarding of processed events to a correlator.
- Select nats, tcp, http, kafka, or file if you want to configure sending events to other locations.
- Specify the URL to which events should be sent in the hostname:<API port> format.
If your KUMA license includes the High Level Availability module, you can specify multiple destination addresses by using the URL button for all types except nats, file, and diode.
If you have selected storage or correlator as the destination type, the URL field can be populated automatically using the Copy service URL drop-down list that displays active services of the selected type.
- For the nats and kafka types, use the Topic field to specify which topic the data should be written to. The topic name must contain from 1 to 255 Unicode characters.
- If required, define the settings on the Advanced settings tab. The available settings vary based on the selected destination resource type.
- Compression is a drop-down list where you can enable Snappy compression. By default, compression is disabled.
- Proxy is a drop-down list for proxy server resource selection.
- Buffer size field is used to set buffer size (in bytes) for the destination resource. The default value is 1 MB, and the maximum value is 64 MB.
- Timeout field is used to set the timeout (in seconds) for another service or component response. The default value is
30. - Disk buffer size limit field is used to specify the size of the disk buffer in bytes. The default size is 10 GB.
- Storage ID is a NATS storage identifier.
- TLS mode is a drop-down list where you can specify the conditions for using TLS encryption:
- Disabled (default)—do not use TLS encryption.
- Enabled—encryption is enabled, but without verification.
- With verification—use encryption with verification that the certificate was signed with the KUMA root certificate. The root certificate and key of KUMA are created automatically during program installation and are stored on the KUMA Core server in the folder /opt/kaspersky/kuma/core/certificates/.
When using TLS, it is impossible to specify an IP address as a URL.
- URL selection policy is a drop-down list in which you can select a method for determining which URL to send events to if several URLs have been specified:
- Any. Events are sent to one of the available URLs as long as this URL receives events. If the connection is broken (for example, the receiving node is disconnected) a different URL will be selected as the events destination.
- Prefer first. Events are sent to the first URL in the list of added addresses. If it becomes unavailable, events are sent to the next available node in sequence. When the first URL becomes available again, events start to be sent to it again.
- Round robin. Packets with events will be evenly distributed among available URLs from the list. Because packets are sent either on a destination buffer overflow or on the flush timer, this URL selection policy does not guarantee an equal distribution of events to destinations.
- Delimiter is used to specify the character delimiting the events. By default,
\nis used. - Path—the file path if the file destination type is selected.
- Buffer flush interval—this field is used to set the time interval (in seconds) at which the data is sent to the destination. The default value is
100. - Workers—this field is used to set the number of services processing the queue. By default, this value is equal to the number of vCPUs of the KUMA Core server.
- You can set health checks using the Health check path and Health check timeout fields. You can also disable health checks by selecting the Health Check Disabled check box.
- Debug—a drop-down list where you can specify whether resource logging should be enabled. By default it is Disabled.
- The Disk buffer disabled drop-down list is used to enable or disable the use of a disk buffer. By default, the disk buffer is disabled.
- In the Filter section, you can specify the conditions to define events that will be processed by this resource. You can select an existing filter resource from the drop-down list, or select Create new to create a new filter.
Creating a filter in resources
- In the Filter drop-down list, select Create new.
- If you want to keep the filter as a separate resource, set the Save filter toggle switch.
In this case, you will be able to use the created filter in various services.
The toggle switch is turned off by default.
- If you toggle the Save filter switch on, enter a name for the created filter resource in the Name field. The name must contain from 1 to 128 Unicode characters.
- In the Conditions settings block, specify the conditions that the events must meet:
- Click the Add condition button.
- In the Left operand and Right operand drop-down lists, specify the search parameters.
Depending on the data source selected in the Right operand field, you may see fields of additional parameters that you need to use to define the value that will be passed to the filter. For example, when choosing active list you will need to specify the name of the active list, the entry key, and the entry key field.
- In the operator drop-down list, select the relevant operator.
- If necessary, select the do not match case check box. When this check box is selected, the operator ignores the case of the values.
The selection of this check box does not apply to the InSubnet, InActiveList, InCategory or InActiveDirectoryGroup operators.
This check box is cleared by default.
- If you want to add a negative condition, select If not from the If drop-down list.
- You can add multiple conditions or a group of conditions.
- If you have added multiple conditions or groups of conditions, choose a search condition (and, or, not) by clicking the AND button.
- If you want to add existing filters that are selected from the Select filter drop-down list, click the Add filter button.
You can view the nested filter settings by clicking the
button.
- Click Save.
The created destination resource is displayed on the Installation Wizard tab. A destination resource can be removed from the resource set by selecting it and clicking Delete in the opened window.
Proceed to the next step of the Installation Wizard.
Step 8. Setup validation
This is the required, final step of the Installation Wizard. In this step, KUMA creates a set of service resources, and based on this set, the Services are created automatically.
- The set of resources for the collector is displayed under Resources → Collectors. It can be used to create new collector services. When this set of resources changes, all services that operate based on this set of resources will start using the new parameters after the services restart. To do so, you can use the Save and restart services and Save and reload services buttons.
A set of resources can be modified, copied, moved from one folder to another, deleted, imported, and exported, like other resources.
- Services are displayed in Resources → Active services. The services created using the Installation Wizard perform functions inside the KUMA program. To communicate with external parts of the network infrastructure, you need to install similar external services on the servers and assets intended for them. For example, an external collector service should be installed on a server intended as an events recipient, external storage services should be installed on servers that have a deployed ClickHouse service, and external agent services should be installed on the Windows assets that must both receive and forward Windows events.
To finish the Installation Wizard:
- Click Create and save service.
The Setup validation tab of the Installation Wizard displays a table of services created based on the set of resources selected in the Installation Wizard. The lower part of the window shows examples of commands that you must use to install external equivalents of these services on their intended servers and assets.
For example:
/opt/kaspersky/kuma/kuma collector --core https://kuma-example:<port used for communication with the KUMA Core> --id <service ID> --api.port <port used for communication with the service> --install
The port for communication with the KUMA Core, the service ID, and the port for communication with the service are added to the command automatically. You should also ensure the network connectivity of the KUMA system and open the ports used by its components if necessary.
- Close the Wizard by clicking Save collector.
The collector service is created in KUMA. Now you will install a similar service on the server intended for receiving events.
If a wmi or wec connector was selected for collectors, you must also install the automatically created KUMA agents.
Page top
Installing a collector in a KUMA network infrastructure
A collector consists of two parts: one part is created inside the KUMA web interface, and the other part is installed on the network infrastructure server intended for receiving events. The second part of the collector is installed in the network infrastructure.
To install a collector:
- Log in to the server where you want to install the service.
- Execute the following command:
sudo /opt/kaspersky/kuma/kuma collector --core https://<KUMA Core server FQDN>:<port used by KUMA Core server for internal communication (port 7210 by default)> --id <service ID copied from the KUMA web interface> --api.port <port used for communication with the installed component> --installExample:
sudo /opt/kaspersky/kuma/kuma collector --core https://kuma.example.com:7210 --id XXXX --api.port YYYY --installYou can copy the collector installation command at the last step of the Installation Wizard. It automatically specifies the address and port of the KUMA Core server, the identifier of the collector to be installed, and the port that the collector uses for communication. Before installation, ensure the network connectivity of KUMA components.
When deploying several KUMA services on the same host, during the installation process you must specify unique ports for each component using the
--api.port <port>parameter. The following setting values are used by default:--api.port 7221.
The collector is installed. You can use it to receive data from an event source and forward it for processing.
Page top
Validating collector installation
To verify that the collector is ready to receive events:
- In the KUMA web interface, open Resources → Active services.
- Make sure that the collector you installed has the green status.
If the collector is installed correctly and you are sure that data is coming from the event source, the table should display events when you search for events associated with the collector.
To check for normalization errors using the Events section of the KUMA web interface:
- Make sure that the Collector service is running.
- Make sure that the event source is providing events to the KUMA.
- Make sure that you selected Only errors in the Keep raw log drop-down list of the Normalizer resource in the Resources section of the KUMA web interface.
- In the Events section of KUMA, search for events with the following parameters:
ServiceID = <ID of the collector to be checked>Raw != ""
If any events are found with this search, it means that there are normalization errors and they should be investigated.
To check for normalization errors using the Grafana Dashboard:
- Make sure that the Collector service is running.
- Make sure that the event source is providing events to the KUMA.
- Open the Metrics section and follow the KUMA Collectors link.
- See if the Errors section of the Normalization widget displays any errors.
If there are any errors, it means that there are normalization errors and they should be investigated.
For WEC and WMI collectors, you must ensure that unique ports are used to connect to their agents. This port is specified in the Transport section of Collector Installation Wizard.
Page top
Creating a correlator
A correlator consists of two parts: one part is created inside the KUMA web interface, and the other part is installed on the network infrastructure server intended for processing events.
Actions in the KUMA web interface.
A correlator is created in the KUMA web interface by using the Installation Wizard, which combines the necessary resources into a set of resources for the correlator. Upon completion of the Wizard, the service is automatically created based on this set of resources.
To create a correlator in the KUMA web interface:
Start the Correlator Installation Wizard:
- In the KUMA web interface, under Resources, click Add correlator.
- In the KUMA web interface, under Resources → Correlators, click Add correlator.
As a result of completing the steps of the Wizard, a correlator service is created in the KUMA web interface.
A resource set for a correlator includes the following resources:
- Correlation rules
- Enrichment rules (if required)
- Response rules (if required)
- Destinations (normally one for sending events to a storage)
These resources can be prepared in advance, or you can create them while the Installation Wizard is running.
Actions on the KUMA correlator server
If you are installing the correlator on a server that you intend to use for event processing, you need to run the command displayed at the last step of the Installation Wizard on the server. When installing, you must specify the identifier automatically assigned to the service in the KUMA web interface, as well as the port used for communication.
Testing the installation
After creating a correlator, it is recommended to make sure that it is working correctly.
Starting the Correlator Installation Wizard
A correlator consists of two parts: one part is created inside the KUMA web interface, and the other part is installed on the network infrastructure server intended for processing events. The Installation Wizard creates the first part of the correlator.
To start the Correlator Installation Wizard:
- In the KUMA web interface, under Resources, click Add correlator.
- In the KUMA web interface, under Resources → Correlators, click Add correlator.
Follow the instructions of the Wizard.
Aside from the first and last steps of the Wizard, the steps of the Wizard can be performed in any order. You can switch between steps by using the Next and Previous buttons, as well as by clicking the names of the steps in the left side of the window.
After the Wizard completes, a resource set for the correlator is created in the KUMA web interface under Resources → Correlators, and a correlator service is added under Resources → Active services.
Step 1. General correlator settings
This is a required step of the Installation Wizard. At this step, you specify the main settings of the correlator: the correlator name and the tenant that will own it.
To define the main settings of the correlator:
- In the Name field, enter a unique name for the service you are creating. The name must contain from 1 to 128 Unicode characters.
- In the Tenant drop-down list, select the tenant that will own the correlator. The tenant selection determines what resources will be available when the collector is created.
If you return to this window from another subsequent step of the Installation Wizard and select another tenant, you will have to manually edit all the resources that you have added to the service. Only resources from the selected tenant and shared tenant can be added to the service.
- If required, specify the number of processes that the service can run concurrently in the Workers field. By default, the number of worker processes is the same as the number of vCPUs on the server where the service is installed.
- If necessary, use the Debug drop-down list to enable logging of service operations.
- You can optionally add up to 256 Unicode characters describing the service in the Description field.
The main settings of the correlator are defined. Proceed to the next step of the Installation Wizard.
Step 2. Correlation
This is an optional but recommended step of the Installation Wizard. On the Correlation tab of the Installation Wizard, you should select or create resources of correlation rules. These resources define the sequences of events that indicate security-related incidents. When these sequences are detected, the correlator creates a correlation event and an alert.
Correlation rules that are added to the set of resources for the correlator are displayed in the table with the following columns:
- Correlation rules—name of the correlation rule resource.
- Type—type of correlation rule: standard, simple, operational. The table can be filtered based on the values of this column by clicking the column header and selecting the relevant values.
- Actions—list of actions that will be performed by the correlator when the correlation rule is triggered. These actions are indicated in the correlation rule settings. The table can be filtered based on the values of this column by clicking the column header and selecting the relevant values.
You can use the Search field to search for a correlation rule. Added correlation rules can be removed from the set of resources by selecting the relevant rules and clicking Delete.
When a correlation rule is selected, a window opens to show its settings. The resource settings can be edited and then saved by clicking the Save button. If you click Delete in this window, the correlation rule is unlinked from the set of resources.
To link the existing correlation rules to the set of resources for the correlator:
- Click Link.
The resource selection window opens.
- Select the relevant correlation rules and click OK.
The correlation rules will be linked to the set of resources for the correlator and will be displayed in the rules table.
To create a new correlation rule in a set of resources for a correlator:
- Click Add.
The correlation rule creation window opens.
- Specify the correlation rule settings and click Save.
The correlation rule will be created and linked to the set of resources for the correlator. It is displayed in the correlation rules table and in the list of resources under Resources → Correlation rules.
Proceed to the next step of the Installation Wizard.
Page top
Step 3. Enrichment
This is an optional step of the Installation Wizard. On the Enrichment tab of the Installation Wizard, you can select or create a resource for enrichment rules and indicate which data from which sources should be added to correlation events created by the correlator. There can be more than one enrichment rule. You can add them by clicking the Add button and can remove them by clicking the button.
To add an existing enrichment rule to a set of resources:
- Click Add.
This opens the enrichment rules settings block.
- In the Enrichment rule drop-down list, select the relevant resource.
The enrichment rule is added to the set of resources for the correlator.
To create a new enrichment rule in a set of resources:
- Click Add.
This opens the enrichment rules settings block.
- In the Enrichment rule drop-down list, select Create new.
- In the Source kind drop-down list, select the source of data for enrichment and define its corresponding settings:
- constant
- dictionary
- event
- template
- dns
- cybertrace
This type of enrichment is used to add information from CyberTrace data streams to event fields.
Available settings:
- URL (required)—in this field, you can specify the URL of a CyberTrace server to which you want to send requests.
- Number of connections—maximum number of connections to the CyberTrace server that can be simultaneously established by KUMA. By default, this value is equal to the number of vCPUs of the KUMA Core server.
- RPS—maximum number of requests sent to the server per second. The default value is
1000. - Timeout—amount of time to wait for a response from the CyberTrace server, in seconds. The default value is
30. - Mapping (required)—this settings block contains the mapping table for mapping KUMA event fields to CyberTrace indicator types. The KUMA field column shows the names of KUMA event fields, and the CyberTrace indicator column shows the types of CyberTrace indicators.
Available types of CyberTrace indicators:
- ip
- url
- hash
In the mapping table, you must provide at least one string. You can use the Add row button to add a string, and can use the
button to remove a string.
- In the Target field drop-down list, select the KUMA event field to which you want to write the data.
- Use the Debug drop-down list to indicate whether or not to enable logging of service operations. Logging is disabled by default.
- In the Filter section, you can specify conditions to identify events that will be processed by the enrichment rule resource. You can select an existing filter resource from the drop-down list, or select Create new to create a new filter.
Creating a filter in resources
- In the Filter drop-down list, select Create new.
- If you want to keep the filter as a separate resource, set the Save filter toggle switch.
In this case, you will be able to use the created filter in various services.
The toggle switch is turned off by default.
- If you toggle the Save filter switch on, enter a name for the created filter resource in the Name field. The name must contain from 1 to 128 Unicode characters.
- In the Conditions settings block, specify the conditions that the events must meet:
- Click the Add condition button.
- In the Left operand and Right operand drop-down lists, specify the search parameters.
Depending on the data source selected in the Right operand field, you may see fields of additional parameters that you need to use to define the value that will be passed to the filter. For example, when choosing active list you will need to specify the name of the active list, the entry key, and the entry key field.
- In the operator drop-down list, select the relevant operator.
- If necessary, select the do not match case check box. When this check box is selected, the operator ignores the case of the values.
The selection of this check box does not apply to the InSubnet, InActiveList, InCategory or InActiveDirectoryGroup operators.
This check box is cleared by default.
- If you want to add a negative condition, select If not from the If drop-down list.
- You can add multiple conditions or a group of conditions.
- If you have added multiple conditions or groups of conditions, choose a search condition (and, or, not) by clicking the AND button.
- If you want to add existing filters that are selected from the Select filter drop-down list, click the Add filter button.
You can view the nested filter settings by clicking the
button.
The new enrichment rule was added to the set of resources for the correlator.
Proceed to the next step of the Installation Wizard.
Step 4. Response
This is an optional step of the Installation Wizard. On the Response tab of the Installation Wizard, you can select or create a resource for response rules and indicate which actions must be performed when the correlation rules are triggered. There can be multiple response rules. You can add them by clicking the Add button and can remove them by clicking the button.
To add an existing response rule to a set of resources:
- Click Add.
The response rule settings window opens.
- In the Response rule drop-down list, select the relevant resource.
The response rule is added to the set of resources for the correlator.
To create a new response rule in a set of resources:
- Click Add.
The response rule settings window opens.
- In the Response rule drop-down list, select Create new.
- In the Type drop-down list, select the type of response rule and define its corresponding settings:
- ksctasks—if KUMA is integrated with Kaspersky Security Center, you can configure response rules to start Kaspersky Security Center tasks related to assets. For example, you can run a virus scan or database update. You can start these tasks only for assets that were imported from Kaspersky Security Center.
- script—used for running a sequence of instructions written to a file. The script file is stored on the server where the correlator service using the response resource is installed: /opt/kaspersky/kuma/correlator/<Correlator ID>/scripts. The
kumauser of the operating system must be able to run the script.
- If necessary, in the Workers field, specify the number of response task processes that can be run simultaneously.
- In the Filter section, you can specify conditions to identify events that will be processed by the response rule resource. You can select an existing filter resource from the drop-down list, or select Create new to create a new filter.
Creating a filter in resources
- In the Filter drop-down list, select Create new.
- If you want to keep the filter as a separate resource, set the Save filter toggle switch.
In this case, you will be able to use the created filter in various services.
The toggle switch is turned off by default.
- If you toggle the Save filter switch on, enter a name for the created filter resource in the Name field. The name must contain from 1 to 128 Unicode characters.
- In the Conditions settings block, specify the conditions that the events must meet:
- Click the Add condition button.
- In the Left operand and Right operand drop-down lists, specify the search parameters.
Depending on the data source selected in the Right operand field, you may see fields of additional parameters that you need to use to define the value that will be passed to the filter. For example, when choosing active list you will need to specify the name of the active list, the entry key, and the entry key field.
- In the operator drop-down list, select the relevant operator.
- If necessary, select the do not match case check box. When this check box is selected, the operator ignores the case of the values.
The selection of this check box does not apply to the InSubnet, InActiveList, InCategory or InActiveDirectoryGroup operators.
This check box is cleared by default.
- If you want to add a negative condition, select If not from the If drop-down list.
- You can add multiple conditions or a group of conditions.
- If you have added multiple conditions or groups of conditions, choose a search condition (and, or, not) by clicking the AND button.
- If you want to add existing filters that are selected from the Select filter drop-down list, click the Add filter button.
You can view the nested filter settings by clicking the
button.
The new response rule was added to the set of resources for the correlator.
Proceed to the next step of the Installation Wizard.
Page top
Step 5. Routing
This is an optional step of the Installation Wizard. On the Routing tab of the Installation Wizard, you can select or create destination resources with parameters indicating the forwarding destination of events created by the correlator. Events from a correlator are usually redirected to storage so that they can be saved and later viewed if necessary. Events can be sent to other locations as needed. There can be more than one destination point.
To add an existing destination to a set of resources for a correlator:
- In the Add destination drop-down list, select the type of destination resource you want to add:
- Select Storage if you want to configure forwarding of processed events to the storage.
- Select Correlator if you want to configure forwarding of processed events to a correlator.
- Select Other if you want to send events to other locations.
This type of resource includes correlator and storage services that were created in previous versions of the program.
The Add destination window opens where you can specify parameters for events forwarding.
- In the Destination drop-down list, select the necessary destination.
The window name changes to Edit destination, and it displays the settings of the selected resource. The resource can be opened for editing in a new browser tab using the
button. - Click Save.
The selected destination is displayed on the Installation Wizard tab. A destination resource can be removed from the resource set by selecting it and clicking Delete in the opened window.
To add a new destination to a set of resources for a correlator:
- In the Add destination drop-down list, select the type of destination resource you want to add:
- Select Storage if you want to configure forwarding of processed events to the storage.
- Select Correlator if you want to configure forwarding of processed events to a correlator.
- Select Other if you want to send events to other locations.
This type of resource includes correlator and storage services that were created in previous versions of the program.
The Add destination window opens where you can specify parameters for events forwarding.
- Specify the settings on the Basic settings tab:
- In the Destination drop-down list, select Create new.
- In the Name field, enter a unique name for the destination resource. The name must contain from 1 to 128 Unicode characters.
- Use the Disabled toggle button to specify whether events will be sent to this destination. By default, sending events is enabled.
- Select the Type for the destination resource:
- Select storage if you want to configure forwarding of processed events to the storage.
- Select correlator if you want to configure forwarding of processed events to a correlator.
- Select nats, tcp, http, kafka, or file if you want to configure sending events to other locations.
- Specify the URL to which events should be sent in the hostname:<API port> format.
You can specify multiple destination URLs using the URL button for all types except nats and file, if your KUMA license includes High Level Availability module.
If you have selected storage or correlator as the destination type, the URL field can be populated automatically using the Copy service URL drop-down list that displays active services of the selected type.
- For the nats and kafka types, use the Topic field to specify which topic the data should be written to. The topic name must contain from 1 to 255 Unicode characters.
- If required, define the settings on the Advanced settings tab. The available settings vary based on the selected destination resource type.
- Compression is a drop-down list where you can enable Snappy compression. By default, compression is disabled.
- Proxy is a drop-down list for proxy server resource selection.
- Buffer size field is used to set buffer size (in bytes) for the destination resource. The default value is 1 MB, and the maximum value is 64 MB.
- Timeout field is used to set the timeout (in seconds) for another service or component response. The default value is
30. - Disk buffer size limit field is used to specify the size of the disk buffer in bytes. The default size is 10 GB.
- Storage ID is a NATS storage identifier.
- TLS mode is a drop-down list where you can specify the conditions for using TLS encryption:
- Disabled (default)—do not use TLS encryption.
- Enabled—encryption is enabled, but without verification.
- With verification—use encryption with verification that the certificate was signed with the KUMA root certificate. The root certificate and key of KUMA are created automatically during program installation and are stored on the KUMA Core server in the folder /opt/kaspersky/kuma/core/certificates/.
When using TLS, it is impossible to specify an IP address as a URL.
- URL selection policy is a drop-down list in which you can select a method for determining which URL to send events to if several URLs have been specified:
- Any
- Prefer first
- Round robin
- Delimiter is used to specify the character delimiting the events. By default,
\nis used. - Path—the file path if the file destination type is selected.
- Flush interval sets the time (in seconds) between sending data to the destination resource. The default value is
100. - Workers—this field is used to set the number of services processing the queue. By default, this value is equal to the number of vCPUs of the KUMA Core server.
- You can set health checks using the Health check path and Health check timeout fields. You can also disable health checks by selecting the Health Check Disabled check box.
- Debug—a drop-down list where you can specify whether resource logging should be enabled. By default it is Disabled.
- The Disk buffer disabled drop-down list is used to enable or disable the use of a disk buffer. By default, the disk buffer is disabled.
- In the Filter section, you can specify the conditions to define events that will be processed by this resource. You can select an existing filter resource from the drop-down list, or select Create new to create a new filter.
Creating a filter in resources
- In the Filter drop-down list, select Create new.
- If you want to keep the filter as a separate resource, set the Save filter toggle switch.
In this case, you will be able to use the created filter in various services.
The toggle switch is turned off by default.
- If you toggle the Save filter switch on, enter a name for the created filter resource in the Name field. The name must contain from 1 to 128 Unicode characters.
- In the Conditions settings block, specify the conditions that the events must meet:
- Click the Add condition button.
- In the Left operand and Right operand drop-down lists, specify the search parameters.
Depending on the data source selected in the Right operand field, you may see fields of additional parameters that you need to use to define the value that will be passed to the filter. For example, when choosing active list you will need to specify the name of the active list, the entry key, and the entry key field.
- In the operator drop-down list, select the relevant operator.
- If necessary, select the do not match case check box. When this check box is selected, the operator ignores the case of the values.
The selection of this check box does not apply to the InSubnet, InActiveList, InCategory or InActiveDirectoryGroup operators.
This check box is cleared by default.
- If you want to add a negative condition, select If not from the If drop-down list.
- You can add multiple conditions or a group of conditions.
- If you have added multiple conditions or groups of conditions, choose a search condition (and, or, not) by clicking the AND button.
- If you want to add existing filters that are selected from the Select filter drop-down list, click the Add filter button.
You can view the nested filter settings by clicking the
button.
- Click Save.
The created destination resource is displayed on the Installation Wizard tab. A destination resource can be removed from the resource set by selecting it and clicking Delete in the opened window.
Proceed to the next step of the Installation Wizard.
Page top
Step 6. Setup validation
This is the required, final step of the Installation Wizard. In this step, KUMA creates a set of service resources, and based on this set, the Services are created automatically.
- The set of resources for the collector is displayed under Resources → Correlators. It can be used to create new correlator services. When this set of resources changes, all services that operate based on this set of resources will start using the new parameters after the services restart. To do so, you can use the Save and restart services and Save and reload services buttons.
A set of resources can be modified, copied, moved from one folder to another, deleted, imported, and exported, like other resources.
- Services are displayed in Resources → Active services. The services created using the Installation Wizard perform functions inside the KUMA program. To communicate with external parts of the network infrastructure, you need to install similar external services on the servers and assets intended for them. For example, an external correlator service should be installed on a server intended to process events, external storage services should be installed on servers with a deployed ClickHouse service, and external agent services should be installed on Windows assets that must both receive and forward Windows events.
To finish the Installation Wizard:
- Click Create and save service.
The Setup validation tab of the Installation Wizard displays a table of services created based on the set of resources selected in the Installation Wizard. The lower part of the window shows examples of commands that you must use to install external equivalents of these services on their intended servers and assets.
For example:
/opt/kaspersky/kuma/kuma correlator --core https://kuma-example:<port used for communication with the KUMA Core> --id <service ID> --api.port <port used for communication with the service> --install
The port for communication with the KUMA Core, the service ID, and the port for communication with the service are added to the command automatically. You should also ensure the network connectivity of the KUMA system and open the ports used by its components if necessary.
- Close the Wizard by clicking Save.
The correlator service is created in KUMA. Now the equivalent service must be installed on the server intended for processing events.
Page top
Installing a correlator in a KUMA network infrastructure
A correlator consists of two parts: one part is created inside the KUMA web interface, and the other part is installed on the network infrastructure server intended for processing events. The second part of the correlator is installed in the network infrastructure.
To install a correlator:
- Log in to the server where you want to install the service.
- Execute the following command:
sudo /opt/kaspersky/kuma/kuma correlator --core https://<KUMA Core server FQDN>:<port used by KUMA Core server for internal communication (port 7210 by default)> --id <service ID copied from the KUMA web interface> --api.port <port used for communication with the installed component> --installExample:
sudo /opt/kaspersky/kuma/kuma correlator --core https://kuma.example.com:7210 --id XXXX --api.port YYYY --installYou can copy the correlator installation command at the last step of the Installation Wizard. It automatically specifies the address and port of the KUMA Core server, the identifier of the correlator to be installed, and the port that the correlator uses for communication. Before installation, ensure the network connectivity of KUMA components.
When deploying several KUMA services on the same host, during the installation process you must specify unique ports for each component using the
--api.port <port>parameter. The following setting values are used by default:--api.port 7221.
The correlator is installed. You can use it to analyze events for threats.
Validating correlator installation
To verify that the correlator is ready to receive events:
- In the KUMA web interface, open Resources → Active services.
- Make sure that the correlator you installed has the green status.
If the events that are fed into the correlator contain events that meet the correlation rule filter conditions, the events tab will show events with the DeviceVendor=Kaspersky and DeviceProduct=KUMA parameters. The name of the triggered correlation rule will be displayed as the name of these correlation events.
If correlation events were not found
You can create a simpler version of your correlation rule to find possible errors. Use a simple correlation rule and a single Output action. It is recommended to create a filter to find events that are regularly received by KUMA.
When updating, adding, or removing a correlation rule, you must restart the correlator.
When you finish testing your correlation rules, you must remove all testing and temporary correlation rules from KUMA and restart the correlator.
Creating an agent
A KUMA agent consists of two parts: one part is created inside the KUMA web interface, and the second part is installed on a server or on an asset in the network infrastructure.
An agent is created in several steps:
- Create a set of resources for the agent in the KUMA web interface.
- Create an agent service in the KUMA web interface.
- Install the server portion of the agent to the asset that will forward messages.
A KUMA agent for Windows assets can be created automatically when you create a collector with the wmi or wec transport type. Although the set of resources and service of these agents are created in the Collector Installation Wizard, they must still be installed to the asset that will be used to forward a message.
Creating a set of resources for an agent
In the KUMA web interface, an agent service is created based on the set of resources for an agent that unites connectors and destinations.
To create a set of resources for an agent in the KUMA web interface:
- In the KUMA web interface, under Resources → Agents, click Add agent.
This opens a window for creating an agent with the Base settings tab active.
- Fill in the settings on the Base settings tab.
- In the Agent name field, enter a unique name for the created service. The name must contain from 1 to 128 Unicode characters.
- In the Tenant drop-down list, select the tenant that will own the storage.
- If you want, select the Debug check box to log service operations.
- You can optionally add up to 256 Unicode characters describing the service in the Description field.
- Create a connection for the agent by using the button and switch to the added Connection <number> tab.
You can delete tabs by using the
button. - In the Connector settings block, add a connector resource:
- If you want to select an existing resource, select it from the drop-down list.
- If you want to create a new resource, select it in the Create new drop-down list and define its settings:
- Specify the connector name in the Name field. The name must contain from 1 to 128 Unicode characters.
- In the Type drop-down list, select the connector type and define its settings on the Basic settings and Advanced settings tabs. The available settings depend on the selected type of connector:
The agent type is determined by the connector that is used in the agent.
When using the tcp or upd connector type at the normalization stage, IP addresses of the assets from which the events were received will be written in the DeviceAddress event field if it is empty.
- You can optionally add up to 256 Unicode characters describing the resource in the Description field.
The connector resource is added to the selected connection of the agent's set of resources. The created resource is only available in this resource set and is not displayed in the web interface Resources → Connectors section.
- In the Destinations settings block, add resources of destinations. Agents can forward data only to collectors.
- If you want to select an existing resource, select it from the drop-down list.
- If you want to create a new resource, select it in the Create new drop-down list and define its settings.
- Specify the settings on the Basic settings tab:
- In the Name field, enter a unique name for the destination resource. The name must contain from 1 to 128 Unicode characters.
- Use the Disabled toggle button to specify whether events will be sent to this destination. By default, sending events is enabled.
- Select the Type of destination: nats, tcp, http, kafka or file.
- Indicate the URL where events should be sent.
You can specify multiple destination URLs using the URL button for all types except nats and file, if your KUMA license includes High Level Availability module.
- For the nats and kafka types, use the Topic field to specify which topic the data should be written to. The topic name must contain from 1 to 255 Unicode characters.
- You can optionally add up to 256 Unicode characters describing the resource in the Description field.
- If required, define the settings on the Advanced settings tab. The available settings vary based on the selected destination resource type.
- Compression is a drop-down list where you can enable Snappy compression. By default, compression is disabled.
- Proxy is a drop-down list for proxy server resource selection.
- Buffer size field is used to set buffer size (in bytes) for the destination resource. The default value is 1 MB, and the maximum value is 64 MB.
- Timeout field is used to set the timeout (in seconds) for another service or component response. The default value is
30. - Disk buffer size limit field is used to specify the size of the disk buffer in bytes. The default size is 10 GB.
- Storage ID is a NATS storage identifier.
- TLS mode is a drop-down list where you can specify the conditions for using TLS encryption:
- Disabled (default)—do not use TLS encryption.
- Enabled—encryption is enabled, but without verification.
- With verification—use encryption with verification that the certificate was signed with the KUMA root certificate. The root certificate and key of KUMA are created automatically during program installation and are stored on the KUMA Core server in the folder /opt/kaspersky/kuma/core/certificates/.
When using TLS, it is impossible to specify an IP address as a URL.
- URL selection policy is a drop-down list in which you can select a method for determining which URL to send events to if several URLs have been specified:
- Any
- Prefer first
- Round robin
- Delimiter is used to specify the character delimiting the events. By default,
\nis used. - Path—the file path if the file destination type is selected.
- Flush interval sets the time (in seconds) between sending data to the destination resource. The default value is
100. - Workers—this field is used to set the number of services processing the queue. By default, this value is equal to the number of vCPUs of the KUMA Core server.
- You can set health checks using the Health check path and Health check timeout fields. You can also disable health checks by selecting the Health Check Disabled check box.
- Debug—a drop-down list where you can specify whether resource logging should be enabled. By default it is Disabled.
- The Disk buffer disabled drop-down list is used to enable or disable the use of a disk buffer. By default, the disk buffer is disabled.
- In the Filter section you can specify conditions to identify events that will be processed by the aggregation rule resource. You can select an existing filter resource from the drop-down list, or select Create new to create a new filter.
Creating a filter in resources
- In the Filter drop-down list, select Create new.
- If you want to keep the filter as a separate resource, set the Save filter toggle switch.
In this case, you will be able to use the created filter in various services.
The toggle switch is turned off by default.
- If you toggle the Save filter switch on, enter a name for the created filter resource in the Name field. The name must contain from 1 to 128 Unicode characters.
- In the Conditions settings block, specify the conditions that the events must meet:
- Click the Add condition button.
- In the Left operand and Right operand drop-down lists, specify the search parameters.
Depending on the data source selected in the Right operand field, you may see fields of additional parameters that you need to use to define the value that will be passed to the filter. For example, when choosing active list you will need to specify the name of the active list, the entry key, and the entry key field.
- In the operator drop-down list, select the relevant operator.
- If necessary, select the do not match case check box. When this check box is selected, the operator ignores the case of the values.
The selection of this check box does not apply to the InSubnet, InActiveList, InCategory or InActiveDirectoryGroup operators.
This check box is cleared by default.
- If you want to add a negative condition, select If not from the If drop-down list.
- You can add multiple conditions or a group of conditions.
- If you have added multiple conditions or groups of conditions, choose a search condition (and, or, not) by clicking the AND button.
- If you want to add existing filters that are selected from the Select filter drop-down list, click the Add filter button.
You can view the nested filter settings by clicking the
button.
The advanced settings for an agent destination (such as TLS mode and compression) must match the advanced destination settings for the collector that you want to link to the agent.
- Specify the settings on the Basic settings tab:
There can be more than one destination point. You can add them by clicking the Add destination button and can remove them by clicking the
button. - Repeat steps 3–5 for each agent connection that you want to create.
- Click Save.
The set of resources for the agent is created and displayed under Resources → Agents. Now you can create an agent service in KUMA.
Page top
Create an agent service in the KUMA web interface.
When a set of resources is created for an agent, you can proceed to create an agent service in KUMA.
To create an agent service in the KUMA web interface:
- In the KUMA web interface, under Resources → Active services, click Add service.
- In the opened Choose a service window, select the set of resources that was just created for the agent and click Create service.
The agent service is created in the KUMA web interface and is displayed under Resources → Active services. Now agent services must be installed to each asset from which you want to forward data to the collector. A service ID is used during installation.
Installing an agent in a KUMA network infrastructure
When an agent service is created in KUMA, you can proceed to installation of the agent to the network infrastructure assets that will be used to forward data to a collector.
Prior to installation, verify the network connectivity of the system and open the ports used by its components.
Installing a KUMA agent on Linux assets
To install a KUMA agent to a Linux asset:
- Log in to the server where you want to install the service.
- Execute the following command:
sudo /opt/kaspersky/kuma/kuma agent --core https://<KUMA Core server FQDN>:<port used by KUMA Core server for internal communication (port 7210 by default)> --id <service ID copied from the KUMA web interface>Example:
sudo /opt/kaspersky/kuma/kuma agent --core https://kuma.example.com:7210 --id XXXX
The KUMA agent is installed on the Linux asset. The agent forwards data to KUMA, and you can set up a collector to receive this data.
Page top
Installing a KUMA agent on Windows assets
Prior to installing a KUMA agent to a Windows asset, the server administrator must create a user account with the EventLogReaders and Log on as a service permissions on the Windows asset. This user account must be used to start the agent.
To install a KUMA agent to a Windows asset:
- Copy the kuma.exe file to a folder on the Windows asset.
C:\Users\<User name>\Desktop\KUMAfolder is recommended for installation.The kuma.exe file is located inside the installer in the /kuma-ansible-installer/roles/kuma/files/ folder.
- Start the Command Prompt on the Windows asset with Administrator privileges and locate the folder containing the kuma.exe file.
- Execute the following command:
kuma agent --core https://<fullly qualified domain name of the KUMA Core server>:<port used by the KUMA Core server for internal communications (port 7210 by default)> --id <ID of the agent service that was created in KUMA> --user <name of the user account used to run the agent, including the domain> --installExample:
kuma agent --core https://kuma.example.com:7210 --id XXXXX --user domain\username --installYou can get help information by executing the
kuma help agentcommand. - Enter the password of the user account used to run the agent.
The C:\Program Files\Kaspersky Lab\KUMA\agent\<Agent ID> folder is created in which the KUMA agent service is installed. The agent forwards Windows events to KUMA, and you can set up a collector to receive them.
When the agent service is installed, it starts automatically. The service is also configured to restart in case of any failures. The agent can be restarted from the KUMA web interface, but only when the service is active. Otherwise, the service needs to be manually restarted on the Windows asset.
Removing a KUMA agent from Windows assets
When configuring services, you can test the configuration for errors before installation by running the agent with the following command: kuma agent --core https://<fully qualified domain name of the KUMA Core server>:<port used by the KUMA Core server for internal communications (port 7210 by default)> --id <.ID of the agent service that was created in KUMA> --user <name of the user account used to run the agent, including the domain>
Automatically created agents
When creating a collector with wec or wmi connectors, agents are automatically created for receiving Windows events.
Automatically created agents have the following special conditions:
- Automatically created agents can have only one connection.
- Automatically created agents are displayed under Resources → Agents, and
auto createdis indicated at the end of their name. Agents can be reviewed or deleted. - The settings of automatically created agents are defined automatically based on the collector settings from the Connect event sources and Transport sections. You can change the settings only for a collector that has a created agent.
- The description of an automatically created agent is taken from the collector description in the Connect event sources section.
- Debugging of an automatically created agent is enabled and disabled in the Connect event sources section of the collector.
- When deleting a collector with an automatically created agent, you will be prompted to choose whether to delete the collector together with the agent or to just delete the collector. When deleting only the collector, the agent will become available for editing.
- When deleting automatically created agents, the type of collector changes to http, and the connection address is deleted from the URL field of the collector.
In the KUMA interface, automatically created agents appear at the same time when the collector is created. However, they must still be installed on the asset that will be used to forward a message.
Page top
Update agents
When updating KUMA versions, the WMI and WEC agents installed on remote machines must also be updated.
To update the agent:
- Install the new agent on a remote machine.
The agent has been updated, but no data is coming from it due to an invalid certificate.
- In the KUMA web interface, under Resources → Active services , reset the certificate of the agent being upgraded.
- On the remote machine with the installed agent, start the "KUMA Windows Agent <service ID>" service.
For more information on Windows services, see the documentation for your version of Windows.
The agent and its certificates have been updated.
Page top
Creating a storage
A storage consists of two parts: one part is created inside the KUMA web interface, and the other part is installed on network infrastructure servers intended for storing events. The server part of a KUMA storage consists of ClickHouse nodes collected into a cluster.
For each ClickHouse cluster, a separate storage must be installed.
Prior to storage creation, carefully plan the structure of the cluster and deploy the necessary network infrastructure. When choosing a ClickHouse cluster configuration, consider the specific event storage requirements of your organization.
It is recommended to use ext4 as the file system.
A storage is created in several steps:
- Create a set of resources for a storage in the KUMA web interface.
- Create a storage service in the KUMA web interface.
- Installing storage nodes in the KUMA network infrastructure.
When creating storage cluster nodes, verify the network connectivity of the system and open the ports used by the components.
Creating a set of resources for a storage
In the KUMA web interface, a storage service is created based on the set of resources for the storage.
To create a set of resources for a storage in the KUMA web interface:
- In the KUMA web interface, under Resources → Storages, click Add storage.
The storage creation window opens.
- In the Storage name field, enter a unique name for the service you are creating. The name must contain from 1 to 128 Unicode characters.
- In the Tenant drop-down list, select the tenant that will own the storage.
- You can optionally add up to 256 Unicode characters describing the service in the Description field.
- In the Default retention period, days field, enter the necessary time period for storing events in the cluster.
- In the Audit retention period, days field, enter the necessary time period for storing audit events. The minimum value and default value is
365. - If necessary, use the Add space button to add space to the storage. There can be multiple spaces. You can delete spaces by clicking the Delete space button. After creating the service, you will be able to view and delete spaces in the Partitions window.
Available settings:
- In the Name field, specify a name for the space. This name can contain from 1 to 128 Unicode characters.
- In the Retention period, days field, specify the number of days to store events in the cluster.
- In the Filter section, you can specify conditions to identify events that will be put into this space. You can select an existing filter resource from the drop-down list, or select Create new to create a new filter.
Creating a filter in resources
- In the Filter drop-down list, select Create new.
- If you want to keep the filter as a separate resource, set the Save filter toggle switch.
In this case, you will be able to use the created filter in various services.
The toggle switch is turned off by default.
- If you toggle the Save filter switch on, enter a name for the created filter resource in the Name field. The name must contain from 1 to 128 Unicode characters.
- In the Conditions settings block, specify the conditions that the events must meet:
- Click the Add condition button.
- In the Left operand and Right operand drop-down lists, specify the search parameters.
Depending on the data source selected in the Right operand field, you may see fields of additional parameters that you need to use to define the value that will be passed to the filter. For example, when choosing active list you will need to specify the name of the active list, the entry key, and the entry key field.
- In the operator drop-down list, select the relevant operator.
- If necessary, select the do not match case check box. When this check box is selected, the operator ignores the case of the values.
The selection of this check box does not apply to the InSubnet, InActiveList, InCategory or InActiveDirectoryGroup operators.
This check box is cleared by default.
- If you want to add a negative condition, select If not from the If drop-down list.
- You can add multiple conditions or a group of conditions.
- If you have added multiple conditions or groups of conditions, choose a search condition (and, or, not) by clicking the AND button.
- If you want to add existing filters that are selected from the Select filter drop-down list, click the Add filter button.
You can view the nested filter settings by clicking the
button.
The set of resources for the storage is created and is displayed under Resources → Storages. Now you can create a storage service.
Page top
Create a storage service in the KUMA web interface.
When creating a set of resources for a storage agent, you can proceed to create an agent service in KUMA.
To create a storage service in the KUMA web interface:
- In the KUMA web interface, under Resources → Active services, click Add service.
- In the opened Choose a service window, select the set of resources that you just created for the storage and click Create service.
The storage service is created in the KUMA web interface and is displayed under Resources → Active services. Now storage services must be installed to each node of the ClickHouse cluster by using the service ID.
Page top
Installing a storage in the KUMA network infrastructure
To create a storage:
- Log in to the server where you want to install the service.
- Execute the following command:
sudo /opt/kaspersky/kuma/kuma storage --core https://<KUMA Core server FQDN>:<port used by KUMA Core for internal communication (port 7210 by default)> --id <service ID copied from the KUMA web interface> --installExample:
sudo /opt/kaspersky/kuma/kuma storage --core https://kuma.example.com:7210 --id XXXXX --installWhen deploying several KUMA services on the same host, during the installation process you must specify unique ports for each component using the
--api.port <port>parameter. The following setting values are used by default:--api.port 7221. - Repeat steps 1–2 for each storage node.
The storage is installed.
Page top
Analytics
KUMA provides extensive analytics on the data available to the program from the following sources:
- Events in storage
- Alerts
- Assets
- Accounts imported from Active Directory
- Data from collectors on the number of processed events
- Metrics
You can configure and receive analytics in the Dashboard, Reports, and Sources status sections of the KUMA web interface. Analytics are built by using only the data from tenants that the user can access.
Displayed date format:
- English localization: YYYY-MM-DD.
- Russian localization: DD.MM.YYYY.
Dashboard
In KUMA, you can configure the Dashboard to display the most recent information (or analytics) about KUMA processes. Analytics are generated using widgets, which are specialized tools that can display specific types of information. If a widget displays data on events, alerts or incidents, you can click its header to open the corresponding section of the KUMA web interface with an active filter and/or search query that is used to display data from the widget.
The collections of widgets are called layouts. Administrators and analysts can create, edit, and delete layouts. You can also assign any layout as the default layout so that it is displayed when you open the Dashboard section.
The information in the Dashboard section is updated regularly as per layout configuration, but you can force an update by clicking the  button at the top of the window. The time of last update is displayed near the window title.
The data displayed on the dashboard depends on the tenants that you can access.
For convenient presentation of analytical data, you can enable TV mode. This lets you hide the left pane containing sections of the KUMA interface and switch to full-screen mode in Full HD resolution. In TV mode, you can also configure a slide show display for selected widgets.
Creating dashboard layout
To create a layout:
- Open the KUMA web interface and select the Dashboard section.
- Open the drop-down list in the top right corner of the Dashboard window and select Create layout.
The New layout window opens.
- In the Tenants drop-down list, select the tenants that will own the layout being created.
- In the Time period drop-down list, select the time period from which you require analytics:
- 1 hour
- 1 day (this value is selected by default)
- 7 days
- 30 days
- In period—receive analytics for the custom time period. The time period is set using the calendar that is display when this option is selected.
- In the Refresh every drop-down list, select how often data should be updated in layout widgets:
- 1 minute
- 5 minutes
- 15 minutes
- 1 hour (this value is selected by default)
- 24 hours
- In the Add widget drop-down list, select the required widget and configure its settings.
You can add multiple widgets to the layout.
You can also drag widgets around the window and resize them using the
 button that appears when you hover the mouse over a widget.
You can edit or delete widgets added to the layout by clicking the
 icon and selecting Edit to change their configuration or Delete to delete them from the layout.
- Adding widgets
- Editing widget
To edit widget:
- Hover the mouse over the required widget and clicking the icon that appears.
- In the drop-down list select Edit.
The window with widget parameters opens. You can see how the widget will look like by clicking the Preview button.
- Update widget parameters and click the Save button.
- Hover the mouse over the required widget and clicking the
- In the Layout name field, enter a unique name for this layout. Must contain from 1 to 128 Unicode characters.
- Click Save.
The new layout is created and is displayed in the Dashboard section of the KUMA web interface.
Page top
Selecting dashboard layout
To select layout:
- Open the KUMA web interface and select the Dashboard section.
- Open the drop-down list in the top right corner of the Dashboard window and select the required layout.
The selected layout is displayed in the Dashboard section of the KUMA web interface.
Page top
Selecting dashboard layout as a default
To set layout as a default:
- Open the KUMA web interface and select the Dashboard section.
- Open the drop-down list in the top right corner of the Dashboard window and hover mouse over the required layout.
- Click the
 icon.
icon.
The selected layout is become default layout.
Page top
Editing dashboard layout
To edit layout:
- Open the KUMA web interface and select the Dashboard section.
- Open the drop-down list in the top right corner of the Dashboard window and hover mouse over the required layout.
- Click the icon.
- The Customizing layout window opens.
- Make the necessary changes. The settings that are available for editing are the same as the settings available when creating a layout.
- Click Save.
The layout is updated and is displayed in the Dashboard section of the KUMA web interface.
If the layout was deleted or assigned to a different tenant while you were making changes to it, an error will be displayed when you click Save. In this case, the layout will not be saved. Reload the page in your web browser to view the list of available layouts in the drop-down list in the upper-right corner.
Page top
Deleting dashboard layout
To delete layout:
- Open the KUMA web interface and select the Dashboard section.
- Open the drop-down list in the top right corner of the Dashboard window and hover mouse over the required layout.
- Click the icon and confirm this action.
The layout is deleted.
Page top
Preconfigured widgets
KUMA comes with a set of preconfigured layouts with widgets:
- Alerts Overview layout (Alert overview):
- Active Alerts
- Unassigned Alerts
- Alerts distribution
- Alerts by Assignee
- Alerts by Status
- Alerts count by rule
- Alerts by Priority
- Affected Assets
- Affected Assets Categories
- Affected Users
- Latest Alerts
- Top Log Sources by Alerts count
- Top Log Sources by convention rate
- Alerts by tenant
- Incidents Overview layout (Incidents overview):
- Active incidents
- Unassigned Incidents
- Incidents distribution
- Incidents by assignee
- Incidents by Status
- Incidents by Priority
- Incidents by Tenant
- Affected Assets in Incidents
- Affected Assets Categories in Incidents
- Affected Users in Incidents
- Latest Incidents
- Network Overview layout (Network activity overview):
- Top internal IP by Netflow Traffic Volume (BytesIn)
- Top external IP by Netflow Traffic Volume (BytesIn)
- Netflow top hosts for remote control (ports 3389, 22, 135)
- Netflow total bytes by internal ports
- Top Log Sources by Events count
- Top Events categories
- Assets count
- Users count
Enabling and disabling TV mode
It is recommended to create a separate user with the minimum required set of right to display analytics in TV mode.
To enable TV mode:
- Open the KUMA web interface and select the Dashboard section.
- Click the
 button in the upper-right corner.
The Settings window opens.
- Move the TV mode toggle switch to the Enabled position.
- If you want to configure the slideshow display of widgets, do the following:
- Move the Slideshow toggle switch to the Enabled position.
- In the Timeout field, indicate how many seconds to wait before switching widgets.
- In the Queue drop-down list, select the widgets to view.
- If necessary, change the order in which the widgets are displayed by using the button to drag and drop them in the necessary order.
- Click the Save button.
TV mode will be enabled. To return to working with the KUMA web interface, disable TV mode.
To disable TV mode:
- Open the KUMA web interface and select the Dashboard section.
- Click the button in the upper-right corner.
The Settings window opens.
- Move the TV mode toggle switch to the Disabled position.
- Click the Save button.
TV mode will be disabled. The left part of the screen shows a pane containing sections of the KUMA web interface.
Page top
Reports
You can configure KUMA to regularly generate reports about KUMA processes.
Reports are generated using report templates that are created and stored on the Templates tab of the Reports section.
Generated reports are stored on the Generated reports tab of the Reports section.
Report template
Report templates are used to specify the analytical data to include in the report, and to configure how often reports must be generated. Administrators and analysts can create, edit, and delete report templates. Reports that were generated using report templates are displayed in the Generated reports tab.
Report templates are available in the Templates tab of the Reports section, where the table of existing templates is displayed. The table has the following columns:
- Name—the name of the report template.
You can sort the table by this column by clicking the title and selecting Ascending or Descending.
You can also search report templates by using the Search field that opens when you click the Name column title.
- Period—the time period for which the report's analytics are extracted.
- Schedule—the rate at which reports must be generated using the template. If the report schedule was not configured, the
disabledvalue is displayed. - Created by—the name of the user who created the report template.
- Time updated—the date when the report template was last updated.
You can sort the table by this column by clicking the title and selecting Ascending or Descending.
- Last report—the date and time when the last report was generated based on the report template.
- Send by email—the check mark is displayed in this column for the report templates that notify users about generated reports via email notifications.
- Tenant—the name of the tenant that owns the report template.
You can click the name of the report template to open the drop-down list with available commands:
- Run report—use this option to generate report immediately. The generated reports are displayed in the Generated reports tab.
- Edit schedule—use this command to configure the schedule for generating reports and to define users that must receive email notifications about generated reports.
- Edit report template—use this command to configure widgets and the time period for extracting analytics.
- Duplicate report template—use this command to create a copy of the existing report template.
- Delete report template—use this command to delete the report template.
Creating report template
To create report template:
- Open the KUMA web interface and select Reports → Templates.
- Click the New template button.
The New report template window opens.
- In the Tenants drop-down list, select the tenants that will own the layout being created.
- In the Time period drop-down list, select the time period from which you require analytics:
- This day (this value is selected by default)
- This week
- This month
- In period—receive analytics for the custom time period.
- Custom—receive analytics for the last N days/weeks/months/years.
- In the Retention field, specify how long you want to store reports that are generated according to this template.
- In the Template name field, enter a unique name for the report template. Must contain from 1 to 128 Unicode characters.
- In the Add widget drop-down list, select the required widget and configure its settings.
You can add multiple widgets to the report template.
You can also drag widgets around the window and resize them using the
button that appears when you hover the mouse over a widget.You can edit or delete widgets added to the layout by hovering the mouse over them, clicking the
icon that appears and selecting Edit to change their configuration or Delete to delete them from layout.- Adding widgets
- Editing widget
To edit widget:
- Hover the mouse over the required widget and clicking the icon that appears.
- In the drop-down list select Edit.
The window with widget parameters opens. You can see how the widget will look like by clicking the Preview button.
- Update widget parameters and click the Save button.
- Hover the mouse over the required widget and clicking the
- If you want, add logo to the report template by clicking the Change logo button.
When you click the Change logo button, the Upload window opens where you can specify the image file for the logo using the Upload button. The image must be a .jpg, .png, or .gif file no larger than 3 MB.
The added logo is displayed in the report instead of KUMA logo.
- Click Save.
The new report template is created and is displayed in the Reports → Templates tab of the KUMA web interface. You can run this report manually. If you want to have the reports generated automatically, you must configure the schedule for that.
Page top
Configuring report schedule
To configure report schedule:
- Open the KUMA web interface and select Reports → Templates.
- In the report templates table, click the name of an existing report template and select Edit schedule in the drop-down list.
The Report settings window opens.
- If you want the report to be generated regularly:
- Turn on the Schedule toggle switch.
In the Recur every group of settings, define how often the report must be generated.
- In the Time field, enter the time when the report must be generated. You can enter the value manually or using the clock icon.
- Turn on the Schedule toggle switch.
- If you want, in the Send to drop-down list select the users you want to receive the link to the generated reports via email.
You should configure an SMTP connection so that generated reports can be forwarded by email.
- Click Save.
Report schedule is configured.
Page top
Editing report template
To edit report template:
- Open the KUMA web interface and select Reports → Templates.
- In the report templates table click the name of the report template and select Edit report template in the drop-down list.
The Edit report template window opens.
You can also open this window in the Reports → Generated reports tab by clicking the name of a generated report and selecting in the drop-down list Edit report template.
- Make the necessary changes:
- Change the tenants that own the report template.
- Update the time period from which you require analytics.
- Add widgets
- Change widgets positions by dragging them.
- Resize widgets using the button that appears when you hover the mouse over a widget.
- Edit widgets
To edit widget:
- Hover the mouse over the required widget and clicking the icon that appears.
- In the drop-down list select Edit.
The window with widget parameters opens. You can see how the widget will look like by clicking the Preview button.
- Update widget parameters and click the Save button.
- Hover the mouse over the required widget and clicking the
- Delete widgets by hovering the mouse over them, clicking the icon that appears, and selecting Delete.
- In the field to the right from the Add widget drop-down list enter a new name of the report template. Must contain from 1 to 128 Unicode characters.
- Change the report's logo by clicking the Change logo button.
- Change how long reports generated using this template must be stored.
- Click Save.
The report template is updated and is displayed in the Reports → Templates tab of the KUMA web interface.
Page top
Copying report template
To create a copy of a report template:
- Open the KUMA web interface and select Reports → Templates.
- In the report templates table, click the name of an existing report template, and select Duplicate report template in the drop-down list.
The New report template window opens. The name of the widget is changed to
<Report template> - copy. - Make the necessary changes:
- Change the tenants that own the report template.
- Update the time period from which you require analytics.
- Add widgets
- Change widgets positions by dragging them.
- Resize widgets using the button that appears when you hover the mouse over a widget.
- Edit widgets
To edit widget:
- Hover the mouse over the required widget and clicking the icon that appears.
- In the drop-down list select Edit.
The window with widget parameters opens. You can see how the widget will look like by clicking the Preview button.
- Update widget parameters and click the Save button.
- Hover the mouse over the required widget and clicking the
- Delete widgets by hovering the mouse over them, clicking the icon that appears, and selecting Delete.
- In the field to the right from the Add widget drop-down list enter a new name of the report template. Must contain from 1 to 128 Unicode characters.
- Change the report's logo by clicking the Change logo button.
- Click Save.
The report template is created and is displayed in the Reports → Templates tab of the KUMA web interface.
Page top
Deleting report template
To delete report template:
- Open the KUMA web interface and select Reports → Templates.
- In the report templates table, click the name of the report template, and select Delete report template in the drop-down list.
A confirmation window opens.
- If you want to delete only the report template, click the Delete button.
- If you want to delete a report template and all the reports that were generated using that template, click the Delete with reports button.
The report template is deleted.
Page top
Generated reports
All reports are generated using report templates. Generated reports are available in the Generated reports tab of the Reports section and are displayed in the table with the following columns:
- Name—the name of the report template.
You can sort the table by this column by clicking the title and selecting Ascending or Descending.
- Time period—the time period for which the report analytics were extracted.
- Last report—date and time when the report was generated.
You can sort the table by this column by clicking the title and selecting Ascending or Descending.
- Tenant—name of the tenant that owns the report.
You can click the name of a report to open the drop-down list with available commands:
- Open report—use this command to open the report data window.
- Save as HTML—use this command to save the report as an HTML file.
- Run report—use this option to generate report immediately. Refresh the browser window to see the newly generated report in the table.
- Edit report template—use this command to configure widgets and the time period for extracting analytics.
- Delete report—use this command to delete the report.
Opening report
To open report:
- Open the KUMA web interface and select Reports → Generated reports.
- In the report table, click the name of the generated report, and select Open report in the drop-down list.
The new browser window opens with the widgets displaying report analytics. If a widget displays data on events, alerts or incidents, you can click its header to open the corresponding section of the KUMA web interface with an active filter and/or search query that is used to display data from the widget.
- If necessary, you can save the report to an HTML file by using the Save as HTML button.
Generating report
You can generate report manually or configure a schedule to have it generated automatically.
To generate report manually:
- Open the KUMA web interface and select Reports → Templates.
- In the report templates table, click a report template name and select Run report in the drop-down list.
You can also generate report from the Reports → Generated reports tab by clicking the name of an existing report and in the drop-down list selecting Run report.
The report is generated and is displayed in the Reports → Generated reports tab.
To generate report automatically:
Configure the report schedule.
Page top
Saving report as HTML
To save the report as HTML:
- Open the KUMA web interface and select Reports → Generated reports.
- In the report table, click the name of a generated report, and select Save as HTML in the drop-down list.
The report is saved as HTML file using your browser settings.
Page top
Deleting report
To delete report:
- Open the KUMA web interface and select Reports → Generated reports.
- In the report table, click the name of the generated report, and in the drop-down list select Delete report.
A confirmation window opens.
- Click OK.
Sources status
In KUMA, you can monitor the state of the sources of data received by collectors. There can be multiple sources of events on one server, and data from multiple sources can be received by one collector. Sources of events are identified based on the following fields of events (the data in these fields is case sensitive):
- DeviceProduct
- DeviceAddress or DeviceHostName
Lists of sources are generated in collectors, merged in the KUMA Core, and displayed in the program web interface under Sources status on the List of event sources tab. Data is updated every minute.
The rate and number of incoming events serve as an important indicator of the state of the observed system. You can configure monitoring policies such that changes are tracked automatically and notifications are automatically created when indicators reach specific boundary values. Monitoring policies are displayed in the KUMA web interface under Sources status on the Monitoring policies tab.
When monitoring policies are triggered, monitoring events are created and include data about the source of events.
List of event sources
Sources of events are displayed in the table under Sources status → List of event sources. Data is updated once every minute, and one page can display up to 250 sources. You can sort the table by clicking the column header of the relevant setting. You can use the Search field to search for sources of events. Clicking on a source of events opens an incoming data graph.
The following columns are available:
- Status—status of the event source:
- Green—events are being received within the limits of the assigned monitoring policy.
- Red—the frequency or number of incoming events go beyond the boundaries defined in the monitoring policy.
- Gray—a monitoring policy has not been assigned to the source of events.
The table can be filtered by this setting.
- Name—name of the event source. The name is generated automatically from the following fields of events:
- DeviceProduct
- DeviceAddress and/or DeviceHostname
- DeviceProcessName
- Tenant
You can change the name of an event source.
- Host name or IP address—host name or IP address from which the events were forwarded.
- Monitoring policy—name of the monitoring policy assigned to the event source.
- Stream—frequency at which events are received from the event source.
- Lower limit—lower boundary of the permissible number of incoming events as indicated in the monitoring policy.
- Upper limit—upper boundary of the permissible number of incoming events as indicated in the monitoring policy.
- Tenant—the tenant that owns the events received from the event source.
If you select sources of events, the following buttons become available:
- Save to CSV—you can use this button to export data of the selected event sources to a file named event-source-list.csv in UTF-8 encoding.
- Apply policy and Disable policy—you can use these buttons to enable or disable a monitoring policy for a source of events. When enabling a policy, you must select the policy from the drop-down list. When disabling a policy, you must select how long you want to disable the policy: temporarily or forever.
In some rare cases, the status of a disabled policy may change from gray to green a few seconds after it is disabled due to overlapping internal processes of KUMA. If this happens, you need to disable the monitoring policy again.
- Remove event source from the list—you can use this button to remove an event source from the table. The statistics on this source will also be removed. If a collector continues to receive data from the source, the event source will re-appear in the table but its old statistics will not be taken into account.
Monitoring policies
Policies for monitoring the sources of events are displayed in the table under Sources status → Monitoring policies. You can sort the table by clicking the column header of the relevant setting. Clicking on a policy opens an information pane containing its settings that can be edited.
The following columns are available:
- Name—name of the monitoring policy.
- Lower limit—lower boundary of the permissible number of incoming events as indicated in the monitoring policy.
- Upper limit—upper boundary of the permissible number of incoming events as indicated in the monitoring policy.
- Interval—period taken into account by the monitoring policy.
- Type—type of monitoring policy:
- byCount—the monitoring policy tracks the number of incoming events.
- byEPS—the monitoring policy tracks the rate of incoming events.
- Tenant—the tenant that owns the monitoring policy.
To add a monitoring policy:
- In the KUMA web interface, under Sources status → Monitoring policies, click Add policy and define the settings in the opened window:
- In the Policy name field, enter a unique name for the policy you are creating. The name must contain from 1 to 128 Unicode characters.
- In the Tenant drop-down list, select the tenant that will own the policy. Your tenant selection determines the specific sources of events that can covered by the monitoring policy.
- In the Policy type drop-down list, select the method used to track incoming events: by rate or by number.
- In the Lower limit and Upper limit fields, define the boundaries representing normal behavior. Deviations outside of these boundaries will trigger the monitoring policy, create an alert, and forward notifications.
- In the Counting period field, specify the period during which the monitoring policy must take into account the data from the monitoring source. The maximum value is 14 days.
- If necessary, use the Email button to specify the email addresses that should receive notifications when the KUMA monitoring policy is triggered.
To forward notifications, you must configure a connection to the SMTP server.
- Click Add.
The monitoring policy will be added.
To remove a monitoring policy:
Select the relevant policy, click Delete policy and confirm this action.
You cannot remove preinstalled monitoring policies or policies that have been assigned to data sources.
Page top
Widgets
Widgets in KUMA are used to obtain analytics for the Dashboard and Reports.
Click on the title or legend of widgets for events, alerts or incidents to open the corresponding section of the KUMA web interface containing the widget data obtained using the section's filters and/or a search query. See below for more details. This functionality is not available while creating or editing layouts.
Widgets are organized into widget groups, each one related to the analytics type they provide. The following widget groups and widgets are available in KUMA:
- Events—widget for creating analytics based on events.
Click on the title of this widget to go to the Events section of the KUMA web interface. The SQL query specified in the widget is used to request events from the widget. The query is specified without grouping (except for table graphs) but takes into account the conditions indicated in the WHERE parameter. The LIMIT parameter in a query is equal to 250.
- Alerts—group for analytics related to alerts. Click on the title or legend of widgets in this group to go to the Alerts section of the KUMA web interface and view the widget data in detail.
The group includes the following widgets:
- Active alerts—number of alerts that have not been closed.
- Active alerts by tenant—number of unclosed alerts grouped by tenant.
- Alerts by tenant—number of alerts of all statuses, grouped by tenant.
- Unassigned alerts—number of alerts that have the New status.
- Alerts by assignee—number of assigned alerts grouped by their executor.
- Alerts by status—number of alerts grouped by status.
- Alerts by priority—number of unclosed alerts grouped by their priority.
- Alerts by rule—number of unclosed alerts grouped by correlation rule. For this widget, you cannot obtain detailed information by clicking on the widget title.
- Latest alerts—table containing the last 10 unclosed alerts.
- Alerts distribution—number of alerts created during the period indicated in the widget.
- Assets—group for analytics related to assets from processed events. This group includes the following widgets:
- Affected assets—table of alert-related assets showing the priority of the asset and the number of unclosed alerts related to it.
- Affected asset categories—categories of assets linked to unclosed alerts.
- Number of assets—number of assets that were added to KUMA.
- Incidents—group for analytics related to incidents. Click on the title or legend of widgets in this group to go to the Incidents section of the KUMA web interface and view the widget data in detail.
The group includes the following widgets:
- All incidents – the total number of incidents.
- Active incidents—number of incidents that have not been closed.
- Unassigned incidents—number of incidents that have the Opened status.
- Incidents distribution—number of incidents created during the period indicated in the widget.
- Incidents by assignee—number of incidents that have the Assigned status grouped by KUMA user.
- Incidents by status—number of incidents grouped by status.
- Incidents by priority—number of unclosed incidents grouped by their priority. Available types of diagrams: pie chart, bar graph.
- Active incidents by tenant—number of unclosed incidents grouped by tenant available to the user.
- All incidents by tenant—number of incidents of all statuses, grouped by tenant.
- Affected assets in incidents—number of assets in unclosed incidents. For this widget, you cannot obtain detailed information by clicking on the widget title.
- Affected assets categories in incidents—categories of the assets affected by unclosed incidents. Available types of diagrams: pie chart, bar graph. For this widget, you cannot obtain detailed information by clicking on the widget title.
- Affected Users in Incidents—users affected by incidents. Available types of diagrams: table, pie chart, bar graph. For this widget, you cannot obtain detailed information by clicking on the widget title.
- Latest incidents—last 10 unclosed incidents.
- Event sources—group for analytics related to sources of events. The group includes the following widgets:
- Top event sources by alerts number—number of unclosed alerts grouped by event source.
- Top event sources by convention rate—number of events that have an unclosed alert grouped by event source.
Due to optimized storage of events in alerts, the number of alerts created by event sources may be distorted in some cases. To obtain accurate statistics, it is recommended to specify the Device Product event field as unique in the correlation rule, and enable storage of all base events in a correlation event. However, correlation rules with these settings consume more resources.
- Users—group for analytics related to users from processed events. The group includes the following widgets:
- Affected users in alerts—number of users related to unclosed alerts.
- Number of AD users—number of Active Directory accounts received via LDAP during the period indicated in the widget.
Standard widgets
This section describes the settings of all widgets except the Events widget.
The available settings of widgets depend on the selected type of widget. The widget type is determined by its icon:
 —pie chart
 —counter
 —table
 and
and  —bar chart
Settings of pie charts, counters, and tables
The settings of pie charts, counters, and tables are located on the same tab. The available settings depend on the selected widget:
- Name—the field for the name of the widget. Must contain from 1 to 128 Unicode characters.
- Description—the field for the widget description. You can add up to 4000 Unicode characters describing the widget.
- Tenant—drop-down list for selecting the tenant whose data will be used to display analytics. The As layout setting is used by default.
- Period—drop-down list for configuring the time period for which the analytics must be displayed. Available options:
- As layout—when this option is selected, the widget time period value reflects the period that was configured for the layout. This option is selected by default.
- 1 hour—receive analytics for the previous hour.
- 1 day—receive analytics for the previous day.
- 7 days—receive analytics for the previous 7 days.
- 30 days—receive analytics for the previous 30 days.
- In period—receive analytics for the custom time period. The time period is set using the calendar that is displayed when this option is selected.
- Storage—drop-down list for selecting the storage whose events will be used to create analytics.
- Color—the drop-down list to select the color in which the information is displayed:
- Default—use your browser's default font color.
- green
- red
- blue
- yellow
- Horizontal—turn on this toggle switch if you want to use horizontal histogram instead of vertical. This toggle switch is turned off by default.
- Show legend—turn off this toggle switch if you don't want the widget to display the legend for the widget analytics. This toggle switch is turned on by default.
- Show nulls in legend—turn on this toggle switch if you want the legend for the widget analytics to include parameters with zero values. This toggle switch is turned off by default.
- Decimals—this field is used to specify how to round-off values. The default value is Auto.
Settings of bar graphs
The settings of bar graphs are located on two tabs. The available settings depend on the selected widget:
 —this tab is used to configure the chart scale. Available settings:
- The Y-min and Y-max fields are used to define the scale of the Y-axis. The Decimals field on the left is used to set the rounding parameter for the Y-axis values.
- The X-min and X-max fields are used to define the scale of the X-axis. The Decimals field on the right is used to control rounding of the X-axis values.
Negative values can be displayed on chart axes. This is due to the scaling of charts on the widget and can be fixed by setting zero as the minimum chart values instead of Auto.
 —this tab is used to configure the widget analytics display.
- Name—the field for the name of the widget. Must contain from 1 to 128 Unicode characters.
- Description—the field for the widget description. You can add up to 512 Unicode characters describing the widget.
- Tenant—drop-down list for selecting the tenant whose data will be used to display analytics.
- Period—drop-down list for configuring the time period for which the analytics must be displayed. Available options:
- As layout—when this option is selected, the widget time period value reflects the period that was configured for the layout. This option is selected by default.
- 1 hour—receive analytics for the previous hour.
- 1 day—receive analytics for the previous day.
- 7 days—receive analytics for the previous 7 days.
- 30 days—receive analytics for the previous 30 days.
- In period—receive analytics for the custom time period. The time period is set using the calendar that is displayed when this option is selected.
- Storage—drop-down list for selecting the storage whose events will be used to create analytics.
- Color—the drop-down list to select the color in which the information is displayed:
- default—use your browser default font color.
- green
- red
- blue
- yellow
- Horizontal—turn on this toggle switch if you want to use horizontal histogram instead of vertical. This toggle switch is turned off by default.
- Show legend—turn off this toggle switch if you don't want the widget to display the legend for the widget analytics. This toggle switch is turned on by default.
- Show nulls in legend—turn on this toggle switch if you want the legend for the widget analytics to include parameters with zero values. This toggle switch is turned off by default.
- Decimals—this field is used to specify how to round-off values. The default value is Auto.
Custom widget
You can use this widget to compose event searches and extract analytics from the results. Depending on the selected Graph type value, two or three parameter tabs are available:
 —this tab is used to define the widget type and to compose the search for the analytics.
- —this tab is used to configure the chart scale. This tab only available for graph types (see below) Bar chart, Line chart, Date Histogram.
- —this tab is used to configure the widget analytics display.
The following parameters are available for the tab:
- Graph—this drop-down list is used to select widget graph type. Available options:
- Pie chart
- Bar chart
- Counter
- Line chart
- Table
- Date Histogram
- Tenant—drop-down list for selecting the tenant whose data will be used to display analytics. The As dashboard setting is used by default.
- Time period—the drop-down list to configure the time period for which the analytics must be displayed. Available options:
- As dashboard—when this option is selected, the widget time period value reflects the period that was configured for the Dashboard. This option is selected by default.
- 1 hour—receive analytics for the previous hour.
- 1 day—receive analytics for the previous day.
- 7 days—receive analytics for the previous 7 days.
- 30 days—receive analytics for the previous 30 days.
- In period—receive analytics for the custom time period. The time period is set using the calendar that is displayed when this option is selected.
- Storage—the storage where the search should be performed.
- Event search group of settings consisting of Builder and SQL query tabs—this groups of settings is used to compose searches to extract data from events and to define how extracted data must be displayed in the widget.
- Builder—this tab contains the event search query parameters equivalent to event filter builder parameters:
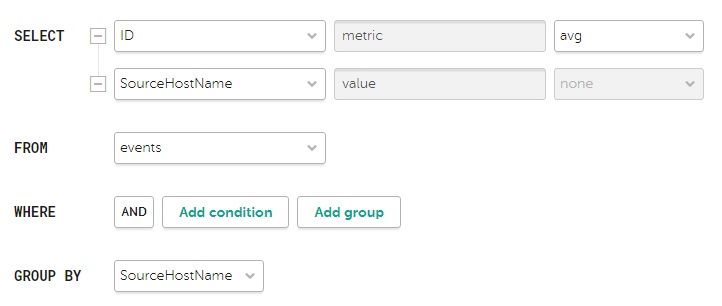
Search condition parameters for the widget showing average bytes received per host
- SELECT—use these fields to define event fields that must be extracted for analytics. The number of available fields depends on the selected widget graph type (see above).
In the left drop-down list you can select event fields from required for analytics.
The middle field displays what the selected field is used for in the widget: metric or value.
When the Table widget type is selected, the values in the middle fields become available for editing and are displayed as the names of columns. Only ANSII-ASCII characters can be used for values.
In the right drop-down list you can select how the metric type event field values must be processed for the widget:
- count—select this option to count events. This option is available only for the ID event field.
- max—select this option to display the maximum event field value from the event selection.
- min—select this option to display the minimum event field value from the event selection.
- avg—select this option to display the average event field value from the event selection.
- sum—select this option to display the sum of event field values from the event selection.
- FROM—this drop-down list is used to select data source type. Only events option is available for selection.
- WHERE—this group of settings is used to create search conditions:
In the left drop-down list you can select the event field you want to use as a filter.
In the middle drop-down list you can select the required operator. Available operators vary based on the chosen event field's value type.
In the right you can select or enter the value of the event field. Depending on the selected event field value type, you may have to input the value manually, select it in the drop-down list, or select it on the calendar.
You can add search conditions using the Add condition button or delete them using the button with the cross icon.
You can also add group conditions using the Add group button. By default, group conditions are added with the AND operator, but you can switch the operator between AND, OR, and NOT by clicking the operator name. Available values: AND, OR, NOT. Group conditions are deleted using the Delete group button.
- GROUP—this drop-down list is used to select the event fields for grouping events. This parameter is not available for Counter graph type.
- SORT—this drop-down list is used to define how the information from search results should be sorted in the widget. This parameter is not available for Date Histogram and Counter graph types.
In the left drop-down list you can select the value, metric or event field to use for sorting.
In the drop-down list on the right, you can select the sorting order: ASC for ascending or DESC for descending.
For Table graph types it is possible for add sorting conditions using the ADD COLUMN button.
- LIMIT—this field is used to set the maximum number of data points for the widget. This parameter is not available for Date Histogram and Counter graph types.
- SELECT—use these fields to define event fields that must be extracted for analytics. The number of available fields depends on the selected widget graph type (see above).
- SQL query—this tab contains a field to enter a search query equivalent to filtering events using SQL syntax.
- Builder—this tab contains the event search query parameters equivalent to event filter builder parameters:
The following parameters are available for the tab:
- The Y-min and Y-max fields are used to define the scale of the Y-axis. The Decimals field on the left is used to set the rounding parameter for the Y-axis values.
- The X-min and X-max fields are used to define the scale of the X-axis. The Decimals field on the right is used to control rounding of the X-axis values.
- Line-width and Point size fields are available for Line chart graph type and is used to configure the plot line.
The following parameters are available for the tab:
- Name—the field for the name of the widget. Must contain from 1 to 128 Unicode characters.
- Description—the field for the widget description. You can add up to 512 Unicode characters describing the widget.
- Color—the drop-down list to select the color in which the information is displayed:
- default—use your browser default font color.
- green
- red
- blue
- yellow
- Horizontal—turn on this toggle switch if you want to use horizontal histogram instead of vertical. This toggle switch is turned off by default.
- Show legend—turn off this toggle switch if you don't want the widget to display the legend for the widget analytics. This toggle switch is turned on by default.
- Show nulls in legend—turn on this toggle switch if you want the legend for the widget analytics to include parameters with zero values. This toggle switch is turned off by default.
- Decimals—the field to enter the number of decimals to which the displayed value must be rounded off. The default value is auto.
Working with tenants
Access to tenants is regulated in the settings of users. The general administrator has access to the data of all tenants. Only a user with this role can create and disable tenants.
Tenants are displayed in the table under Settings → Tenants in the KUMA web interface. You can sort the table by clicking on columns.
Available columns:
- Name—tenant name. The table can be filtered by this column.
- EPS limit—quota size for EPS (events processed per second) allocated to the tenant out of the overall EPS quota determined by the license.
- Description—description of the tenant.
- Disabled—indicates that the tenant is inactive.
By default, inactive tenants are not displayed in the table. You can view them by selecting the Show disabled check box.
- Created—tenant creation date.
To create a tenant:
- In the KUMA web interface under Settings → Tenants, click Add.
The Add tenant window opens.
- Specify the tenant name in the Name field. The name must contain from 1 to 128 Unicode characters.
- In the EPS limit field, specify the EPS quota for the tenant. The cumulative EPS of all tenants cannot exceed the EPS of the license.
- If necessary, add a Description of the tenant. The description can contain no more than 256 Unicode characters.
- Click Save.
The tenant will be added and displayed in the tenants table.
To disable or enable a tenant:
- In the KUMA web interface under Settings → Tenants, select the relevant tenant.
If the tenant is disabled and not displayed in the table, select the Show disabled check box.
- Click Disable or Enable.
When a tenant is disabled, its services are automatically stopped, it no longer receives or processes events, and the EPS of the tenant is no longer taken into account for the cumulative EPS of the license.
When a tenant is enabled, its services must be manually started.
Selecting a tenant
If you have access to multiple tenants, KUMA lets you select which tenants' data will be displayed in the KUMA web interface.
To select a tenant for displaying data:
- In the KUMA web interface, click Selected tenants.
The tenant selection area opens.
- Select the check boxes next to the tenants whose data you want to see in sections of the KUMA web interface.
- You must select at least one tenant. You can use the Search field to search for tenants.
- Click the tenant selection area by clicking Selected tenants.
Sections of the KUMA web interface will display only the data and analytics related to the selected tenants.
Your selection of tenants for data display will determine which tenants can be specified when creating resources, services, layouts, report templates, widgets, incidents, assets, and other KUMA settings that let you select a tenant.
Page top
Tenant affiliation rules
Tenant inheritance rules
It is important to track which tenant owns specific objects created in KUMA because this determines who will have access to the objects and whether or not interaction with specific objects can be configured. Tenant identification rules:
- The tenant of an object (such as a service or resource) is determined by the user when the object is created.
After the object is created, the tenant selected for that object cannot be changed. However, resources can be exported then imported into another tenant.
- The tenant of an alert and correlation event is inherited from the correlator that created them.
The tenant name is indicated in the
TenantIdevent field. - If events of different tenants that are processed by the same correlator are not merged, the correlation events created by the correlator inherit the tenant of the event.
- The incident tenant is inherited from the alert.
Examples of multitenant interactions
Multitenancy in KUMA provides the capability to centrally investigate alerts and incidents that occur in different tenants. Below are some examples that illustrate which tenants own certain objects that are created.
When correlating events from different tenants in a common stream, you should not group events by tenant. In other words, the TenantId event field should not be specified in the Identical fields field in correlation rules. Events must be grouped by tenant only if you must not merge events from different tenants.
Services that must be accommodated by the capacities of the main tenant can be deployed only by a user with the general administrator role.
- Correlation of events for one tenant, correlator is allocated for this tenant and deployed at the tenant
- Correlation of events for one tenant, correlator is allocated for this tenant and deployed at the main tenant
- Centralized correlation of events received from different tenants
- The tenant correlates its own events, but the main tenant additionally provides centralized correlation of events.
- One correlator for two tenants
Working with incidents
In the Incidents section of the KUMA web interface, you can create, view and process incidents. You can also filter incidents if needed. Clicking the name of an incident opens a window containing information about the incident.
Displayed date format:
- English localization: YYYY-MM-DD.
- Russian localization: DD.MM.YYYY.
About the incidents table
The main part of the Incidents section shows a table containing information about registered incidents. If required, you can change the set of columns and the order in which they are displayed in the table.
How to customize the incidents table
- Click the icon in the top right corner of the incidents table.
The table customization window opens.
- Select the check boxes opposite the settings that you want to view in the table.
When you select a check box, the events table is updated and a new column is added. When a check box is cleared, the column disappears.
You can search for table parameters using the Search field.
By pressing the Default button, the following columns are selected for display:
- Name.
- Threat duration.
- Assigned.
- Created.
- Tenant.
- Status.
- Alerts number.
- Priority.
- Affected asset categories.
- Change the display order of the columns as needed by dragging the column headings.
- If you want to sort the incidents by a specific column, click its title and select one of the available options in the drop-down list: Ascending or Descending.
- To filter incidents by a specific parameter, click on the column header and select the required filters from the drop-down list. The set of filters available in the drop-down list depends on the selected column.
- To remove filters, click the relevant column heading and select Clear filter.
Available columns of the incidents table:
- Name—the name of the incident.
- Threat duration—the time span during which the incident occurred (the time between the first and the last event related to the incident).
- Assigned to—the name of the security officer to whom the incident was assigned for investigation or response.
- Created—the date and time when the incident was created. This column allows you to filter incidents by the time they were created.
- The following preset periods are available: Today, Yesterday, This week, Previous week.
- If required, you can set an arbitrary period by using the calendar that opens when you select Before date, After date, or In period.
- Tenant—the name of the tenant that owns the incident.
- Status—current status of the incident:
- Opened—new incident that has not been processed yet.
- Assigned—the incident has been processed and assigned to a security officer for investigation or response.
- Closed—the incident is closed; the security threat has been resolved.
- Alerts number—the number of alerts included in the incident. Only the alerts of those tenants to which you have access are taken into account.
- Priority shows how important a possible security threat is: Critical
 , High
  , Medium
  , Low
, Low  .
. - Affected asset categories—categories of alert-related assets with the highest priority. No more than three categories are displayed.
- Updated—the date and time of the last change made in the incident.
- First event time and Last event time—dates and times of the first and last events in the incident.
- Incident category and Incident type—category and type of threat assigned to the incident.
- Export to RuCERT—the status of the export of the incident data to the National Coordinating Center for Computer Incidents (also known as RuCERT):
- Not exported—the data was not forwarded to RuCERT.
- Export failed—an attempt to forward data to RuCERT ended with an error, and the data was not transmitted.
- Exported—data on the incident has been successfully transmitted to RuCERT.
- Branch—data on the specific node where the incident was created. Incidents of your node are displayed by default. This column is displayed only when hierarchy mode is enabled.
In the Search field, you can enter a regular expression for searching incidents based on their related assets, users, tenants, and correlation rules. Parameters that can be used for a search:
- Assets: name, FQDN, IP address.
- Active Directory accounts: attributes displayName, SAMAccountName, and UserPrincipalName.
- Correlation rules: name.
- KUMA users who were assigned alerts: name, login, email address.
- Tenants: name.
When filtering incidents based on a specific parameter, the corresponding column in the incidents table is highlighted in yellow.
Page top
Saving and selecting incident filter configuration
In KUMA, you can save changes to incident table settings as filters. Filter configurations are saved on the KUMA Core server and are available to all KUMA users of the tenant for which they were created.
To save the current filter settings:
- In the Incidents section of KUMA, open the Select filter drop-down list.
- Select Save current filter.
A window will open for entering the name of the new filter and selecting the tenant that will own the filter.
- Enter a name for the filter configuration. The name must be unique for alert filters, incident filters, and event filters.
- In the Tenant drop-down list, select the tenant that will own the filter and click Save.
The filter configuration is now saved.
To select a previously saved filter configuration:
- In the Incidents section of KUMA, open the Select filter drop-down list.
- Select the configuration you want.
The filter configuration is now active.
You can select the default filter by putting an asterisk to the left of the required filter configuration name in the Filters drop-down list.
To reset the current filter settings:
open the Filters drop-down and select Clear filter.
Deleting incident filter configurations
To delete a previously saved filter configuration:
- In the Incidents section of KUMA, open the Filters drop-down list.
- Click the button next to the configuration you want to delete.
- Click OK.
The filter configuration is now deleted for all KUMA users.
Page top
Viewing detailed incident data
In the incident window, you can view the details of an incident.
To view the details of an incident,
in the KUMA web interface open the Incidents section and select the incident.
An incident window opens with details of the incident. Some incident parameters are editable.
The top of the incident window displays a toolbar and the name of the user to whom the incident was assigned. In this window, you can process the incident: assign it to a user, combine it with another incident, or close it.
The Description section contains the following data:
- Created—the date and time when the incident was created.
- Name—the name of the incident.
You can change the name of an incident by entering a new name in the field and clicking Save The name must contain from 1 to 128 Unicode characters.
- Tenant—the name of the tenant that owns the incident.
The tenant can be changed by selecting the required tenant from the drop-down list and clicking Save
- Status—current status of the incident:
- Opened—new incident that has not been processed yet.
- Assigned—the incident has been processed and assigned to a security officer for investigation or response.
- Closed—the incident is closed; the security threat has been resolved.
- Priority—the severity of the threat posed by the incident. Possible values:
- Critical
- High
- Medium
- Low
Priority can be changed by selecting the required value from the drop-down list and clicking Save
- Affected asset categories—the assigned categories of assets associated with the incident.
- First event time and Last event time—dates and times of the first and last events in the incident.
- Type and Category—type and category of the threat assigned to the incident. You can change these values by selecting the relevant value from the drop-down list and clicking Save.
- Export to RuCERT—information on whether or not this incident was exported to RuCERT.
- Description—description of the incident.
To change the description, edit the text in the field and click Save The description can contain no more than 256 Unicode characters.
- Related tenants—tenants associated with incident-related alerts, assets, and users.
- Available tenants—tenants whose alerts can be linked to the incident automatically.
The list of available tenants can be changed by checking the boxes next to the required tenants in the drop-down list and clicking Save
The Related alerts section contains a table of alerts related to the incident. When you click on the alert name, a window opens with detailed information about this alert
The Related endpoints and Related users sections contain tables with data on assets and users related to the incident. This information comes from alerts that are related to the incident.
You can add data to the tables in the Related alerts, Related endpoints and Related users sections by clicking the Link button in the appropriate section and selecting the object to be linked to the incident in the opened window. If required, you can unlink objects from the incident. To do this, select the objects as required, click Unlink in the section to which they belong, and save the changes. If objects were automatically added to the incident, they cannot be unlinked until the alert mentioning those objects is unlinked.
The Change log section contains a record of the changes you and your users made to the incident. Changes are automatically logged, but it is also possible to add comments manually.
Page top
Incident creation
To create an incident:
- Open the KUMA web interface and select the Incidents section.
- Click Create incident.
The window for creating an incident will open.
- Fill in the mandatory parameters of the incident:
- In the Name field enter the name of the incident. The name must contain from 1 to 128 Unicode characters.
- In the Tenant drop-down list, select the tenant that owns the created incident.
- If necessary, provide other parameters for the incident:
- In the Priority drop-down list, select the severity of the incident. Available options: Low, Medium, High, Critical.
- In the First event time and Last event time fields, specify the time range in which events related to the incident were received.
- In the Category and Type drop-down lists, select the category and type of the incident. The available incident types depend on the selected category.
- Add the incident Description. The description can contain no more than 256 Unicode characters.
- In the Available tenants drop-down list, select the tenants whose alerts can be linked to the incident automatically.
- In the Related alerts section, add alerts related to the incident.
- In the Related endpoints section, add assets related to the incident.
- In the Related Users section, add users related to the incident.
- Add a Comment to the incident.
- Click Save.
The incident has been created.
Page top
Incident processing
You can assign an incident to a user, aggregate it with other incidents, or close it.
To process an incident:
- Select required incidents using one of the methods below:
- In the Incidents section of the KUMA web interface, click on the incident to be processed.
The incident window will open, displaying a toolbar on the top.
- In the Incidents section of the KUMA web console, select the check box next to the required incidents.
A toolbar will appear at the bottom of the window.
- In the Incidents section of the KUMA web interface, click on the incident to be processed.
- In the Assign to drop-down list, select the user to whom you want to assign the incident.
You can assign the incident to yourself by selecting Me.
The status of the incident changes to assigned and the name of the selected user is displayed in the Assign to drop-down list.
- If required, edit the incident parameters
- After investigating, close the incident:
- Click Close
A confirmation window opens.
- Select the reason for closing the incident:
- Approved. This means the appropriate measures were taken to eliminate the security threat.
- Not approved. This means the incident was a false positive and the received events do not indicate a security threat.
- Click Close
The Closed status will be assigned to the incident. Incidents with this status cannot be edited, and they are displayed in the incidents table only if you selected the Closed check box in the Status drop-down list when filtering the table. You cannot change the status of a closed incident or assign it to another user, but you can aggregate it with another incident.
- Click Close
- If requited, aggregate the selected incidents with another incident:
- Click Merge. In the opened window, select the incident in which all data from the selected incidents should be placed.
- Confirm your selection by clicking Merge.
The incidents will be aggregated.
The incident has been processed.
Page top
Changing incidents
To change the parameters of an incident:
- In the Incidents section of the KUMA web interface, click on the incident you want to modify.
The Incident window opens.
- Make the necessary changes to the parameters. All incident parameters that can be set when creating it are available for editing.
- Click Save.
The incident will be modified.
Page top
Automatic linking of alerts to incidents
In KUMA, you can configure automatic linking of generated alerts to existing incidents if alerts and incidents have related assets or users in common. If this setting is enabled, when creating an alert the program searches for incidents falling into a specified time interval that includes assets or users from the alert. In addition, the program checks whether the generated alert pertains to the tenants specified in the incidents' Available tenants parameter. If a matching incident is found, the program links the generated alert to the incident it found.
To set up automatic linking of alerts to incidents:
- In the KUMA web interface, open Settings → Incidents → Automatic linking of alerts to incidents.
- Select the Enable check box in the Link by assets and/or Link by accounts parameter blocks depending on the types of connections between incidents and alerts that you are looking for.
- Define the Incidents must not be older than value for the parameters that you want to use when searching links. The generated alerts will be compared with incidents no older than the specified interval.
Automatic linking of alerts to incidents is configured.
To disable automatic linking of alerts to incidents,
In the KUMA web interface, under Settings → Incidents → Automatic linking of alerts to incidents, select the Disabled check box.
Page top
Categories and types of incidents
For your convenience, you can assign categories and types. If an incident has been assigned a RuCERT category, it can be exported to RuCERT.
Categories and types of incidents that can be exported to RuCERT
The categories of incidents can be viewed or changed under Settings → Incidents → Incident types, in which they are displayed as a table. By clicking on the column headers, you can change the table sorting options. The resource table contains the following columns:
- Category—a common characteristic of an incident or cyberattack. The table can be filtered by the values in this column.
- Type—the class of the incident or cyberattack.
- RuCERT category—incident type according to RuCERT nomenclature. Incidents that have been assigned custom types and categories cannot be exported to RuCERT. The table can be filtered by the values in this column.
- Vulnerability—specifies whether the incident type indicates a vulnerability.
- Created—the date the incident type was created.
- Updated—the date the incident type was modified.
To add an incident type:
- In the KUMA web interface, under Settings → Incidents → Incident types, click Add.
The incident type creation window will open.
- Fill in the Type and Category fields.
- If the created incident type matches the RuCERT nomenclature, select the RuCERT category check box.
- If the incident type indicates a vulnerability, check Vulnerability.
- Click Save.
The incident type has been created.
Page top
Exporting incidents to RuCERT
Incidents created in KUMA can be exported to the National Coordinating Center for Computer Incidents (also known as RuCERT). Prior to exporting incidents, you must configure integration with RuCERT. An incident can be exported only once.
You can export incidents to RuCERT only if your application license includes the GosSOPKA module (GosSOPKA is a Russian government system for the detection, prevention, and mitigation of computer attacks).
To export an incident to RuCERT:
- In the Incidents section of the KUMA web interface, select the incident that you want to export using one of the following ways:
- Select the check box next to the relevant incident.
- Open the relevant incident.
- Click Export to RuCERT.
This opens the export settings window.
- Specify the settings on the Basic tab of the Export to RuCERT window:
- Category and Type—specify the type and category of the incident. Only incidents of specific categories and types can be exported to RuCERT.
Categories and types of incidents that can be exported to RuCERT
- TLP (required)—assign a Traffic Light Protocol marker to an incident to define the nature of information about the incident. The default value is RED. Available values:
- WHITE—disclosure is not restricted.
- GREEN—disclosure is only for the community.
- AMBER—disclosure is only for organizations.
- RED—disclosure is only for a specific group of people.
- Affected system name (required)—specify the name of the information resource where the incident occurred. You can enter up to 500,000 characters in the field.
- Affected system category (required)—specify the critical information infrastructure (CII) category of your organization. If your organization does not have a CII category, select Information resource is not a CII object.
- Affected system function (required)—specify the scope of activity of your organization. The value specified in RuCERT integration settings is used by default.
- Location (required)—select the location of your organization from the drop-down list.
- Affected system has Internet connection—select this check box if the assets related to this incident have an Internet connection. In addition, after completing an export in the GosSOPKA account dashboard, provide technical information about the computer incident, computer attack, or vulnerability in the notification card. By default, this check box is cleared.
- Product info (required)—this table becomes available if you selected Notification about a detected vulnerability as the incident category.
You can use the Add new element button to add a string to the table. In the Name column, you must indicate the name of the application (for example,
MS Office). Specify the application version in the Version column (for example,2.4). - Vulnerability ID—if necessary, specify the identifier of the detected vulnerability. For example,
CVE-2020-1231.This field becomes available if you selected Notification about a detected vulnerability as the incident category.
- Name and version of vulnerable product—if necessary, specify the name and version of the vulnerable product. For example,
Microsoft operating systems and their components.This field becomes available if you selected Notification about a detected vulnerability as the incident category.
- Category and Type—specify the type and category of the incident. Only incidents of specific categories and types can be exported to RuCERT.
- If required, define the settings on the Advanced tab of the Export to RuCERT window.
The available settings on the tab depend on the selected category and type of incident:
- Detection tool—specify the name of the product that was used to register the incident. For example,
KUMA 1.5. - Assistance required—select this check box if you need help from GosSOPKA employees.
- Incident end time—leave this field empty. You can use your personal GosSOPKA dashboard to indicate the date and time when the standard operating mode of the controlled information resource (CII object) was restored after the computer incident, when the computer attack was ended, or when the vulnerability was fixed.
If you fill in the incident end time field, you will not be able to export data on this incident to RuCERT.
- Availability impact—assess the degree of impact that the incident had on system availability:
- High
- Low
- None
- Integrity impact—assess the degree of impact that the incident had on system integrity:
- High
- Low
- None
- Confidentiality impact—assess the degree of impact that the incident had on data confidentiality:
- High
- Low
- None
- Custom impact—specify other significant impacts from the incident.
- City—indicate the city where your organization is located.
- Detection tool—specify the name of the product that was used to register the incident. For example,
- Click Export.
- Confirm the export.
Information about the incident is submitted to RuCERT, and the Export to RuCERT incident parameter is changed to Exported successfully. If changes need to be made to the exported incident, you should do this in your GosSOPKA account dashboard.
Page top
Working in hierarchy mode
When multiple KUMA instances are deployed in various organizations, they may be merged into a hierarchical structure. Interaction between parent and child instances of KUMA (or nodes) provides the following capabilities:
- Child KUMA nodes relay data on other descendant nodes to parent KUMA nodes. This enables the parent node to see its entire branch of the hierarchical tree.
- Parent KUMA nodes receive data on incidents from descendant nodes, and can also receive data on incident-related alerts and events if the corresponding settings are enabled in a child node.
- Child KUMA nodes possess data only on their own parent KUMA node.
Parent and child nodes interact via API. Authentication relies on self-signed certificates, which the administrators of the parent and child organization must exchange when they connect to each other.
One parent node can have more than one child node. A child node can be connected to only one parent node. A parent node cannot be a child node of its descendants.
General administrator users can configure hierarchy mode in the KUMA web interface under Settings → Hierarchy:
- On the Node profile tab, you can configure the profile of your node, create a certificate, and enable or disable hierarchy mode.
- On the Structure tab, you can view your available branch of the hierarchical tree, change the connected nodes, or disconnect them.
- You can connect parent and child nodes on either of these tabs.
Incidents of child nodes can be viewed by users of all roles in the KUMA web interface under Incidents. In incidents, you can obtain information about their related alerts, events, assets, and users.
Enabling hierarchy mode for the first time
When enabling hierarchy mode for the first time, you must complete the profile of your node.
To complete the profile of your node:
- In the KUMA web interface, open Settings → Hierarchy → Node profile.
- In the Organization name field, indicate the name of your company (1–128 characters). This name will be used for the name of your node in the hierarchy.
To change the organization name, you will have to regenerate the certificate of your node and replace it on the nodes that you are connected to.
- In the FQDN field, specify the FQDN of your node.
- If necessary, use the Proxy drop-down list to select the proxy server resource that should be used to communicate with other nodes. You can create a proxy server by using the button. The selected proxy server can be changed by clicking the button.
The user account credentials entered into the proxy server URL can contain only the following characters: letters of the English alphabet, numbers, and special characters ("-", ".", "_", ":", "~", "!", "$", "&", "\", "(", ")", "*", "+", ",", ";", "=", "%", "@"). The URL in the proxy server resource is indicated by using the secret resource, which is selected from the Use URL from the secret drop-down list.
- Click Generate certificate.
The profile of your KUMA node is complete and hierarchy mode is enabled. When hierarchy mode is enabled, a certificate is automatically created for authentication of your node. You can use the  icon to download the certificate and then forward it to other nodes over an encrypted channel to create a connection between these nodes.
Creating a node certificate
Nodes in the hierarchy are authenticated using self-signed certificates of the nodes. A certificate contains the name of the organization and its FQDN.
The certificate is created when hierarchy mode is enabled, but you can also recreate a certificate if necessary. The certificate must be recreated whenever you change the name of a node or its FQDN.
To create a node certificate:
- In the KUMA web interface, open Settings → Hierarchy → Node profile.
You will see a window containing the settings of your node in the hierarchy.
- Click the Generate certificate button.
The certificate creation window opens.
- In the FQDN field, specify the FQDN of your node.
- In the Organization name field, indicate the name of your company (1–128 characters). This name will be used for the name of your node in the hierarchy.
- Close the window by clicking Save.
The node certificate will be created and can be downloaded by clicking the icon. Then it can be transferred to other nodes over an encrypted channel to create a connection between these nodes.
Connecting nodes into a hierarchical structure
Prior to connecting nodes, you should make sure that they have hierarchy mode enabled, their node profiles have been configured, and certificates have been created for the nodes. Parent and child nodes must exchange their certificates over encrypted communication channels.
Connection of nodes in a hierarchy consists of the following steps:
- The child node connects to the parent node.
- The parent node connects the child node.
Prior to connecting nodes, make sure that the system time on the machines is synchronized with the NTP server. For more details, please refer to the appropriate documentation for Oracle Linux and for Astra Linux Special Edition.
When a connection is established, the parent node polls its child nodes for their available hierarchy data every 5 minutes, and thereby identify the structure of their available branch of the hierarchical tree. This data is displayed in the KUMA web interface under Settings → Hierarchy → Structure after the web page is refreshed.
Information about the hierarchical structure can be manually refreshed by using the Update structure button. To display the updated data, you must refresh the page of your web browser.
Connecting to a parent node
To connect to a parent node:
- In the KUMA web interface, open Settings → Hierarchy and click the Add parent node button.
The Connect to parent node window opens.
- Use the Upload certificate button to upload the certificate to KUMA.
The window will display a description of the certificate and indicate the organization that issued it and its FQDN.
- If necessary, use the Port field to specify the port used for accessing the parent node.
- Click Save.
You are now connected to the parent node. It can now add your node as a child node so that it will receive data on your child nodes and view your incidents.
Connecting a child node
If you connected a parent node, you will be able to add child nodes only after your parent node adds you as a child node. Prior to connecting a child node, make sure that it has added your node as the parent node.
To connect a child node:
- In the KUMA web interface, open Settings → Hierarchy and click the Add child node button.
The Connect to child node window opens.
- Use the Upload certificate button to upload the certificate of the child node to KUMA.
The window will display a description of the certificate and indicate the organization that issued it and its FQDN.
- If necessary, use the Port field to specify the port used for accessing the child node.
- Click Save.
The child node is added and displayed on the Settings → Hierarchy → Structure tab. This tab also displays the descendants of the child node. You can view the incidents of your child nodes and their descendants.
Disconnecting a node
You can disconnect from a parent node or child node. However, it is impossible to disconnect from nodes that are descendants of your child nodes.
To disconnect from a node:
- In the KUMA web interface, open Settings → Hierarchy and select the Structure tab.
The hierarchical structure will be displayed.
- Select the node that you want to disconnect from.
The right side of the window will display the details area containing information about this node.
- Click Disconnect.
You have disconnected from the node. If you have disconnected from a parent node, it will no longer receive information about your child nodes and incidents. If you have disconnected from a child node, you will no longer receive information about its child nodes and its incidents.
Changing a node
If the name and/or FQDN of a node has changed, this node must reissue a certificate. Then the procedure for connecting the nodes must be repeated. Outdated nodes must be disconnected.
The port for connecting to nodes can be changed in the details area of the node without reissuing a certificate.
To change the settings for connecting to a node:
- In the KUMA web interface, open the Structure tab under Settings → Hierarchy and select the relevant node.
The right side of the window will display the details area of the node.
- In the Port field, enter the required port.
- Change the settings for email notifications regarding incidents on the child node:
- If you need to disable notifications, clear the Track incidents check box.
- If you need to enable notifications, select the Track incidents check box and use the input field to add the necessary email addresses.
To send email notifications, you need to configure a connection to the SMTP server.
- Click Save.
The node connection settings have been changed.
Page top
Errors when connecting nodes
Errors that occur when connecting nodes may be incompletely displayed in the KUMA web interface. You can use the developer's console of your browser to view the full server report.
The table below lists the errors that may arise when connecting KUMA nodes into a hierarchy, and includes recommendations on resolving those errors.
Errors that occur when establishing a connection to a node are displayed in pop-up windows in the lower part of the screen. Errors in already connected nodes can be viewed in the KUMA web interface under Settings → Hierarchy → Structure. The error text is displayed when you move your mouse cursor over the red triangle icon next to the node that encountered the error.
Error message |
Possible cause of the error |
Recommended remediation |
|
Connection refused. There was an attempt to add a child node that did not add the certificate of the parent node. |
|
|
You cannot generate a cyclical structure out of KUMA nodes. |
Make sure that the hierarchical structure you are creating is a tree structure. |
|
Invalid certificate. |
You must check the certificate file. |
|
Connection could not be established due to exceeded response timeout. |
Verify that the child node machine is running. |
|
Connection refused due to invalid certificate. |
|
|
Connection refused due to invalid certificate. |
Make sure that the parent node certificate is valid. |
|
Child node certificate contains a non-existent FQDN. |
Make sure that the child node certificate is valid. |
|
This node already exists within the structure. |
Check the hierarchical structure that you are trying to build. |
|
|
Do not connect a parent node that is already a child node within this hierarchy. |
|
Child node deleted the parent. |
The child node must connect the parent node. |
|
Invalid ports are indicated in node connection settings. |
Make sure that the correct port is indicated in the node settings and that a valid certificate is being used. |
|
Connecting to a node using wrong proxy server settings. |
Make sure correct proxy server settings are used. |
Viewing your own branch of the hierarchy and available nodes
In the KUMA web interface, under Settings → Hierarchy, select the Structure tab to view your branch of the hierarchical tree extending from the parent node to all descendants of its child nodes. Your node in the hierarchy is highlighted in green.
When you click a node of the branch, the right side of the window shows the node details area in which you can do the following:
- Change the port for connecting to the parent node or child node.
- Disable a parent node or child node.
- Change the settings of email notifications regarding incidents for child nodes and their descendants.
Editing a node profile
You can modify the profile settings of your node.
To change the settings of your node:
- In the KUMA web interface, open Settings → Hierarchy → Node profile.
- If necessary, use the Proxy drop-down list to select the proxy server resource that should be used to communicate with other nodes. You can create a proxy server by using the button. The selected proxy server can be changed by clicking the button.
The user account credentials entered into the proxy server URL can contain only the following characters: letters of the English alphabet, numbers, and special characters ("-", ".", "_", ":", "~", "!", "$", "&", "\", "(", ")", "*", "+", ",", ";", "=", "%", "@"). The URL in the proxy server resource is indicated by using the secret resource, which is selected from the Use URL from the secret drop-down list.
- If necessary, use the Port field to enter the port used for accessing your node. Make sure that access to the port is open.
- If necessary, use the Timeout field to indicate how many seconds to wait for a response from nodes when attempting a connection. The default value is 60.
- If necessary, select or clear the following check boxes: Do not include events to the incidents relayed to parent nodes or Do not include alerts to the incidents relayed to parent nodes. These check boxes are cleared by default.
- Click Save.
The settings of your node are changed.
If you want to change the FQDN or name of your node, regenerate a certificate for the node.
Page top
Viewing incidents from descendant nodes
If hierarchy mode is enabled, you can view the Incidents section to inspect the incidents that were created on child nodes and their descendants. The incidents table displays the Branch column, which can be used to filter incidents based on the nodes in which they were created. By default, the incidents table displays the incidents that were created on your node.
To select the nodes whose incidents you want to view:
- In the KUMA web interface, open the Incidents section.
- Click the header of the Branch column and click the icon in the opened window.
The right side of the window will display the details area containing the hierarchical structure of the organization. You can use the
 button to expand or collapse all branches of the structure, or select all KUMA nodes.
 - Select the relevant nodes and click Save.
The incidents table displays the incidents that were created on the nodes that you selected.
When you click an incident, a window opens with detailed information about the incident. The data is read-only. An incident from another node cannot be edited or processed.
Special considerations when viewing data on an incident created on a different node:
- The Related alerts section of the incident window contains information only if the child node is configured to forward data on incident-related alerts to the parent node.
When you click on the name of an incident-related alert, a window opens with detailed information about this alert. This data is also read-only. An alert from another node cannot be edited or processed.
- The Related events section in the window of an alert related to an incident of another node contains information only if the child node is configured to forward data on incident-related events to the parent node.
In this case, you can use the Find in events button to open the events table and search for relevant events. However, you cannot select the storage, and there are limitations applied to SQL queries when searching events in drilldown analysis mode. This mode employs data enrichment (for example, using Kaspersky Threat Intelligence Portal, Kaspersky CyberTrace or Active Directory). The results of Kaspersky Threat Intelligence Portal data enrichment performed on child nodes are not available on parent nodes.
Enabling and disabling hierarchy mode
To enable or disable hierarchy mode:
- In the KUMA web interface, open Settings → Hierarchy → Node profile.
- Enable or disable hierarchy mode:
- If you want to enable hierarchy mode, clear the Disabled check box.
- If you want to disable hierarchy mode, select the Disabled check box.
- Click Save.
Hierarchy mode will be enabled or disabled according to your selection.
Page top
Working with alerts
In the Alerts section of the KUMA web interface, you can view and process the alerts registered by the program. Alerts can be filtered. When you click the alert name, a window with its details opens.
Displayed date format:
- English localization: YYYY-MM-DD.
- Russian localization: DD.MM.YYYY.
Alert overflow
Each alert and its related events cannot exceed the size of 16 MB. When this limit is reached:
- New events can no longer be linked to the alert.
- The alert has an Overflowed tag displayed in the Detected column. The same tag is displayed in the Details on alert section of the alert details window.
Overflowed alerts should be processed as soon as possible.
Filtering alerts
In KUMA, you can perform alert selection by using the filtering and sorting tools in the Alerts section.
The filter configuration can be saved. Existing filter configurations can be deleted.
Configuring alerts table
The main part of the Alerts section shows a table containing information about registered alerts. You can click column titles to open drop-down lists with tools for filtering alerts and configuring alert table:
- Priority (
 )—shows the importance of a possible security threat: Critical , High , Medium , or Low .
 - Name—alert name.
If Overflowed tag is displayed next to the alert name, it means the alert size has reached or is about to reach the limit and should be processed as soon as possible.
- Status—current status of an alert:
- New—a new alert that hasn't been processed yet.
- Assigned—the alert has been processed and assigned to a security officer for investigation or response.
- Closed—the alert was closed. Either it was a false alert, or the security threat was eliminated.
- Escalated—an incident was generated based on this alert.
- Assigned to—the name of the security officer the alert was assigned to for investigation or response.
- Incident—name of the incident to which this alert is linked.
- First seen—the date and time when the first correlation event of the event sequence was created, triggering creation of the alert.
- Last seen—the date and time when the last correlation event of the event sequence was created, triggering creation of the alert.
- Categories—categories of alert-related assets with the highest priority. No more than three categories are displayed.
- Tenant—the name of the tenant that owns the alert.
In the Search field, you can enter a regular expression for searching alerts based on their related assets, users, tenants, and correlation rules. Parameters that can be used for a search:
- Assets: name, FQDN, IP address.
- Active Directory accounts: attributes displayName, SAMAccountName, and UserPrincipalName.
- Correlation rules: name.
- KUMA users who were assigned alerts: name, login, email address.
- Tenants: name.
When filtering alerts based on a specific parameter, the corresponding header of the alerts table is highlighted in yellow.
Page top
Saving and selecting alert filter configurations
In KUMA, you can save changes to the alert table settings as filters. Filter configurations are saved on the KUMA Core server and are available to all KUMA users of the tenant for which they were created.
To save the current filter settings:
- In the Alerts section of KUMA open the Filters drop-down list.
- Select Save current filter.
A field will appear for entering the name of the new filter and selecting the tenant that will own it.
- Enter a name for the filter configuration. The name must be unique for alert filters, incident filters, and event filters.
- In the Tenant drop-down list, select the tenant that will own the filter and click Save.
The filter configuration is now saved.
To select a previously saved filter configuration:
- In the Alerts section of KUMA open the Filters drop-down list.
- Select the configuration you want.
The filter configuration is now active.
You can select the default filter by putting an asterisk to the left of the required filter configuration name in the Filters drop-down list.
To reset the current filter settings:
Open the Filters drop-down list and select Clear filters.
Page top
Deleting alert filter configurations
To delete a previously saved filter configuration:
- In the Alerts section of KUMA open the Filters drop-down list.
- Click the button near configuration you want to delete.
- Click OK.
The filter configuration is now deleted for all KUMA users.
Page top
Alert window
In this window you can take a closer look at a specific alert and all the data related to it.
To see alert details,
In the Alerts section of the KUMA web interface, click the alert whose information you want to view.
The alert window opens with the alert name displayed in the top left corner of the window.
The upper part of the alert details window contains a toolbar and shows the alert priority and the user name to which the alert is assigned. Here you can process the alert: change its priority, assign it to a user, and close and create an incident using it.
The Details on alert section of the alert window contains the following data:
- Correlation rule priority—the priority of the correlation rule that triggered the creation of this alert.
- Max asset category priority—the highest priority of an asset category assigned to assets related to this alert. If multiple assets are related to the alert, the largest value is displayed.
- Linked to incident—if the alert is linked to an incident, its name and status are displayed here.
- First seen—the date and time when the first correlation event of the event sequence was created, triggering creation of the alert.
- Last seen—the date and time when the last correlation event of the event sequence was created, triggering creation of the alert.
- Alert ID—the unique identifier of an alert in KUMA.
- Tenant—the name of the tenant that owns the alert.
- Correlation rule—the name of the correlation rule that triggered the creation of this alert. The rule name is represented as a link that can be used to open the settings of this correlation rule.
- Overflowed—this tag means that the alert size has reached or will soon reach the limit and should be processed as soon as possible. Events are not added to the overflowed alerts, but you can get selection of the events that would be related to the alert if there were no alert size limit by clicking the All possible related events link.
The Related events section of the alert window contains the table of events related to the alert. If you click ![]() icon near the correlation rule, the base events from this correlation rule will be displayed. Events can be sorted by priority and time.
icon near the correlation rule, the base events from this correlation rule will be displayed. Events can be sorted by priority and time.
When an event is selected, the details area opens in the right part of the web interface window. This area contains information about the selected event. If a correlation event is selected, this area also contains the Detailed view button that opens the correlation event window.
The Find in events links below correlation events and the Find in events button to the right of the section header are used for drilldown analysis.
The Related endpoints section of the alert window contains the table of hosts related to the alert. This information comes from events that are related to the alert. You can search for endpoints by using the Search for IP addresses or FQDN field. Assets can be sorted using the Count and Endpoint columns.
If assets are related to the alert, they are displayed in this section. Clicking the name of the asset opens the Asset details window.
The Related users section of the alert window contains the table of users related to the alert. This information comes from events that are related to the alert. You can search for users using the Search for users field. Users can be sorted by the Count, User, User principal name and Email columns.
The Change log section of the alert window contains entries about changes made to the alert by users. Changes are automatically logged, but it is also possible to add comments manually. Comments can be sorted by using the Time column.
To add a comment to an alert,
In the alert window, enter the comment to the Comment field and click Add.
Page top
Processing alerts
You can change the alert priority, assign an alert to a user, close the alert, or create an incident based on the alert.
To process an alert:
- Select required alerts using one of the methods below:
- In the Alerts section of the KUMA web interface, click the alert whose information you want to view.
The Alert window opens with the alert processing toolbar at the very top.
- In the Alerts section of the KUMA web interface, select the check box next to the required alert. It is possible to select more than one alert.
Alerts with the closed status cannot be selected for processing.
The action toolbar appears at the bottom of the window.
- In the Alerts section of the KUMA web interface, click the alert whose information you want to view.
- If you want to change the priority of an alert, select the required value in the Priority drop-down list:
- Low
- Medium
- High
- Critical
The priority of the alert changes to the selected value.
- If you want to assign an alert to a user, select the relevant user from the Assign to drop-down list.
You can assign the alert to yourself by selecting Me.
The status of the alert changes to Assigned and the name of the selected user is displayed in the Assign to drop-down list.
- Create an incident based on the alert:
- Click Create incident.
The window for creating an incident will open. The alert name is used as the incident name.
- Update the desired incident parameters and click the Save button.
The incident is created, and the alert status is changed to Escalated. An alert can be unlinked from an incident by selecting it and clicking Unlink.
- Click Create incident.
- If you want to close the alert:
- Click Close alert.
A confirmation window opens.
- Select the reason for closing the alert:
- Responded. This means the appropriate measures were taken to eliminate the security threat.
- Incorrect data. This means the alert was a false positive and the received events do not indicate a security threat.
- Incorrect correlation rule. This means the alert was a false positive and the received events do not indicate a security threat. The correlation rule may need to be updated.
- Click OK.
The status of the alert changes to Closed. Alerts with this status are no longer updated with new correlation events and aren't displayed in the alerts table unless the Closed check box is selected in the Status drop-down list in the alerts table. You cannot change the status of a closed alert or assign it to another user.
- Click Close alert.
Drilldown analysis
Drilldown analysis is used when you need to find more information about the threat an alert is warning you about: is the threat real, where's it coming from, what network environment elements are affected by it, how should the threat be dealt with. Studying the events related to the correlation events that triggered an alert can help you determine the course of action.
The drilldown mode is enabled in KUMA when you click the Find in events link in the alert window or the correlation event window. When the drill-down mode is enabled, the events table is shown with filters automatically set to match the events from the alert or correlation event. The filters also match the time period of the alert duration or the time when the correlation event was registered. You can change these filters to find other events and learn more about the processes related to the threat.
An additional  drop-down list becomes available in drilldown mode:
- All events—view all events.
- Related to alert (selected by default)—view only events related to the alert.
When filtering events related to an alert, there are limitations on the complexity of SQL search queries.
You can manually link events to alerts. Only events that are not related to the alert can be linked to it.
You can create and save event filter configuration in drilldown mode. When using this filter outside of drilldown mode, all events that match the filter criteria will be selected disregarding whether or not they are related to the alert that was selected for drilldown analysis.
To link a base event to an alert:
- In the Alerts section of the KUMA web interface, click the alert that you want to link to the event.
The Alert window opens.
- In the Related events section click the Find in events button.
The events table opens with active filters matching the data and period of events related to the alert, and columns show the settings used by the correlation rule to create the alert. The Link to alert column is also added to the events table showing the events linked to the alert.
- In the drop-down list select All events.
- Modify the filters to find the event you want to link to the alert.
- Select the event you want, and click the Link to alert button at the bottom of the event details area.
The event will be linked to the alert. You can unlink this event from the alert by clicking in the Unlink from alert detailed view.
When the event is linked or unlinked from the alert, the Change log entry is added in the Alert window. You can click the link in this entry and in the opened event details area link or unlink the event using the Link to alert and Unlink from alert buttons.
Page top
Alert storage period
Alerts are stored in KUMA for a year by default. This period can be changed by editing the application startup parameters in the /usr/lib/systemd/system/kuma-core.service file on the KUMA Core server.
To change the storage period for alerts:
- Log in to the OS of the server where the KUMA Core is installed.
- In the /usr/lib/systemd/system/kuma-core.service file, edit the following string by inserting the necessary number of days:
ExecStart=/opt/kaspersky/kuma/kuma core --alerts.retention <number of days to keep alerts> --external :7220 --internal :7210 --mongo mongodb://localhost:27017 - Restart KUMA by running the following commands in sequence:
systemctl daemon-reloadsystemctl restart kuma-core
The storage period for alerts has been changed.
Page top
Alert segmentation rules
In KUMA, you can configure segmentation rules for alerts, that is, you can create separate alerts with certain conditions. This can be useful when the correlator groups the same type of correlation events into one common alert, but you want separate alerts to be generated based on some of these events, which differ from others for some important reason.
Segmentation rules are created separately for each tenant. They are displayed in the Settings → Alerts section of the KUMA web interface in a table with the following columns:
- Tenant—the name of the tenant that owns the segmentation rules.
- Updated—date and time of the last update of the segmentation rules.
- Disabled—this column displays a label if the segmentation rules are turned off.
To create an alert segmentation rule:
- Open the Settings → Alerts section in the KUMA web interface.
- Select the tenant for which you would like to create a segmentation rule:
- The tenant already has segmentation rules. Select it in the table.
- If the tenant does not have segmentation rules, click Add and select the relevant tenant from the Tenant drop-down list.
- In the Segmentation rules settings block, press Add and specify the segmentation rule settings:
- Name (required)—specify the segmentation rule name in this field.
- Correlation rule (required)—in this drop-down list, select the correlation rule whose events you want to highlight in a separate alert.
- Selector (required)—in this settings block, you need to specify a condition under which the segmentation rule will be triggered. The conditions are specified in a way similar to filters.
- Click Save.
The alert segmentation rule is created. Events matching these rules will be combined into a separate alert with the name of the segmentation rule.
To turn off the segmentation rules:
- Open the Settings → Alerts section of the KUMA web interface and select the tenant whose segmentation rules you want to disable.
- Select the Disabled check box.
- Click Save.
The segmentation rules for the alerts of the selected tenant are disabled.
Page top
Working with events
In the Events section of the KUMA web interface, you can inspect events received by the program to investigate security threats or create correlation rules. Only filtered data is displayed in the events table.
Events can be sent to the correlator for a retroscan.
Displayed date format:
- English localization: YYYY-MM-DD.
- Russian localization: DD.MM.YYYY.
Filtering events
The Events section of the KUMA web interface does not show any data by default. To view events, you need to define an SQL query in the search field and click the  button. The SQL query can be entered manually or it can be generated using a query builder.
Please note that when switching to the query builder, the query parameters that were manually entered into the search string are not transferred to the builder so you will need to create your query again. Also, the query created in the builder does not overwrite the query that was entered into the search string until you click the Apply button in the builder window.
Data aggregation and grouping is supported in SQL queries.
An SQL query can be changed based on the search results:
- Changing a query from the Statistics window
To change the filtering settings in the Statistics window:
- Open Statistics details area by using one of the following methods:
- In the drop-down list in the top right corner of the events table select Statistics.
- In the events table click any value and in the opened context menu select Statistics.
The Statistics details area appears in the right part of the web interface window.
- In the
- Open the drop-down list of the relevant parameter and hover your mouse cursor over the necessary value.
- Use the plus and minus signs to change the filter settings by doing one of the following:
- If you want the events selection to include only events with the selected value, click the
 icon.
icon. - If you want the events selection to exclude all events with the selected value, click the
 icon.
icon.
- If you want the events selection to include only events with the selected value, click the
As a result, the filter settings and the events table will be updated, and the new search query will be displayed in the upper part of the screen.
- Open Statistics details area by using one of the following methods:
- Changing a query from the events table
- Changing a query from the Event details area
To change the filter settings in the event details area:
- In the Events section of the KUMA web interface, click the relevant event.
The Event details area appears in the right part of the window.
- Change the filter settings by using the plus or minus icons next to the relevant settings:
- If you want the events selection to include only events with the selected value, click the icon.
- If you want the events selection to exclude all events with the selected value, click the icon.
- If you want the events selection to include only events with the selected value, click the
As a result, the filter settings and the events table will be updated, and the new search query will be displayed in the upper part of the screen.
- In the Events section of the KUMA web interface, click the relevant event.
In the SQL query input field, you can enable the display of control characters.
You can also filter events by time period. Search results can be automatically updated.
Filter configurations can be saved. Existing filter configurations can be deleted.
Filter functions are available for users regardless of their roles.
After updating KUMA to version 1.6, event filtering that uses an SQL query containing the inSubnet condition may result in error Code: 441. DB::Exception: Invalid IPv4 value. If this is the case, you must add the directive <cast_ipv4_ipv6_default_on_conversion_error>true</cast_ipv4_ipv6_default_on_conversion_error> in the profiles → default section of the file /opt/kaspersky/kuma/clickhouse/cfg/config.d/users.xml on the storage servers (on each machine of the ClickHouse cluster).
For more details on SQL, refer to the ClickHouse documentation. See also the SQL functions and operators supported by KUMA.
Filtering events by period
In KUMA, you can specify the time period to display events from.
To filter events by period:
- In the Events section of the KUMA web interface, open the Period drop-down list in the upper part of the window.
- If you want to filter events based on a standard period, select one of the following:
- 5 minutes
- 15 minutes
- 1 hour
- 24 hours
- In period
If you select this option, use the opened calendar to select the start and end dates of the period and click Apply filter. The date and time format depends on your operating system's settings. You can also manually change the date values if necessary.
- Click the button.
When the period filter is set, only events registered during the specified time interval will be displayed. The period will be displayed in the upper part of the window.
You can also set a period using the events histogram at the top of the Events section by clicking the grey box with the time frame you need, or by dragging the mouse over the required time period and clicking the Show events button.
Page top
Generating an SQL query using a builder
In KUMA, you can use a query builder to generate an SQL query for filtering events.
To generate an SQL query using a builder:
- In the Events section of the KUMA web interface, click the button.
The filter constructor window opens.
- Generate a search query by providing data in the following parameter blocks:
- SELECT—event fields that should be returned. The * value is selected by default, which means that all available event fields must be returned. To optimize your search, you can use the drop-down list to select the specific fields so that data from other unnecessary fields will not be loaded.
When selecting an event field, you can use the field on the right of the drop-down list to specify an alias for the column of displayed data, and you can use the right-most drop-down list to select the operation to perform on the data: count, max, min, avg, sum.
If you are using aggregation functions in a query, you cannot customize the events table display, sort events in ascending or descending order, receive statistics, or perform a retroscan.
When filtering by alert-related events in drilldown analysis mode, you cannot perform operations on the data of event fields or assign names to the columns of displayed data.
- FROM—data source. Select the events value.
- WHERE—conditions for filtering events.
Conditions and groups of conditions can be added by using the Add condition and Add group buttons. The AND operator value is selected by default in a group of conditions, but the operator can be changed by clicking on this value. Available values: AND, OR, NOT. The structure of conditions and condition groups can be changed by using the
icon to drag and drop expressions.Adding filter conditions:
- In the drop-down list on the left, select the event field that you want to use for filtering.
- Select the necessary operator from the middle drop-down list. The available operators depend on the type of value of the selected event field.
- Enter the value of the condition. Depending on the selected type of field, you may have to manually enter the value, select it from the drop-down list, or select it on the calendar.
Filter conditions can be deleted by using the
button. Group conditions are deleted using the Delete group button. - GROUP BY—event fields or aliases to be used for grouping the returned data.
If you are using data grouping in a query, you cannot customize the events table display, sort events in ascending or descending order, receive statistics, or perform a retroscan.
When filtering by alert-related events in drilldown analysis mode, you cannot group the returned data.
- ORDER BY—columns used as the basis for sorting the returned data. In the drop-down list on the right, you can select the necessary order: DESC—descending, ASC—ascending.
- LIMIT—number of strings displayed in the table.
The default value is 250.
If you are filtering events by user-defined period and the number of strings in the search results exceeds the defined value, you can click the Show next records button to display additional strings in the table. This button is not displayed when filtering events by the standard period.
- SELECT—event fields that should be returned. The * value is selected by default, which means that all available event fields must be returned. To optimize your search, you can use the drop-down list to select the specific fields so that data from other unnecessary fields will not be loaded.
- Click the Apply button.
The current SQL query will be overwritten. The generated SQL query is displayed in the search field.
If you want to reset the builder settings, click the Default query button.
If you want to close the builder without overwriting the existing query, click the
button. - Click the button to display the data in the table.
The table will display the search results based on the generated SQL query.
When switching to another section of the web interface, the query generated in the builder is not preserved. If you return to the Events section from another section, the builder will display the default query.
After updating KUMA to version 1.6, event filtering that uses an SQL query containing the inSubnet condition may result in error Code: 441. DB::Exception: Invalid IPv4 value. If this is the case, you must add the directive <cast_ipv4_ipv6_default_on_conversion_error>true</cast_ipv4_ipv6_default_on_conversion_error> in the profiles → default section of the file /opt/kaspersky/kuma/clickhouse/cfg/config.d/users.xml on the storage servers (on each machine of the ClickHouse cluster).
For more details on SQL, refer to the ClickHouse documentation. See also the SQL functions and operators supported by KUMA.
Complicated SQL queries
You can use the search string to manually create SQL queries of any complexity for filtering events.
To manually generate an SQL query:
- Go to the Events section of the KUMA web interface.
An input form opens.
- Enter your SQL query into the input field.
- Click the button.
You will see a table of events that satisfy the criteria of your query. If necessary, you can filter events by period.
Supported functions and operators
SELECT—event fields that should be returned.For
SELECTfields, the program supports the following functions and operators:- Aggregation functions:
count, avg, max, min, sum. - Arithmetic operators:
+, -, *, /, <, >, =, !=, >=, <=.You can combine these functions and operators.
If you are using aggregation functions in a query, you cannot customize the events table display, sort events in ascending or descending order, receive statistics, or perform a retroscan.
- Aggregation functions:
FROM—data source.When creating a query, you need to specify the events value as the data source.
WHERE—conditions for filtering events.AND, OR, NOT, =, !=, >, >=, <, <=INBETWEENLIKEILIKEinSubnetmatch(the re2 syntax of regular expressions is used in queries)
GROUP BY—event fields or aliases to be used for grouping the returned data.If you are using data grouping in a query, you cannot customize the events table display, sort events in ascending or descending order, receive statistics, or perform a retroscan.
ORDER BY—columns used as the basis for sorting the returned data.Possible values:
DESC—descending order.ASC—ascending order.
OFFSET—skip the indicated number of lines before printing the query results output.LIMIT—number of strings displayed in the table.The default value is 250.
If you are filtering events by user-defined period and the number of strings in the search results exceeds the defined value, you can click the Show next records button to display additional strings in the table. This button is not displayed when filtering events by the standard period.
Example queries:
SELECT * FROM `events` WHERE Type IN ('Base', 'Audit') ORDER BY Timestamp DESC LIMIT 250In the events table, all events with the Base and Audit type are sorted by the Timestamp column in descending order. The number of strings that can be displayed in the table is 250.
SELECT * FROM `events` WHERE BytesIn BETWEEN 1000 AND 2000 ORDER BY Timestamp ASC LIMIT 250All events of the events table for which the BytesIn field contains a value of received traffic in the range from 1000 to 2000 bytes are sorted by the Timestamp column in ascending order. The number of strings that can be displayed in the table is 250.
SELECT * FROM `events` WHERE Message LIKE '%ssh:%' ORDER BY Timestamp DESC LIMIT 250In the events table, all events whose Message field contains data corresponding to the defined
%ssh:%template in lowercase are sorted by the Timestamp column in descending order. The number of strings that can be displayed in the table is 250.SELECT * FROM `events` WHERE inSubnet(DeviceAddress, '10.0.0.1/24') ORDER BY Timestamp DESC LIMIT 250In the events table, all events for hosts that are in the 10.0.0.1/24 subnet are sorted by the Timestamp column in descending order. The number of strings that can be displayed in the table is 250.
SELECT * FROM `events` WHERE match(Message, 'ssh.*') ORDER BY Timestamp DESC LIMIT 250In the events table, all events whose Message field contains text corresponding to the
ssh.*template are sorted by the Timestamp column in descending order. The number of strings that can be displayed in the table is 250.SELECT max(BytesOut) / 1024 FROM `events`SELECTMaximum amount of outbound traffic (KB) for the selected time period.
SELECT count(ID) AS "Count", SourcePort AS "Port" FROM `events` GROUP BY SourcePort ORDER BY Port ASC LIMIT 250Number of events and port number. Events are grouped by port number and sorted by the Port column in ascending order. The number of strings that can be displayed in the table is 250.
The ID column in the events table is named Count, and the SourcePort column is named Port.
If you want to use a special character in a query, you need to escape this character by placing a backslash (\) character in front of it.
Example:
In the events table, all events whose Message field contains text corresponding to the |
When switching to the query builder, the query parameters that were manually entered into the search string are not transferred to the builder so you will need to create your query again. Also, the query created in the builder does not overwrite the query that was entered into the search string until you click the Apply button in the builder window.
After updating KUMA to version 1.6, event filtering that uses an SQL query containing the inSubnet condition may result in error Code: 441. DB::Exception: Invalid IPv4 value. If this is the case, you must add the directive <cast_ipv4_ipv6_default_on_conversion_error>true</cast_ipv4_ipv6_default_on_conversion_error> in the profiles → default section of the file /opt/kaspersky/kuma/clickhouse/cfg/config.d/users.xml on the storage servers (on each machine of the ClickHouse cluster).
For more details on SQL, refer to the ClickHouse documentation.
Limited complexity of queries in drilldown analysis mode
During a drilldown analysis, the complexity of SQL queries for event filtering is limited if the Related to alert option is selected from the drop-down list when investigating an alert. If this is the case, only the functions and operators listed below are available for event filtering.
If the All events option is selected from the drop-down list, these limitations are not applied.
SELECT- The
*character is used as a wildcard to represent any number of characters.
- The
WHEREAND,OR,NOT,=,!=,>,>=,<,<=INBETWEENLIKEinSubnet
Examples:
WHERE Type IN ('Base', 'Correlated')WHERE BytesIn BETWEEN 1000 AND 2000WHERE Message LIKE '%ssh:%'WHERE inSubnet(DeviceAddress, '10.0.0.1/24')
ORDER BYSorting can be done by column.
OFFSETSkip the indicated number of lines before printing the query results output.
LIMITThe default value is 250.
If you are filtering events by user-defined period and the number of strings in the search results exceeds the defined value, you can click the Show next records button to display additional strings in the table. This button is not displayed when filtering events by the standard period.
When filtering by alert-related events in drilldown analysis mode, you cannot group the returned data. When filtering by alert-related events in drilldown analysis mode, you cannot perform operations on the data of event fields or assign names to the columns of displayed data.
Page top
Saving and selecting events filter configuration
In KUMA, you can save a filter configuration so it can be used in the future or by other users. When saving a filter, you are saving the configured settings of all the active filters at the same time, including the time-based filter, query builder, and the events table settings. Search queries are saved on the KUMA Core server and are available to all KUMA users of the selected tenant.
To save the current settings of the filter, query, and period:
- In the Events section of the KUMA web interface, click the icon next to the filter expression and select Save current filter.
- In the window that opens, enter the name of the filter configuration in the Name field. The name must contain 128 Unicode characters or less.
- In the Tenant drop-down list, select the tenant that will own the created filter.
- Click Save.
The filter configuration is now saved.
To select a previously saved filter configuration:
In the Events section of the KUMA web interface, click the icon next to the filter expression and select the relevant filter.
The selected configuration is active, which means that the search field is displaying the search query, and the upper part of the window is showing the configured settings for the period and frequency of updating the search results. Click the button to submit the search query.
You can click the icon near the filter configuration name to make it a default filter.
Deleting event filter configurations
To delete a previously saved filter configuration:
- In the Events section of the KUMA web interface, click the icon next to the filter search query and click the icon next to the configuration that you need to delete.
- Click OK.
The filter configuration is now deleted for all KUMA users.
Page top
Viewing event detail areas
In KUMA, you can inspect the parameters of any event in your selection, which can help during alert investigation or when working with correlation rules.
To see event parameters,
In the Events section of the KUMA web interface, click the relevant event.
The Event details area appears in the right part of the web interface window and contains a list of the event's parameters with values. In this area you can:
- To modify the event sample you can use and icons located next to parameter values.
- Open the service that registered the event using the link in the Service parameter value.
- Open a window containing information about the asset if it is mentioned in the event fields and registered in the program.
- Link the event to an alert if the program is in analysis drilldown mode.
- Open the Details on correlation event window if the event you selected is a correlation event.
- If integration with Kaspersky CyberTrace and/or Kaspersky Threat Intelligence Portal is configured, view and request information about objects in the event fields from these sources.
Exporting events
In KUMA, you can export information about events to a TSV file. The selection of events that will be exported to a TSV file depends on filter settings. The information is exported from the columns that are currently displayed in the events table. The columns in the exported file are populated with the available data even if they were empty in the events table in the KUMA web interface due to the special features of the SQL query.
To export information about events:
- In the Events section of the KUMA web interface, open the drop-down list and choose Export TSV.
The new export TSV file task is created in the Task manager section.
- Find the task you created in the Task manager section.
When the file is ready to download, the
 icon will appear in the Status column of the task.
 - Click the task type name and select Upload from the drop-down list.
The TSV file will be downloaded using your browser's settings. By default, the file name is event-export-<date>_<time>.tsv.
The file is saved based on your web browser's settings.
Page top
Selecting Storage
Events that are displayed in the Events section of the KUMA web interface are retrieved from storage (from the ClickHouse cluster). Depending on the demands of your company, you may have more than one Storage. However, you can only receive events from one Storage at a time, so you must specify which one you want to use.
To select the Storage you want to receive events from,
In the Events section of the KUMA web interface, open the  drop-down list and select the relevant storage cluster.
Now events from the selected storage are displayed in the events table. The name of the selected storage is displayed in the drop-down list.
The drop-down list displays only the clusters of tenants available to the user, and the cluster of the main tenant.
Getting events table statistics
You can get statistics for the current events selection displayed in the events table. The selected events depend on the filter settings.
To obtain statistics:
Select Statistics from the drop-down list in the upper-right corner of the events table, or click on any value in the events table and select Statistics from the opened context menu.
The Statistics details area appears with the list of parameters from the current event selection. The numbers near each parameter indicate the number of events with that parameter in the selection. If a parameter is expanded, you can also see its five most frequently occurring values. Relevant parameters can be found by using the Search field.
The Statistics window allows you to modify the events filter.
When using SQL queries with data grouping and aggregation for filtering events, statistics are not available.
Page top
Configuring the table of events
Responses to user SQL queries are presented as a table in the Events section. This table can be updated.
Default column configuration of the events table:
- Tenant.
- Timestamp.
- Name.
- DeviceProduct.
- DeviceVendor.
- DestinationAddress.
- DestinationUserName.
In KUMA, you can customize the displayed set of event fields and their display order. The selected configuration can be saved.
When using SQL queries with data grouping and aggregation for filtering events, statistics are not available and the order of displayed columns depends on the specific SQL query.
To configure the fields displayed in the events table:
- Click the icon in the top right corner of the events table.
You will see a window for selecting the event fields that should be displayed in the events table.
- Select the check boxes opposite the fields that you want to view in the table. You can search for relevant fields by using the Search field.
You can configure the table to display any event field from the KUMA event data model. The Timestamp and Name parameters are always displayed in the table. Click the Default button to display only default event parameters in the events table.
When you select a check box, the events table is updated and a new column is added. When a check box is cleared, the column disappears.
You can also remove columns from the events table by clicking the column title and selecting Hide column from the drop-down list.
- If necessary, change the display order of the columns by dragging the column headers in the event tables.
- If you want to sort the events by a specific column, click its title and in the drop-down list select one of the available options: Ascending or Descending.
The selected event fields will be displayed as columns in the table of the Events section in the order you specified.
Page top
Refreshing events table
You can update the displayed event selection with the most recent entries by refreshing the web browser page. You can also refresh the events table automatically and set the frequency of updates. Automatic refresh is disabled by default.
To enable automatic refresh:
Select the update frequency in the  drop-down list:
- 5 seconds
- 15 seconds
- 30 seconds
- 1 minute
- 5 minutes
- 15 minutes
The events table now refreshes automatically.
To disable automatic refresh:
Select No refresh in the drop-down list:
Opening the correlation event window
You can view the details of a correlation event in the Correlation event details window.
To open the correlation event window:
- In the Events section of the KUMA web interface, click a correlation event.
You can use filters to find correlation events by assigning the
correlatedvalue to theTypeparameter.The details area of the selected event will open. If the selected event is a correlation event, the Detailed view button will be displayed at the bottom of the details area.
- Click the Detailed view button.
The correlation event window will open. The event name is displayed in the upper left corner of the window.
The Correlation event details section of the correlation event window contains the following data:
- Correlation event priority—the importance of the correlation event.
- Correlation rule—the name of the correlation rule that triggered the creation of this correlation event. The rule name is represented as a link that can be used to open the settings of this correlation rule.
- Correlation rule priority—the importance of the correlation rule that triggered the correlation event.
- Correlation rule ID—the identifier of the correlation rule that triggered the creation of this correlation event.
- Tenant—the name of the tenant that owns the correlation event.
The Related events section of the correlation event window contains the table of events related to the correlation event. These are base events that actually triggered the creation of the correlation event. When an event is selected, the details area opens in the right part of the web interface window.
The Find in events link to the right of the section header is used for drilldown analysis.
The Related endpoints section of the correlation event window contains the table of hosts related to the correlation event. This information comes from the base events related to the correlation event. Clicking the name of the asset opens the Asset details window.
The Related users section of the correlation event window contains the table of users related to the correlation event. This information comes from the base events related to the correlation event.
Retroscan
You can use the Retroscan feature to "replay" events in KUMA by feeding a sample of events into a correlator so that they can be processed by specific correlation rules. You can also choose to have alerts created while events are retroscanned. Retroscan can be useful when refining the correlation rule resources or analyzing historical data.
Retroscanned events are not enriched with data from CyberTrace or the Kaspersky Threat Intelligence Portal.
Active lists are updated during retroscanning.
A retroscan cannot be performed on selections of events obtained using SQL queries that group and aggregate data and contain arithmetic expressions.
To use Retroscan:
- In the Events section of KUMA, create the required event selection:
- Select the storage.
- Configure search expression using the constructor or search query.
- Select the required period.
- Open the drop-down list and choose Retroscan.
The Retroscan window opens.
- In the Correlator drop-down list, select the Correlator to feed selected events to.
- In the Correlation rules drop-down list, select the Correlation rules that must be used when processing events.
- If you want responses to be executed when processing events, turn on the Execute responses toggle switch.
- If you want alerts to be generated during event processing, turn on the Create alerts toggle switch. If you want alerts to be generated during event processing, turn on the Create alerts toggle switch.
- Click the Create task button.
The retroscan task is created in the Task manager section.
To view results of replay:
In the Task manager section of the KUMA web interface, click the task you created and select Go to Events from the drop-down list.
This opens a new browser tab containing a table of events that were processed during the retroscan and the aggregation and correlation events that were created during event processing.
Depending on your browser settings, you may be prompted for confirmation before your browser can open the new tab containing the retroscan results. For more details, please refer to the documentation for your specific browser.
Page top
Managing assets
In the Assets section of the KUMA web interface, you can view and edit information about known assets and their categories. Assets can be imported from Kaspersky Security Center and from MaxPatrol reports.
The asset categories tree is displayed in the left part of the Assets section. You can browse the tree, and expand or collapse nodes. When a node is selected, the assets belonging to that node category are displayed in the right part of the window.
When an asset is selected, the right side of the window shows the Asset details area displaying the following asset parameters:
- Name—asset name. Assets imported from Kaspersky Security Center retain their Kaspersky Security Center names.
- Tenant name—name of the tenant that owns the asset.
- Created—date and time when the asset was added to KUMA.
- Updated—date and time when the asset information was modified.
- Owner—owner of the asset, if provided.
- IP address—IP address of the asset, if provided.
If there are several assets with identical IP addresses in KUMA, the asset that was added the latest is returned in all cases when assets are searched by IP address. If assets with identical IP addresses can coexist in your organization's network, plan accordingly and use additional attributes to identify the assets. For example, this may become important during correlation.
- FQDN—Fully Qualified Domain Name of the asset, if provided.
- MAC address—MAC address of the asset, if provided.
- Operating system—operating system of the asset.
- Related alerts—alerts associated with the asset (if any).
To view the list of alerts related to an asset, click the Find in Alerts link. The Alerts tab opens with the search expression set to filter all assets with the corresponding asset ID.
- Categories—categories associated with the asset (if any).
- Vulnerabilities—vulnerabilities of the asset, if provided. This information is available only for the assets that were imported from Kaspersky Security Center.
You can learn more about the vulnerability by clicking the
 icon, which opens the Kaspersky Threats portal. You can also update the vulnerabilities list by clicking the Update link and requesting updated information from Kaspersky Security Center.
 - Software info—if the asset software parameters are provided, they are displayed in this section.
- Hardware info—if the asset hardware parameters are provided, they are displayed in this section.
- Agent ID—identifier of the KUMA agent installed on the asset.
- Last connection time with KSC—if the asset was imported from Kaspersky Security Center, this section displays the time of the last connection with Kaspersky Security Center.
You can select the check boxes next to assets and then assign them to a category by using the Link to category button.
Do not assign the Categorized assets category to assets.
Asset categories
In KUMA, assets are assigned to tree-structured categories. You can view the category tree in the KUMA web interface under Assets → All assets. When a tree node is selected, the assets assigned to it are displayed in the right part of the window. Assets from the subcategories of the selected category are not displayed unless you specify that you want to show assets recursively.
Categories can be assigned to assets either manually or automatically. Automatic categorization can be reactive, which means that categories are populated with assets by using correlation rules. Alternatively, automatic categorization can be active, which means that all assets that meet specific conditions are assigned to a category. The categorization method can be specified in the category settings when you create or edit a category.
If you hover the mouse over a category, the ellipsis icon will appear to the right of the category name. Clicking this icon opens a category context menu in which you can select the following options:
- Show assets—display assets of the selected category in the right part of the window.
- Show assets recursively—display assets from the subcategories of the selected category. If you want to exit recursive viewing mode, select another category to view.
- Show info—view information about the selected category in the Category information details area displayed in the right part of the web interface window.
- Start categorization—start automatically linking assets to the selected category. This option is available for categories that have active categorization.
- Add subcategory—add a subcategory to the selected category.
- Edit category—edit the selected category.
- Delete category—remove the selected category. You can remove only the categories that have no assets or subcategories. Otherwise the Delete category option will be inactive.
- Pin as tab—display the selected category in a separate tab You can undo this action by selecting Unpin as tab in the context menu of the relevant category.
Adding an asset category
To add an asset category:
- Open the Assets section in the KUMA web interface.
- Open the category creation window:
- Click the Add category button.
- If you want to create a subcategory, select Add subcategory in the context menu of the parent category.
The Add category details area appears in the right part of the web interface window.
- Add information about the category:
- In the Name field, enter the name of the category. The name must contain from 1 to 128 Unicode characters.
- In the Parent field, indicate the position of the category within the categories tree hierarchy:
- Click the button.
This opens the Select categories window showing the categories tree. If you are creating a new category and not a subcategory, the window may show multiple asset category trees, one for each tenant that you can access. Your tenant selection in this window cannot be undone.
- Select the parent category for the category you are creating.
- Click Save.
Selected category appears in Parent fields.
- Click the
- The Tenant field displays the tenant whose structure contains your selected parent category. The tenant category cannot be changed.
- Assign a priority to the category in the Priority drop-down list.
- If necessary, in the Description field, you can add a note consisting of up to 256 Unicode characters.
- In the Categorization kind drop-down list, select how the category will be populated with assets. Depending on your selection, you may need to specify additional settings:
- Manually—assets can only be manually linked to a category.
- Active—assets will be assigned to a category at regular intervals if they satisfy the defined filter.
- Reactive—the category will be filled with assets by using correlation rules.
- Click Save.
The new category will be added to the asset categories tree.
Page top
Configuring the table of assets
In KUMA, you can configure the contents and order of columns displayed in the assets table. These settings are stored locally on your machine.
To configure the settings for displaying the assets table:
- Click the icon in the upper-right corner of the assets table.
- Select the check boxes next to the parameters you want to view in the table:
- FQDN
- IP address
- Owner
- MAC address
- Created by
- Updated
- Tenant name
When you select a check box, the assets table is updated and a new column is added. When a check box is cleared, the column disappears. The table can be sorted based on multiple columns.
- If you need to change the order of columns, click the left mouse button on the column name and drag it to the desired location in the table.
The assets table display settings are configured.
Page top
Importing asset information from Kaspersky Security Center
All assets monitored by this program are registered in Kaspersky Security Center. This data can be accessed using the API. If there is an active connection between KUMA and Kaspersky Security Center, you can import assets from Kaspersky Security Center to KUMA.
To import information about assets from Kaspersky Security Center:
- Open the KUMA web interface and select the Assets section.
- Click Import KSC assets.
The Import KSC assets window opens.
- In the drop-down list, select a tenant to import data from Kaspersky Security Center.
- Click OK.
The asset information is imported from Kaspersky Security Center to KUMA.
Page top
Importing asset information from MaxPatrol
In KUMA, you can import asset information from reports on the results of network device scans using MaxPatrol, which is a system for monitoring the state of security and compliance with standards. The import is performed through the API using the maxpatrol-tool on the server where the KUMA Core is installed. Imported assets are displayed in the KUMA web interface in the Assets section. If necessary, you can edit the settings of assets.
This tool is provided upon request.
Imports from MaxPatrol 8 are supported.
To import asset information from a MaxPatrol report:
- In MaxPatrol, generate a network asset scan report in XML file format and copy the report file to the KUMA Core server. For more details about scan tasks and output file formats, refer to the MaxPatrol documentation.
Data cannot be imported from reports in SIEM integration file format. The XML file format must be selected.
- Create a file with the token for accessing the KUMA REST API. For convenience, it is recommended to place it into the MaxPatrol report folder. The file must not contain anything except the token.
Requirements imposed on accounts for which the API token is generated:
- Administrator or Analyst role.
- Access to the tenant into which the assets will be imported.
- Copy the maxpatrol-tool to the server hosting the KUMA Core and make the tool's file executable by running the command
chmod +x <path to maxpatrol-tool file on the server with the KUMA Core>. - Run the maxpatrol-tool:
./maxpatrol-tool --kuma-rest <KUMA REST API server address and port> --token <path and name of API token file> --tenant <name of tenant where assets will reside> <path and name of MaxPatrol report file>Example:
./maxpatrol-tool --kuma-rest example.kuma.com:7223 --token token.txt --tenant Main example.xml
You can use additional flags and commands for import operations. For example, the command --verbose, -v will display a full report on the received assets. A detailed description of the available flags and commands is provided in the table titled Flags and commands of maxpatrol-tool. You can also use the --help command to view information on the available flags and commands.
The asset information will be imported from the MaxPatrol report to KUMA. The console displays information on the number of new and updated assets.
Example: inserted 2 assets; updated 1 asset; errors occurred: [] |
The tool works as follows when importing assets:
- The data of assets imported into KUMA through the API is overwritten, and information about their resolved vulnerabilities is deleted.
- Assets with invalid data are skipped. Error information is displayed when using the
--verboseflag. - If there are assets with identical IP addresses and fully qualified domain names (FQDN) in the same MaxPatrol report, these assets are merged. The information about their vulnerabilities and software is also merged into one asset.
When uploading assets from MaxPatrol, assets that have equivalent IP addresses and fully qualified domain names (FQDN) that were previously imported from Kaspersky Security Center are overwritten.
To avoid this problem, you must configure range-based asset filtering by running the command
--ignore <IP address ranges> or -i <IP address ranges>. Assets that satisfy the filtering criteria are not uploaded. For a description of this command, please refer to the table titled Flags and commands of maxpatrol-tool.
Flags and commands of maxpatrol-tool
Flags and commands |
Description |
|---|---|
|
Address (with the port) of KUMA Core server where assets will be imported. For example, Port 7223 is used for API requests by default. You can change the port if necessary. |
|
Path and name of the file containing the token used to access the REST API. This file must contain only the token. The Administrator or Analyst role must be assigned to the user account for which the API token is being generated. |
|
Name of the KUMA tenant in which the assets from the MaxPatrol report will be imported. |
|
This command uses DNS to enrich IP addresses with FQDNs from the specified ranges if the FQDNs for these addresses were not already specified. Example: |
|
Address of the DNS server that the tool must contact to receive FQDN information. Example: |
|
Address ranges of assets that should be skipped during import. Example: |
|
Output of the complete report on received assets and any errors that occurred during the import process. |
|
Get reference information on the tool or a command. Examples:
|
|
Get information about the version of the maxpatrol-tool. |
|
Creation of an autocompletion script for the specified shell. |
Examples:
./maxpatrol-tool --kuma-rest example.kuma.com:7223 --token token.txt --tenant Main example.xml– import assets to KUMA from MaxPatrol report example.xml../maxpatrol-tool help—get reference information on the tool.
Possible errors
Error message |
Description |
|---|---|
must provide path to xml file to import assets |
The path to the MaxPatrol report file was not specified. |
incorrect IP address format |
Invalid IP address format. This error may arise when incorrect IP ranges are indicated. |
no tenants match specified name |
No suitable tenants were found for the specified tenant name using the REST API. |
unexpected number of tenants (%v) match specified name. Tenants are: %v |
KUMA returned more than one tenant for the specified tenant name. |
could not parse file due to error: %w |
Error reading the XML file containing the MaxPatrol report. |
error decoding token: %w |
Error reading the API token file. |
error when importing files to KUMA: %w |
Error transferring asset information to KUMA. |
skipped asset with no FQDN and IP address |
One of the assets in the report did not have an FQDN or IP address. Information about this asset was not sent to KUMA. |
skipped asset with invalid FQDN: %v |
One of the assets in the report had an incorrect FQDN. Information about this asset was not sent to KUMA. |
skipped asset with invalid IP address: %v |
One of the assets in the report had an incorrect IP address. Information about this asset was not sent to KUMA. |
KUMA response: %v |
An error occurred with the specified report when importing asset information. |
unexpected status code %v |
An unexpected HTTP code was received when importing asset information from KUMA. |
Searching assets
KUMA has a full-text search function to find assets based on their parameters. The search uses Name, FQDN, IP address, MAC address, and Owner asset parameters.
To find the relevant asset:
In the Assets section of the KUMA web interface, enter your search query in the Search field and press ENTER or click the  icon.
icon.
The table displays all assets whose names satisfy the search criteria.
Page top
Adding assets
In KUMA, you can add assets manually, or import them from Kaspersky Security Center or MaxPatrol reports.
To add an asset manually:
- In the Assets section of the KUMA web interface, click the Add asset button.
The Add asset details area opens in the right part of the window.
- Enter the asset parameters:
- Asset name (required)
- Tenant name (required)
- IP address and/or FQDN (required)
- MAC address
- Owner
- If required, assign one or multiple categories to the asset:
- Click the button with the icon.
Select categories window opens.
- Select the check boxes next to the categories that should be assigned to the asset. Use the
 and
and  icons to expand and collapse the subcategories.
 - Click Save.
The selected categories appear in the Categories fields.
- Click the button with the
- If required, add information about the operating system installed on the asset in the Software section.
- If required, add information about asset hardware in the Hardware info section.
- Click Add.
The asset is created and displayed in the assets table in the category assigned to it or in the Uncategorized assets category.
Page top
Deleting assets
KUMA has the capability to delete assets.
To delete an asset:
- In the Assets section of the KUMA web interface, click the asset that you want to delete.
The Asset details area opens in the right part of the window.
- Click the Delete button.
A confirmation window opens.
- Click OK.
The asset is deleted.
Assets imported from Kaspersky Security Center are deleted automatically if their information has not been updated in 30 days. An absence of updated information may be caused by a lack of data on the asset in Kaspersky Security Center or due to disconnection of KUMA from the Kaspersky Security Center server. If an asset was deleted but KUMA starts receiving information about that asset again from Kaspersky Security Center, the asset is recreated with the same ID. If you manually recreate an automatically deleted asset, the new asset will have an ID that is different from the ID of the old asset.
Editing the parameters of assets
In KUMA, you can edit asset parameters. All the parameters of manually added assets can be edited. For assets imported from Kaspersky Security Center, you can only change the name of the asset and its category.
To change the parameters of an asset:
- In the Assets section of the KUMA web interface, click the asset that you want to edit.
The Asset details area opens in the right part of the window.
- Click the Edit button.
The Edit asset window opens.
- Make the changes you need in the available fields:
- Asset name (required. This is the only field available for editing if the asset was imported from Kaspersky Security Center.)
- IP address and/or FQDN (required)
- MAC address
- Owner
- Software info:
- Operating system name
- Operating system build
- Hardware info:
- Assign or change the category of the asset:
- Click the button with the icon.
Select categories window opens.
- Select the check boxes next to the categories that should be assigned to the asset.
- Click Save.
The selected categories appear in the Categories fields.
You can also select the asset and then drag and drop it into the relevant category. This category will be added to the list of asset categories.
Do not assign the
Categorized assetscategory to assets. - Click the button with the
- If required, add information about the operating system installed on the asset in the Software section.
- If required, add information about the asset hardware in the Hardware info section.
- Click the Save button.
Asset parameters have been changed.
Page top
Logging in to the program web interface
To log in to the program web interface:
- Enter the following address in your browser:
https://<IP address or FQDN of KUMA Core server>:7220The web interface authorization page will open and prompt you to enter your user name and password.
- Enter the login of your account in the Login field.
- Enter the password for the specified account in the Password field.
- Click the Login button.
The main window of the program web interface opens.
In multitenancy mode, a user who is logging in to the program web interface for the first time will see the data only for those tenants that were selected for the user when their user account was created.
To log out of the program web interface:
Open the KUMA web interface, click your user account name in the bottom-left corner of the window, and click the Logout button in the opened menu.
Page top
Managing users
It is possible for multiple users to have access to KUMA. Users are assigned user roles, which affect the tasks the users can perform. The same user may have different roles with different tenants.
You can create or edit user accounts under Settings → Users in the KUMA web interface. Users are also created automatically in the program if KUMA integration with Active Directory is enabled and the user is logging in to the KUMA web interface for the first time using their domain account.
The table of user accounts is displayed in the Users window of the KUMA web interface. You can use the Search field to look for users. You can sort the table based on the User information column by clicking the column header and selecting Ascending or Descending.
User accounts can be created, edited, or disabled. When editing user accounts (your own or the accounts of others), you can generate an API token for them.
By default, disabled user accounts are not displayed in the users table. However, they can be viewed by clicking the User information column and selecting the Disabled users check box.
To disable a user:
In the KUMA web interface, under Settings → Users, select the check box next to the relevant user and click Disable user.
Creating a user
To create a user account:
- In the KUMA web interface, open Settings → Users.
In the right part of the Settings section the Users table will be displayed.
- Click the Add user button and set the parameters as described below:
- Name (required)—enter the user name. Must contain from 1 to 128 Unicode characters.
- Login(required) – enter a unique user name for the user account. Must contain from 3 to 64 characters (only a–z, A–Z, 0–9, . \ - _).
- Email (required)—enter the unique email address of the user. Must be a valid email address.
- New password (required)—enter the password to the user account. Password requirements:
- 8 to 128 characters long.
- At least one lowercase character.
- At least one uppercase character.
- At lease one numeral.
- At least one of the following special characters: !, @, #, %, ^, &, *.
- Confirm password (required)—enter the password again for confirmation.
- Disabled—select this check box if you want to disable a user account. By default, this check box is cleared.
- In the Tenants for roles settings block, use the Add field buttons to specify which roles the user will perform on which tenants. Although a user can have different roles on different tenants, the user can have only one role on the same tenant.
- Select the General administrator check box if you want to assign the general administrator role to the user. Users with the general administrator role can change the settings of other user accounts. By default, this check box is cleared.
- Click Save.
The user account will be created and displayed in the Users table.
Page top
Editing user
To edit a user:
- In the KUMA web interface, open Settings → Users.
In the right part of the Settings section the Users table will be displayed.
- Select the relevant user and change the necessary settings in the user details area that opens on the right.
- Name (required)—edit the user name. Must contain from 1 to 128 Unicode characters.
- Login(required) – enter a unique user name for the user account. Must contain from 3 to 64 characters (only a–z, A–Z, 0–9, . \ - _).
- Email (required)—enter the unique email address of the user. Must be a valid email address.
- Disabled—select this check box if you want to disable a user account. By default, this check box is cleared.
- In the Tenants for roles settings block, use the Add field buttons to specify which roles the user will perform on which tenants. Although a user can have different roles on different tenants, the user can have only one role on the same tenant.
- Receive notification by SMTP—select this check box if you want the user to receive SMTP notifications from KUMA.
- Select the General administrator check box if you want to assign the general administrator role to the user. Users with the general administrator role can change the settings of other user accounts. By default, this check box is cleared.
- If you need to change the password, click the Change password button and fill in the fields described below in the opened window. When finished, click OK.
- Current password (required)—enter the current password of your user account.
- New password (required)—enter the password to the user account. Password requirements:
- 8 to 128 characters long.
- At least one lowercase character.
- At least one uppercase character.
- At lease one numeral.
- At least one of the following special characters: !, @, #, %, ^, &, *.
- Confirm password (required)—enter the password again for confirmation.
- If necessary, use the Generate token button to generate an API token. Clicking this button displays a window containing the automatically created token.
When the window is closed, the token is no longer displayed. If you did not copy the token before closing the window, you will have to generate a new token.
- Click Save.
The user account will be changed.
Page top
Editing your user account
To edit your user account:
- Open the KUMA web interface, click the name of your user account in the bottom-left corner of the window and click the Profile button in the opened menu.
The User window with your user account parameters opens.
- Make the necessary changes to the parameters:
- Name (required)—enter the user name. Must contain from 1 to 128 Unicode characters.
- Login(required) – enter a unique user name for the user account. Must contain from 3 to 64 characters (only a–z, A–Z, 0–9, . \ - _).
Email (required)—enter the unique email address of the user. Must be a valid email address.
- Receive notification by SMTP—select this check box if you want to receive SMTP notifications from KUMA.
- Display control characters—select this check box if you want the KUMA web interface to display non-printing characters such as spaces, tab characters, and line breaks.
Spaces and tab characters are displayed in all input fields (except Description), in normalizers, correlation rules, filters and connectors, and in SQL queries for searching events in the Events section.
Spaces are displayed as dots.
A tab character is displayed as a dash in normalizers, correlation rules, filters and connectors. In other fields, a tab character is displayed as one or two dots.
Line break characters are displayed in all input fields that support multi-line input, such as the event search field.
If the Display control characters check box is selected, you can press Ctrl/Command+* to enable and disable the display of non-printing characters.
- If you need to change the password, click the Change password button and fill in the fields described below in the opened window. When finished, click OK.
- Current password (required)—enter the current password of your user account.
- New password (required)—enter the password to the user account. Password requirements:
- 8 to 128 characters long.
- At least one lowercase character.
- At least one uppercase character.
- At lease one numeral.
- At least one of the following special characters: !, @, #, %, ^, &, *.
- Confirm password (required)—enter the password again for confirmation.
- If necessary, use the Generate token button to generate an API token. Clicking this button displays a window containing the automatically created token.
When the window is closed, the token is no longer displayed. If you did not copy the token before closing the window, you will have to generate a new token.
- Click Save.
Your user account is changed.
Page top
User roles
KUMA users may have the following roles:
- General administrator—this role is designed for users who are responsible for the core functionality of KUMA systems. For example, they install system components, perform maintenance, work with services, create backups, and add users to the system. These users have full access to KUMA.
- Administrator—this role is for users responsible for the core functionality of KUMA systems owned by specific tenants.
- Analyst—this role is for users responsible for configuring the KUMA system to receive and process events of a specific tenant. They also create and tweak correlation rules.
- Operator—this role is for users dealing with immediate security threats of a specific tenant. A user with the operator role sees resources in a shared tenant through the REST API.
User roles rights
Web interface section and actions
General administrator
Administrator
Analyst
Operator
Comment
Reports
View and edit templates and reports
yes
yes
yes
no
Analysts can:
- View and edit templates and reports that they created themselves.
- View reports sent to them by email.
- View predefined templates.
Generate reports
yes
yes
yes
no
Analysts can generate reports that they created themselves or that are predefined (from a template or report).
Analysts cannot generate reports sent to them by email.
Export generated reports
yes
yes
yes
no
Analysts can export the following:
- Reports that they created themselves.
- Predefined reports.
- Reports received by email.
Delete templates and generated reports
yes
yes
yes
no
Analysts can delete the templates and reports that they generated themselves.
Analysts should not delete:
- Predefined templates.
- Reports received by email.
- Only the general administrator can delete predefined templates and reports.
Edit the settings for generating reports
yes
yes
yes
no
Analysts may change the settings for generating reports that they created themselves or that are predefined.
Duplicate report template
yes
yes
yes
no
Analysts can duplicate predefined report templates and report templates that they created themselves.
Dashboard
View data on the dashboard and change layouts
yes
yes
yes
yes
Add layouts
yes
yes
yes
no
This includes adding widgets to a layout.
Edit and rename layouts
yes
yes
yes
no
This includes adding, editing, and deleting widgets.
Analysts may change/rename predefined layouts and layouts that were created using their account.
Delete layouts
yes
yes
yes
no
Tenant administrators may delete layouts in the tenants available to them.
Analysts may delete layouts that were created using their account.
Only the general administrator can delete predefined layouts.
Resources → Services and Resources → Services → Active services
View the list of active services
yes
yes
yes
no
Only the general administrator can view and delete storage spaces.
Access rights do not depend on the tenants selected in the menu.
View the contents of the active list
yes
yes
yes
no
Import/export/clear the contents of the active list
yes
yes
yes
no
Create a set of resources for services
yes
yes
yes
no
Analysts cannot create storages.
Create a service under Resources - Services - Active services
yes
yes
no
no
Delete services
yes
yes
no
no
Restart services
yes
yes
no
no
Update the settings of services
yes
yes
yes
no
Reset certificates
yes
yes
no
no
A user with the administrator role can reset the certificates of services only in the tenants that are accessible to the user.
Resources → Resources
View the list of resources
yes
yes
yes
no*
Analysts cannot view the list of secret resources, but these resources are available to them when they create services.
Add resources
yes
yes
yes
no
Analysts cannot add secret resources.
Edit resources
yes
yes
yes
no
Analysts cannot change secret resources.
Create/edit/delete resources in a shared tenant
yes
no
no
no
Delete resources
yes
yes
yes
no
Analysts cannot delete secret resources.
Import resources
yes
yes
yes
no
Only the general administrator can import resources to a shared tenant.
Export resources
yes
yes
yes
no
This includes resources from a shared tenant.
View/edit collector or correlator drafts
yes
yes
yes
no
The user may only access their own drafts, regardless of the selected tenant. The list of drafts is generated based on those that belong to the user.
Sources status → List of event sources
View sources of events
yes
yes
yes
yes
Change sources of events
yes
yes
yes
no
Edit source name, assign monitoring policy, disable monitoring policy.
Delete sources of events
yes
yes
yes
no
Sources status → Monitoring policies
View monitoring policies
yes
yes
yes
yes
Create monitoring policies
yes
yes
yes
no
Edit monitoring policies
yes
yes
yes
no
Only the general administrator can edit the predefined monitoring policies.
Delete monitoring policies
yes
yes
yes
no
Predefined policies cannot be removed.
Assets
View assets and asset categories
yes
yes
yes
yes
This includes shared tenant categories.
Add/edit/delete asset categories
yes
yes
yes
no
Within the tenant available to the user.
Add asset categories in a shared tenant
yes
no
no
no
This includes editing and deleting shared tenant categories.
Link assets to an asset category of the shared tenant
yes
yes
yes
no
Add assets
yes
yes
yes
no
Edit assets
yes
yes
yes
no
Delete assets
yes
yes
yes
no
Import assets from Kaspersky Security Center
yes
yes
yes
no
Start tasks on assets in Kaspersky Security Center
yes
yes
yes
no
Alerts
View the list of alerts
yes
yes
yes
yes
Change the priority of alerts
yes
yes
yes
yes
Open the details of alerts
yes
yes
yes
yes
Assign responsible users
yes
yes
yes
yes
Close alerts
yes
yes
yes
yes
Add comments to alerts
yes
yes
yes
yes
Attach an event to alerts
yes
yes
yes
yes
Detach an event from alerts
yes
yes
yes
yes
Edit and delete someone else's filters
yes
yes
no
no
Incidents
View the list of incidents
yes
yes
yes
yes
Create blank incidents
yes
yes
yes
yes
Manually create incidents from alerts
yes
yes
yes
yes
Change the priority of incidents
yes
yes
yes
yes
Open the details of incidents
yes
yes
yes
yes
Incident details display data from only those tenants to which the user has access.
Assign executors
yes
yes
yes
yes
Close incidents
yes
yes
yes
yes
Add comments to incidents
yes
yes
yes
yes
Attach alerts to incidents
yes
yes
yes
yes
Detach alerts from incidents
yes
yes
yes
yes
Edit and delete someone else's filters
yes
yes
no
no
Export incidents to RuCERT
yes
yes
yes
yes
Events
View the list of events
yes
yes
yes
yes
Search events
yes
yes
yes
yes
Open the details of events
yes
yes
yes
yes
Open statistics
yes
yes
yes
yes
Conduct a retroscan
yes
yes
yes
no
Export events to a TSV file
yes
yes
yes
yes
Edit and delete someone else's filters
yes
yes
no
no
Start ktl enrichment
yes
yes
yes
no
Settings → Users
This section is available only to the general administrator.
View the list of users
yes
no
no
no
Add a user
yes
no
no
no
Edit a user
yes
no
no
no
View the data of their own profile
yes
yes
yes
yes
Edit the data of their own profile
yes
yes
yes
yes
The user role is not available for change.
Settings → LDAP server connections
View the LDAP connection settings
yes
yes
no
no
Edit the LDAP connection settings
yes
yes
no
no
Settings → Tenants
This section is available only to the general administrator.
View the list of tenants
yes
no
no
no
Add tenants
yes
no
no
no
Change tenants
yes
no
no
no
Disable tenants
yes
no
no
no
Settings → Domain authorization
This section is available only to the general administrator.
View the Active Directory connection settings
yes
no
no
no
Edit the Active Directory connection settings
yes
no
no
no
Add filters based on roles for tenants
yes
no
no
no
Settings → Notifications
This section is available only to the general administrator.
View the SMTP connection settings
yes
no
no
no
Edit the SMTP connection settings
yes
no
no
no
Settings → License
This section is available only to the general administrator.
View the list of added license keys
yes
no
no
no
Add license keys
yes
no
no
no
Delete license keys
yes
no
no
no
Settings → Kaspersky Security Center
View the list of successfully integrated Kaspersky Security Center servers
yes
yes
no
no
Add Kaspersky Security Center connections
yes
yes
no
no
Delete Kaspersky Security Center connections
yes
yes
no
no
Settings → Kaspersky CyberTrace
This section is available only to the general administrator.
View the CyberTrace integration settings
yes
no
no
no
Edit the CyberTrace integration settings
yes
no
no
no
Settings → R-Vision Incident Response Platform
This section is available only to the general administrator.
View R-Vision IRP integration settings
yes
no
no
no
Change R-Vision IRP integration settings
yes
no
no
no
Settings → Kaspersky Threat Lookup
This section is available only to the general administrator.
View the Threat Lookup integration settings
yes
no
no
no
Edit the Threat Lookup integration settings
yes
no
no
no
Settings → Alerts
View the parameters
yes
yes
yes
no
Edit the parameters
yes
yes
yes
no
Settings → Incidents → Automatic linking of alerts to incidents
See the settings
yes
no
no
no
Edit the settings
yes
no
no
no
Settings → Incidents → Incident types
View the categories reference
yes
yes
no
no
View the categories charts
yes
yes
no
no
Add categories
yes
yes
no
no
Available if the user has the administrator role in at least one tenant.
Edit categories
yes
yes
no
no
Available if the user has the administrator role in at least one tenant.
Delete categories
yes
yes
no
no
Available if the user has the administrator role in at least one tenant.
Settings → RuCERT
View the parameters
yes
no
no
no
Edit the parameters
yes
no
no
no
Settings → Hierarchy
View the parameters
yes
no
no
no
Edit the parameters
yes
no
no
no
View incidents from child nodes
yes
yes
yes
yes
Metrics
Open metrics
yes
no
no
no
Task manager
View a list of your own tasks
yes
yes
yes
yes
The section and tasks are not tied to a tenant. The tasks are available only to the user who created them.
Finish your own tasks
yes
yes
yes
yes
Restart your own tasks
yes
yes
yes
yes
View a list of all tasks
yes
no
no
no
Finish any task
yes
no
no
no
Restart any task
yes
no
no
no
CyberTrace
This section is not displayed in the web interface unless CyberTrace integration is configured under Settings → CyberTrace.
Open the section
yes
no
no
no
Access to the data of tenants
Access to tenants
yes
yes
yes
yes
A user has access to the main tenant if its name is indicated in the settings blocks of the roles assigned to the user account. The access level depends on which role is indicated for the tenant.
Permissions to access the main tenant do not include access to all tenants, but only provide access to the data of the main tenant.
Main tenant
yes
yes
yes
yes
A shared tenant is used to store shared resources that must be available to all tenants.
Although services cannot be owned by the shared tenant, these services may utilize resources that are owned by the shared tenant. These services are still owned by their respective tenants.
Events, alerts and incidents cannot be shared.
Permissions to access the shared tenant:
- Read/write—only the general administrator.
- Read—all other users, including users that have permissions to access the main tenant.
Shared tenant
yes
yes
yes
yes
A user has access to the main tenant if its name is indicated in the settings blocks of the roles assigned to the user account. The access level depends on which role is indicated for the tenant.
Permissions to access the main tenant do not grant access to other tenants.
Viewing KUMA metrics
Comprehensive information about the performance of the KUMA Core, storage, collectors, and correlators is available in the Metrics section of the KUMA web interface. Selecting this section opens the Grafana portal deployed as part of KUMA Core installation and is updated automatically.
The default Grafana user name and password are admin and admin.
Available metrics
Collector indicators:
- IO—metrics related to the service input and output.
- Processing EPS—the number of processed events per second.
- Processing Latency—the time required to process a single event (the median is displayed).
- Output EPS—the number of events, sent to the destination per second.
- Output Latency—the time required to send a batch of events to the destination and receive a response from it (the median is displayed).
- Output Errors—the number or errors when sending event batches to the destination per second. Network errors and errors writing the disk buffer are displayed separately.
- Output Event Loss—the number of lost events per second. Events can be lost due to network errors or errors writing the disk buffer. Events are also lost if the destination responded with an error code (for example, if the request was invalid).
- Normalization—metrics related to the normalizers.
- Raw & Normalized event size—the size of the raw event and size of the normalized event (the median is displayed).
- Errors—the number of normalization errors per second.
- Filtration—metrics related to the filters.
- EPS—the number of events rejected by the Collector per second. The Collector only rejects events if the user has added a Filter resource into the Collector service configuration.
- Aggregation—metrics related to the aggregation rules.
- EPS—the number of events received and created by the aggregation rule per second. This metric helps determine the effectiveness of aggregation rules.
- Buckets—the number of buckets in the aggregation rule.
- Enrichment—metrics related to the enrichment rules.
- Cache RPS—the number requests to the local cache per second.
- Source RPS—the number of requests to the enrichment source (for example, the Dictionary resource).
- Source Latency—the time required to send a request to the enrichment source and receive a response from it (the median is displayed).
- Queue—the enrichment requests queue size. This metric helps to find bottleneck enrichment rules.
- Errors—the number of enrichment source request errors per second.
Correlator metrics
- IO—metrics related to the service input and output.
- Processing EPS—the number of processed events per second.
- Processing Latency—the time required to process a single event (the median is displayed).
- Output EPS—the number of events, sent to the destination per second.
- Output Latency—the time required to send a batch of events to the destination and receive a response from it (the median is displayed).
- Output Errors—the number or errors when sending event batches to the destination per second. Network errors and errors writing the disk buffer are displayed separately.
- Output Event Loss—the number of lost events per second. Events can be lost due to network errors or errors writing the disk buffer. Events are also lost if the destination responded with an error code (for example, if the request was invalid).
- Correlation—metrics related to the correlation rules.
- EPS—the number of correlation events created per second.
- Buckets—the number of buckets in the correlation rule (only for the standard kind of correlation rules).
- Active Lists—metrics related to the active lists.
- RPS—the number of requests (and their type) to the Active list per second.
- Records—the number of entries in the Active list.
- WAL Size—the size of the Write-Ahead-Log. This metric helps determine the size of the Active list.
Storage indicators
- IO—metrics related to the service input and output.
- RPS—the number of requests to the Storage service per second.
- Latency—the time of proxying a single request to the ClickHouse node (the median is displayed).
Core service metrics
- IO—metrics related to the service input and output.
- RPS—the number of requests to the Core service per second.
- Latency—the time of processing a single request (the median is displayed).
- Errors—the number of request errors per second.
- Notification Feed—metrics related to user activity
- Subscriptions—the number of clients, connected to the Core via SSE to receive server messages in real time. This number usually correlates with the number of clients using the KUMA web interface.
- Errors—the number of message sending errors per second.
- Schedulers—metrics related to Core tasks
- Active—the number of repeating active system tasks. The tasks created by the user are ignored.
- Latency—the time of processing a single request (the median is displayed).
- Position—the position (timestamp) of the alert creation task. The next ClickHouse scan for correlation events will start from this position.
- Errors—the number of task errors per second.
General metrics common for all services
- Process—general process metrics.
- CPU—CPU usage.
- Memory—RAM usage (RSS).
- DISK IOPS—the number of disk read/write operations per second.
- DISK BPS—the number of bytes read/written to the disk per second.
- Network BPS—the number of bytes received/sent per second.
- Network Packet Loss—the number of network packets lost per second.
- GC Latency—the time of the GO Garbage Collector cycle (the median is displayed).
- Goroutines—the number of active goroutines. This number differs from the thread count.
- OS—metrics related to the operating system.
- Load—the average load.
- CPU—CPU usage.
- Memory—RAM usage (RSS).
- Disk—disk space usage.
Metrics storage period
KUMA operation data is saved for 3 months by default. This storage period can be changed.
To change the storage period for KUMA metrics:
- Log in to the OS of the server where the KUMA Core is installed.
- In the file /etc/systemd/system/multi-user.target.wants/kuma-victoria-metrics.service, in the ExecStart parameter, edit the
--retentionPeriod=<metrics storage period, in months>flag by inserting the necessary period. For example,--retentionPeriod=4means that the metrics will be stored for 4 months. - Restart KUMA by running the following commands in sequence:
- systemctl daemon-reload
- systemctl restart kuma-victoria-metrics
The storage period for metrics has been changed.
Page top
Viewing KUMA tasks
In the Task manager section you can see the tasks created by the current user. The user with the general administrator role can see the tasks of all users.
The Task manager window displays the list of created tasks with the following columns:
- State—the state of the task.
- Green dot blinking—the task is active.
- The icon—the task is complete.
- Cancel—the task was canceled by the user.
- Error—the task was not completed because of an error. The error message is displayed if you hover the mouse over the exclamation mark icon.
- Task—the task type. Available task kinds:
- event-export—event export task.
- ktl—task for requesting information from the Kaspersky Threat Intelligence Portal.
- replay—task for replaying events.
- Created by—which user created the task. This column is only displayed for user with roles General administrator and Administrator.
- Time created—when the task was created.
- Time updated—when the task was updated.
You can cancel an active task by clicking the task type name and selecting Cancel in the drop-down list.
It is also possible to repeat the task by clicking the task type name and selecting Restart in the drop-down list.
Displayed date format:
- English localization: YYYY-MM-DD.
- Russian localization: DD.MM.YYYY.
Managing SMTP server connection
KUMA can be configured to send email notifications using an SMTP server. Users will receive notifications if the Receive notification by SMTP check box is selected in their profile settings.
Only one SMTP server can be added to process KUMA notifications. An SMTP server connection is managed in the Settings → Notifications section of the KUMA web interface.
To configure SMTP server connection:
- In the Resources section of the KUMA web interface, open the Secrets tab.
The list of available secrets will be displayed.
- Click the Add secret button to create a new secret. This resource is used to store credentials of the SMTP server.
The secret window is displayed.
- Enter information about the secret:
- In the Name field, choose a name for the added secret.
- In the Type drop-down list, select credentials.
- In the User and Password fields, enter credentials for your SMTP server.
- If you want, enter a Description of the secret.
- Click Save.
The SMTP server credentials are now saved and can be used in other KUMA resources.
- Open the KUMA web interface and select Settings → Notifications.
- Make the necessary changes to the following parameters:
- Disabled—select this check box if you want to disable connection to the SMTP server.
- Host (required)—SMTP host in one of the following formats: hostname, IPv4, IPv6.
- Port (required)—SMTP port. The value must be an integer from 1 to 65535.
- From (required)—valid email address of the notification sender. For example,
kuma@company.com.
- In the Secret drop-down list select the Secret resource you created before.
- Select the necessary frequency of notifications in the Monitoring notifications interval drop-down list.
- Turn on the Disable monitoring notifications toggle button if you do not want to receive notifications about the state of event sources. The toggle switch is turned off by default.
- Click Save.
The SMTP server connection is now configured and users can receive email messages from KUMA.
Page top
Opening Online Help for KUMA
Online Help is available on the Kaspersky web resource.
Online Help provides information regarding the following tasks:
- Preparing to install and installing KUMA.
- Configuring and using KUMA.
To open Online Help for KUMA:
Log in to the KUMA web interface, click the name of your user account in the lower-left corner of the window, then click the Help button in the opened menu.
Page top
KUMA logs
Some KUMA services and resources can log information related to their functioning. This feature is enabled by using the Debug drop-down list or check box in the settings of the service or the resource.
The logs are stored on the machine where the required service or the service using the required resource is installed:
- Logs residing on Linux machines can be viewed using the
journalctlcommand in the Linux console.Examples:
journalctl -u kuma-collector * kuma-correlator * -fwill return the latest logs from the collectors and the correlators installed on the server where the command was executed.journalctl -u kuma-collector-<service ID>will return the latest logs of the specific collector installed on the server where the command was executed.
- Logs on Windows machines can be viewed in the file located at the path %PROGRAMDATA%\Kaspersky Lab\KUMA\<Agent ID>\agent.log. The activity of Agents on Windows machines is always logged if they are assigned the logon as a service permission. Data is specified in more detail when the Debug check box is selected.
Services where logging is available:
- Correlators
- Collectors
- Agents
Resources where logging is available:
- Connectors
- Enrichment rules
- Destinations
KUMA backup
KUMA allows you to back up the KUMA Core database and certificates. Backups may be created using the executable file /opt/kaspersky/kuma/kuma.
Data may only be restored from a backup if it is restored to the KUMA of the same version as the backup one.
To perform a backup:
- Log in to the OS of the server where the KUMA Core is installed.
- Execute the following command:
sudo /opt/kaspersky/kuma/kuma tools backup --dst <path to folder for backup copy> --certificatesThe flag
--certificatesis optional and is used to back up certificates.
The backup copy has been created.
To restore data from a backup:
- Log in to the OS of the server where the KUMA Core is installed.
- On the KUMA Core server, run the following command:
sudo systemctl stop kuma-core - Execute the following command:
sudo /opt/kaspersky/kuma/kuma tools restore --src <path to folder containing backup copy> --certificatesThe
--certificatesflag is optional and is used to restore certificates. - Start KUMA by running the following command:
sudo systemctl start kuma-core - Rebuild the services using the recovered service resource sets.
Data is restored from the backup.
What to do if KUMA malfunctions after restoring data from a backup copy
Backup of collectors is not required unless the collectors have an SQL connection. When restoring such collectors, you should revert to the original initial value of the ID.
Page top
KUMA notifications
KUMA can be configured to send email notifications using SMTP server. To do so, configure a connection to SMTP server and select the Receive notification by SMTP check box for users who should receive notifications.
KUMA automatically notifies users about the following events:
- A report was created (the users listed in the report template receive a notification)
- An alert was created (all users receive a notification)
- An alert was assigned to a user (the user to whom the alert was assigned receives a notification).
Contacting Technical Support
If you are unable to find a solution to your issue in the program documentation, please contact Kaspersky Technical Support.
Kaspersky provides technical support for this program throughout its lifecycle (please refer to the product support lifecycle page).
Page top
REST API
You can access KUMA from third-party solutions using the API. The KUMA REST API operates over HTTP and consists of a set of request/response methods.
REST API requests must be sent to the following address:
https://<KUMA Core FQDN>/api/<API version>/<request>
Example: https://kuma.example.com:7223/api/v1 |
By default the 7223 port is used for API requests. You can change the port.
To change port used for REST API requests:
In the file /etc/systemd/system/multi-user.target.wants/kuma-core.service in the string ExecStart=/opt/kaspersky/kuma/kuma core --external :7220 --internal :7210 --mongo mongodb://localhost:27017 add the flag --rest <required port number for REST API requests>.
- Log in to the OS of the server where the KUMA Core is installed.
- In the file /etc/systemd/system/multi-user.target.wants/kuma-core.service change the following string, adding required port:
ExecStart=/opt/kaspersky/kuma/kuma core --external :7220 --internal :7210 --mongo mongodb://localhost:27017 --rest <required port number for REST API requests> - Restart KUMA by running the following commands in sequence:
systemctl daemon-reloadsystemctl restart kuma-core
New port is used for REST API.
Make sure that the port is available and is not closed by the firewall.
Authentication header: Authorization: Bearer <token>
Default data format: JSON
Date and time format: RFC 3339
Intensity of requests: unlimited
Creating a token
To generate a token for a user:
- In the KUMA web interface, open Settings → Users.
In the right part of the Settings section the Users table will be displayed.
- Select the relevant user and click the Generate token button in the details area that opens on the right.
When you click this button, the user details area displays a field containing the automatically created token. When the window is closed, the token is no longer displayed. If you did not copy the token before closing the window, you will have to generate a new token.
- Click Save.
The token is generated and can be used for API requests. These same steps can be taken to generate a token in your account profile.
Page top
Authorizing API requests
Each REST API request must include token-based authorization.
Each request must be accompanied by the following header:
Authorization: Bearer <token>
Possible errors:
Standard error
Errors returned by KUMA have the following format:
|
Viewing a list of active lists on the correlator
GET /api/v1/activeLists
The target correlator must be running.
Access: administrator and analyst.
Query parameters
Name |
Data type |
Mandatory |
Description |
Value example |
correlatorID |
string |
Yes |
Correlator service ID |
00000000-0000-0000-0000-000000000000 |
Response
HTTP code: 200
Format: JSON
|
Possible errors
HTTP code |
Description |
message field value |
details field value |
400 |
Correlator service ID is not specified |
query parameter required |
correlatorID |
403 |
The user does not have the required role in the correlator tenant |
access denied |
|
404 |
The service with the specified identifier (correlatorID) was not found |
service not found |
|
406 |
The service with the specified ID (correlatorID) is not a correlator |
service is not correlator |
|
406 |
The correlator did not execute the first start |
service not paired |
|
406 |
The correlator tenant is disabled. |
tenant disabled |
|
50x |
Failed to access the correlator API |
correlator API request failed |
variable |
500 |
Failed to decode the response body received from the correlator |
correlator response decode failed |
variable |
500 |
Any other internal errors |
variable |
variable |
Import entries to an active list
POST /api/v1/activeLists/import
The target correlator must be running.
Access: administrator and analyst.
Query parameters
Name |
Data type |
Mandatory |
Description |
Value example |
correlatorID |
string |
Yes |
Correlator service ID |
00000000-0000-0000-0000-000000000000 |
activeListID |
string |
If activeListName is not specified |
Active list ID |
00000000-0000-0000-0000-000000000000 |
activeListName |
string |
If activeListID is not specified |
Active list name |
Attackers |
format |
string |
Yes |
Format of imported entries |
csv, tsv, internal |
keyField |
string |
For the CSV and TSV formats only |
The name of the field in the header of the CSV or TSV file that will be used as the key field of the active list record. The values of this field must be unique |
ip |
clear |
bool |
No |
Clear the active list before importing. If the parameter is present in the URL query, then its value is assumed to be true. The values specified by the user are ignored. Example: /api/v1/activeLists/import?clear |
|
Request body
Format |
Contents |
csv |
The first line is the header, which lists the comma-separated fields. The rest of the lines are the values corresponding to the comma-separated fields in the header. The number of fields in each line must be the same. |
tsv |
The first line is the header, which lists the TAB-separated fields. The remaining lines are the values corresponding to the TAB-separated fields in the header. The number of fields in each line must be the same. |
internal |
Each line contains one individual JSON object. Data in the internal format can be received by exporting the contents of the active list from the correlator in the KUMA web console. |
Response
HTTP code: 204
Possible errors
HTTP code |
Description |
message field value |
details field value |
400 |
Correlator service ID is not specified |
query parameter required |
correlatorID |
400 |
Neither the activeListID parameter nor the activeListName parameter is specified |
one of query parameters required |
activeListID, activeListName |
400 |
The format parameter is not specified |
query parameter required |
format |
400 |
The format parameter is invalid |
invalid query parameter value |
format |
400 |
The keyField parameter is not specified |
query parameter required |
keyField |
400 |
The request body has a zero-length |
request body required |
|
400 |
The CSV or TSV file does not contain the field specified in the keyField parameter |
correlator API request failed |
line 1: header does not contain column <name> |
400 |
Request body parsing error |
correlator API request failed |
line <number>: <message> |
403 |
The user does not have the required role in the correlator tenant |
access denied |
|
404 |
The service with the specified identifier (correlatorID) was not found |
service not found |
|
404 |
No active list was found |
active list not found |
|
406 |
The service with the specified ID (correlatorID) is not a correlator |
service is not correlator |
|
406 |
The correlator did not execute the first start |
service not paired |
|
406 |
The correlator tenant is disabled. |
tenant disabled |
|
406 |
A name search was conducted for the active list (activeListName), and more than one active list was found |
more than one matching active lists found |
|
50x |
Failed to access the correlator API |
correlator API request failed |
variable |
500 |
Failed to decode the response body received from the correlator |
correlator response decode failed |
variable |
500 |
Any other internal errors |
variable |
variable |
Searching alerts
GET /api/v1/alerts
Access: administrator, analyst, and operator.
Query parameters
Name |
Data type |
Mandatory |
Description |
Value example |
page |
number |
No |
Page number. Starts with 1. The page size is 250 entries. If the parameter is not specified, the default value is 1. |
1 |
id |
string |
No |
Alert ID. If the parameter is specified several times, then a list is generated and the logical OR operator is applied. |
00000000-0000-0000-0000-000000000000 |
TenantID |
string |
No |
Alert tenant ID. If the parameter is specified several times, then a list is generated and the logical OR operator is applied. If the user does not have the required role in the specified tenant, then this tenant is ignored. |
00000000-0000-0000-0000-000000000000 |
name |
string |
No |
Alert name. Case-insensitive regular expression (PCRE). |
alert |
timestampField |
string |
No |
The name of the alert field that is used to perform sorting (DESC) and search by period (from-to). lastSeen by default |
lastSeen, firstSeen |
from |
string |
No |
Lower bound of the period in RFC3339 format. <timestampField> >= <from> |
2021-09-06T00:00:00Z (UTC) 2021-09-06T00:00:00.000Z (UTC, including milliseconds) 2021-09-06T00:00:00Z+00:00 (MSK) |
to |
string |
No |
Upper bound of the period in RFC3339 format. <timestampField> <= <to> |
2021-09-06T00:00:00Z (UTC) 2021-09-06T00:00:00.000Z (UTC, including milliseconds) 2021-09-06T00:00:00Z+00:00 (MSK) |
status |
string |
No |
Alert status. If the parameter is specified several times, then a list is generated and the logical OR operator is applied. |
new, assigned, escalated, closed |
withEvents |
bool |
No |
Include normalized KUMA events associated with found alerts in the response. If the parameter is present in the URL query, then its value is assumed to be true. The values specified by the user are ignored. Example: /api/v1/alerts?withEvents |
|
withAffected |
bool |
No |
Include information about the assets and accounts associated with the found alerts in the report. If the parameter is present in the URL query, then its value is assumed to be true. The values specified by the user are ignored. Example: /api/v1/alerts?withAffected |
|
Response
HTTP code: 200
Format: JSON
|
Possible errors
HTTP code |
Description |
message field value |
details field value |
400 |
Invalid value of the "page" parameter |
invalid query parameter value |
page |
400 |
Invalid value of the "status" parameter |
invalid status |
<status> |
400 |
Invalid value of the "timestampField" parameter |
invalid timestamp field |
|
400 |
Invalid value of the "from" parameter |
cannot parse from |
variable |
400 |
Invalid value of the "to" parameter |
cannot parse to |
variable |
400 |
The value of the "from" parameter is greater than the value of the "to" parameter |
from cannot be greater than to |
|
500 |
Any other internal errors |
variable |
variable |
Closing alerts
POST /api/v1/alerts/close
The target correlator must be running.
Access: administrator, analyst, and operator.
Request body
Format: JSON
Name |
Data type |
Mandatory |
Description |
Value example |
id |
string |
Yes |
Alert ID |
00000000-0000-0000-0000-000000000000 |
reason |
string |
Yes |
Reason for closing the alert |
responded, incorrect data, incorrect correlation rule |
Response
HTTP code: 204
Possible errors
HTTP code |
Description |
message field value |
details field value |
400 |
Alert ID is not specified |
id required |
|
400 |
The reason for closing the alert is not specified |
reason required |
|
400 |
Invalid value of the "reason" parameter |
invalid reason |
|
403 |
The user does not have the required role in the alert tenant |
access denied |
|
404 |
Alert not found |
alert not found |
|
406 |
Alert tenant disabled |
tenant disabled |
|
406 |
Alert already closed |
alert already closed |
|
500 |
Any other internal errors |
variable |
variable |
Searching assets
GET /api/v1/assets
Access: administrator, analyst, and operator.
Query parameters
Name |
Data type |
Mandatory |
Description |
Value example |
page |
number |
No |
Page number. Starts with 1. The page size is 250 entries. If the parameter is not specified, the default value is 1. |
1 |
id |
string |
No |
Asset ID. If the parameter is specified several times, then a list is generated and the logical OR operator is applied. |
00000000-0000-0000-0000-000000000000 |
TenantID |
string |
No |
Asset tenant ID. If the parameter is specified several times, then a list is generated and the logical OR operator is applied. If the user does not have the required role in the specified tenant, then this tenant is ignored. |
00000000-0000-0000-0000-000000000000 |
name |
string |
No |
Asset name. Case-insensitive regular expression (PCRE). |
asset ^My asset$ |
fqdn |
string |
No |
Asset FQDN. Case-insensitive regular expression (PCRE). |
^com$ |
ip |
string |
No |
Asset IP address. Case-insensitive regular expression (PCRE). |
10.10 ^192.168.1.2$ |
mac |
string |
No |
Asset MAC address. Case-insensitive regular expression (PCRE). |
^00:0a:95:9d:68:16$ |
Response
HTTP code: 200
Format: JSON
|
Possible errors
Importing assets
Details on identifying, creating, and updating assets
Asset identification varies depending on whether those assets reside in zones with dynamic addresses or static addresses:
- Dynamic address zone: the asset ID is the FQDN of the asset and the first IP address from the asset's specified array of addresses.
- Static address zone: the asset ID is the first IP address from the asset's specified array of addresses.
The conditions for automatic creation of assets also depend on the particular address zone:
- Dynamic address zone:
- IP address: 192.168.1.1; host name: host.example.com – asset is created.
- IP address: 192.168.1.1; host name: none – asset is not created.
- IP address: none; host name: host.example.com – asset is not created.
- Static address zone:
- IP address: 192.168.1.1; host name: host.example.com – asset is created.
- IP address: 192.168.1.1; host name: none – asset is created.
- IP address: none; host name: host.example.com – asset is not created.
The rules for creating assets based on network scanner reports are the same for creating assets in static address zones. If the asset name is not specified, it is filled with either the FQDN value or the value of the first IP address.
The conditions for asset data updates are provided in the table below. If there are any conflicts that prevent new data from being correlated with existing assets, new assets are created.
|
Manually created asset |
Asset imported from Kaspersky Security Center |
Asset created based on events |
Asset created based on reports of network scanners |
Asset is manually updated |
No restrictions |
No restrictions |
No restrictions |
No restrictions |
Asset is updated with data from Kaspersky Security Center |
If the IP address and FQDN of assets match:
|
When the Kaspersky Security Center server and Agent ID match, data on the asset is updated. |
If the IP address and FQDN of assets match:
|
If the IP addresses and FQDNs of assets match, vulnerability information is added. |
Asset is updated with data from events |
|
|
|
|
Asset is updated with data from reports of network scanners |
Vulnerability information is added if:
|
If the IP addresses and FQDNs of assets match, vulnerability information is added. |
Vulnerability information is added if:
|
Vulnerability information is added if:
|
Conflicts during asset data updates prevent the processing of the conflicting asset, but do not prevent the processing of other assets specified in the request body.
POST /api/v1/assets/import
Bulk creation or update of assets.
Access: administrator and analyst.
Request body
Format: JSON
|
Request mandatory fields
Name |
Data type |
Mandatory |
Description |
Value example |
TenantID |
string |
Yes |
Tenant ID |
00000000-0000-0000-0000-000000000000 |
assets |
[]Asset |
Yes |
Array of imported assets |
|
Asset mandatory fields
Name |
Data type |
Mandatory |
Description |
Value example |
fqdn |
string |
If the ipAddresses array is not specified |
Asset FQDN. It is recommended that you specify the FQDN and not just the host name. Priority indicator for asset identification. |
my-asset-1.example.com my-asset-1 |
ipAddresses |
[]string |
If FQDN is not specified |
Array of IP addresses for the asset. IPv4 or IPv6. The first element of the array is used as a secondary indicator for asset identification. |
["192.168.1.1", "192.168.2.2"] ["2001:0db8:85a3:0000:0000:8a2e:0370:7334"] |
Response
HTTP code: 200
Format: JSON
|
Possible errors
HTTP code |
Description |
message field value |
details field value |
400 |
Tenant ID is not specified |
tenantID required |
|
400 |
Attempt to import assets into the shared tenant |
import into shared tenant not allowed |
|
400 |
Not a single asset was specified in the request body |
at least one asset required |
|
400 |
None of the mandatory fields is specified |
one of fields required |
asset[<index>]: fqdn, ipAddresses |
400 |
Invalid FQDN |
invalid value |
asset[<index>].fqdn |
400 |
Invalid IP address |
invalid value |
asset[<index>].ipAddresses[<index>] |
400 |
IP address is repeated |
duplicated value |
asset[<index>].ipAddresses |
400 |
Invalid MAC address |
invalid value |
asset[<index>].macAddresses[<index>] |
400 |
MAC address is repeated |
duplicated value |
asset[<index>].macAddresses |
403 |
The user does not have the required role in the specified tenant |
access denied |
|
404 |
The specified tenant was not found |
tenant not found |
|
406 |
The specified tenant was disabled |
tenant disabled |
|
500 |
Any other internal errors |
variable |
variable |
Deleting assets
POST /api/v1/assets/delete
Access: administrator and analyst.
Request body
Format: JSON
Name |
Data type |
Mandatory |
Description |
Value example |
TenantID |
string |
Yes |
Tenant ID |
00000000-0000-0000-0000-000000000000 |
ids |
[]string |
If neither the ipAddresses array nor the FQDNs are specified |
List of asset IDs |
["00000000-0000-0000-0000-000000000000"] |
fqdns |
[]string |
If neither the ipAddresses array nor the IDs are specified |
Array of asset FQDNs |
["my-asset-1.example.com", "my-asset-1"] |
ipAddresses |
[]string |
If neither the IDs nor FQDNs are specified |
Array of primary IP addresses of assets (the first element of the ipAddresses array in the import request) |
["192.168.1.1", "2001:0db8:85a3:0000:0000:8a2e:0370:7334"] |
Response
HTTP code: 200
Format: JSON
|
Possible errors
HTTP code |
Description |
message field value |
details field value |
400 |
Tenant ID is not specified |
tenantID required |
|
400 |
Attempt to delete an asset from the shared tenant |
delete from shared tenant not allowed |
|
400 |
None of the mandatory fields is specified |
one of fields required |
ids, fqdns, ipAddresses |
400 |
Invalid FQDN specified |
invalid value |
fqdns[<index>] |
400 |
Invalid IP address specified |
invalid value |
ipAddresses[<index>] |
403 |
The user does not have the required role in the specified tenant |
access denied |
|
404 |
The specified tenant was not found |
tenant not found |
|
406 |
The specified tenant was disabled |
tenant disabled |
|
500 |
Any other internal errors |
variable |
variable |
Searching events
POST /api/v1/events
Access: administrator, analyst, and operator.
Request body
Format: JSON
Request
Name |
Data type |
Mandatory |
Description |
Value example |
period |
Period |
Yes |
Search period |
|
sql |
string |
Yes |
SQL query |
SELECT * FROM events WHERE Type = 3 ORDER BY Timestamp DESC LIMIT 1000 SELECT sum(BytesOut) as TotalBytesSent, SourceAddress FROM events WHERE DeviceVendor = 'netflow' GROUP BY SourceAddress LIMIT 1000 SELECT count(Timestamp) as TotalEvents FROM events LIMIT 1 |
ClusterID |
string |
No, if the cluster is the only one |
Storage cluster ID. You can find it by requesting a list of services with kind = storage. The cluster ID will be in the resourceID field. |
00000000-0000-0000-0000-000000000000 |
rawTimestamps |
bool |
No |
Display timestamps in their current format—Milliseconds since EPOCH. False by default. |
true or false |
emptyFields |
bool |
No |
Display empty fields for normalized events. False by default. |
true or false |
Period
Name |
Data type |
Mandatory |
Description |
Value example |
from |
string |
Yes |
Lower bound of the period in RFC3339 format. Timestamp >= <from> |
2021-09-06T00:00:00Z (UTC) 2021-09-06T00:00:00.000Z (UTC, including milliseconds) 2021-09-06T00:00:00Z+00:00 (MSK) |
to |
string |
Yes |
Upper bound of the period in RFC3339 format. Timestamp <= <to> |
2021-09-06T00:00:00Z (UTC) 2021-09-06T00:00:00.000Z (UTC, including milliseconds) 2021-09-06T00:00:00Z+00:00 (MSK) |
Response
HTTP code: 200
Format: JSON
Result of executing the SQL query
Possible errors
HTTP code |
Description |
message field value |
details field value |
|---|---|---|---|
400 |
The lower bounds of the range is not specified |
period.from required |
|
400 |
The lower bounds of the range is in an unsupported format |
cannot parse period.from |
variable |
400 |
The lower bounds of the range is equal to zero |
period.from cannot be 0 |
|
400 |
The upper bounds of the range is not specified |
period.to required |
|
400 |
The upper bounds of the range is in an unsupported format |
cannot parse period.to |
variable |
400 |
The upper bounds of the range is equal to zero |
period.to cannot be 0 |
|
400 |
The lower bounds of the range is greater than the upper bounds |
period.from cannot be greater than period.to |
|
400 |
Invalid SQL query |
invalid sql |
variable |
400 |
An invalid table appears in the SQL query |
the only valid table is `events` |
|
400 |
The SQL query lacks a LIMIT |
sql: LIMIT required |
|
400 |
The LIMIT in the SQL query exceeds the maximum (1000) |
sql: maximum LIMIT is 1000 |
|
404 |
Storage cluster not found |
cluster not found |
|
406 |
The clusterID parameter was not specified, and many clusters were registered in KUMA |
multiple clusters found, please provide clusterID |
|
500 |
No available cluster nodes |
no nodes available |
|
50x |
Any other internal errors |
event search failed |
variable |
Viewing information about the cluster
GET /api/v1/events/clusters
Access: administrator, analyst, and operator.
The main tenant clusters are accessible to all users.
Query parameters (URL Query)
Name |
Data type |
Mandatory |
Description |
Value example |
|---|---|---|---|---|
page |
number |
No |
Page number. Starts with 1. The page size is 250 entries. If the parameter is not specified, the default value is 1. |
1 |
id |
string |
No |
Cluster ID. If the parameter is specified several times, then a list is generated and the logical OR operator is applied |
00000000-0000-0000-0000-000000000000 |
TenantID |
string |
No |
Tenant ID. If the parameter is specified several times, then a list is generated and the logical OR operator is applied. If the user does not have the required role in the specified tenant, then this tenant is ignored. |
00000000-0000-0000-0000-000000000000 |
name |
string |
No |
Cluster name. Case-insensitive regular expression (PCRE). |
cluster |
Response
HTTP code: 200
Format: JSON
|
Possible errors
HTTP code |
Description |
message field value |
details field value |
|---|---|---|---|
400 |
Invalid value of the "page" parameter |
invalid query parameter value |
page |
500 |
Any other internal errors |
variable |
variable |
Resource search
GET /api/v1/resources
Access: administrator, analyst, and operator.
Query parameters (URL Query)
Name |
Data type |
Mandatory |
Description |
Value example |
page |
number |
No |
Page number. Starts with 1. The page size is 250 entries. If the parameter is not specified, the default value is 1. |
1 |
id |
string |
No |
Resource ID. If the parameter is specified several times, then a list is generated and the logical OR operator is applied. |
00000000-0000-0000-0000-000000000000 |
TenantID |
string |
No |
Resource tenant ID. If the parameter is specified several times, then a list is generated and the logical OR operator is applied. If the user does not have the required role in the specified tenant, then this tenant is ignored. |
00000000-0000-0000-0000-000000000000 |
name |
string |
No |
Resource name. Case-insensitive regular expression (PCRE). |
resource |
kind |
string |
No |
Resource type. If the parameter is specified several times, then a list is generated and the logical OR operator is applied |
collector, correlator, storage, activeList, aggregationRule, connector, correlationRule, dictionary, enrichmentRule, destination, filter, normalizer, responseRule, search, agent, proxy, secret |
Response
HTTP code: 200
Format: JSON
|
Possible errors
Loading resource file
POST /api/v1/resources/upload
Access: administrator and analyst.
Request body
Encrypted contents of the resource file in binary format.
Response
HTTP code: 200
Format: JSON
File ID. It should be specified in the body of requests for viewing the contents of the file and for importing resources.
|
Possible errors
Viewing the contents of a resource file
POST /api/v1/resources/toc
Access: administrator, analyst, and operator.
Request body
Format: JSON
Name |
Data type |
Mandatory |
Description |
Value example |
fileID |
string |
Yes |
The file ID obtained as a result of loading the resource file. |
00000000-0000-0000-0000-000000000000 |
password |
string |
Yes |
Resource file password. |
SomePassword!88 |
Response
HTTP code: 200
Format: JSON
File version, list of resources, categories, and folders.
The ID of the retrieved resources must be used when importing.
|
Importing resources
POST /api/v1/resources/import
Access: administrator and analyst.
Request body
Name |
Data type |
Mandatory |
Description |
Value example |
|
fileID |
string |
Yes |
The file ID obtained as a result of loading the resource file. |
00000000-0000-0000-0000-000000000000 |
|
password |
string |
Yes |
Resource file password. |
SomePassword!88 |
|
TenantID |
string |
Yes |
ID of the target tenant |
00000000-0000-0000-0000-000000000000 |
|
actions |
map[string]uint8 |
Yes |
Mapping of the resource ID to the action that must be taken in relation to it. |
0—do not import (used when resolving conflicts) 1—import (should initially be assigned to each resource) 2—replace (used when resolving conflicts)
|
Response
HTTP code |
Body |
|
204 |
|
|
409 |
The imported resources conflict with the existing ones by ID. In this case, you need to repeat the import operation while specifying the following actions for these resources: 0—do not import 2—replace
|
Exporting resources
POST /api/v1/resources/export
Access: administrator and analyst.
Request body
Format: JSON
Name |
Data type |
Mandatory |
Description |
Value example |
ids |
[]string |
Yes |
Resource IDs to be exported |
["00000000-0000-0000-0000-000000000000"] |
password |
string |
Yes |
Exported resource file password |
SomePassword!88 |
TenantID |
string |
Yes |
ID of the tenant that owns the exported resources |
00000000-0000-0000-0000-000000000000 |
Response
HTTP code: 200
Format: JSON
ID of the file with the exported resources. It should be used in a request to download the resource file.
|
Downloading the resource file
GET /api/v1/resources/download/<id>
Here "id" is the file ID obtained as a result of executing a resource export request.
Access: administrator and analyst.
Response
HTTP code: 200
Encrypted contents of the resource file in binary format.
Possible errors
HTTP code |
Description |
message field value |
details field value |
400 |
File ID not specified |
route parameter required |
id |
400 |
The file ID is not a valid UUID |
id is not a valid UUID |
|
403 |
The user does not have the required roles in any of the tenants |
access denied |
|
404 |
File not found |
file not found |
|
406 |
The file is a directory |
not regular file |
|
500 |
Any other internal errors |
variable |
variable |
Search for services
GET /api/v1/services
Access: administrator and analyst.
Query parameters (URL Query)
Name |
Data type |
Mandatory |
Description |
Value example |
page |
number |
No |
Page number. Starts with 1. The page size is 250 entries. If the parameter is not specified, the default value is 1. |
1 |
id |
string |
No |
Service ID. If the parameter is specified several times, then a list is generated and the logical OR operator is applied. |
00000000-0000-0000-0000-000000000000 |
TenantID |
string |
No |
Service tenant ID. If the parameter is specified several times, then a list is generated and the logical OR operator is applied. If the user does not have the required role in the specified tenant, then this tenant is ignored. |
00000000-0000-0000-0000-000000000000 |
name |
string |
No |
Service name. Case-insensitive regular expression (PCRE). |
service |
kind |
string |
No |
Service type. If the parameter is specified several times, then a list is generated and the logical OR operator is applied |
collector, correlator, storage, agent |
fqdn |
string |
No |
Service FQDN. Case-insensitive regular expression (PCRE). |
hostname ^hostname.example.com$ |
paired |
bool |
No |
Display only those services that executed the first start. If the parameter is present in the URL query, then its value is assumed to be true. The values specified by the user are ignored. Example: /api/v1/services?paired |
|
Response
HTTP code: 200
Format: JSON
|
Possible errors
HTTP code |
Description |
message field value |
details field value |
400 |
Invalid value of the "page" parameter |
invalid query parameter value |
page |
400 |
Invalid value of the "kind" parameter |
invalid kind |
<kind> |
500 |
Any other internal errors |
variable |
variable |
Tenant search
GET /api/v1/tenants
Only tenants available to the user are displayed.
Access: administrator and analyst.
Query parameters (URL Query)
Name |
Data type |
Mandatory |
Description |
Value example |
page |
number |
No |
Page number. Starts with 1. The page size is 250 entries. If the parameter is not specified, the default value is 1. |
1 |
id |
string |
No |
Tenant ID. If the parameter is specified several times, then a list is generated and the logical OR operator is applied. |
00000000-0000-0000-0000-000000000000 |
name |
string |
No |
Tenant name. Case-insensitive regular expression (PCRE). |
tenant |
main |
bool |
No |
Only display the main tenant. If the parameter is present in the URL query, then its value is assumed to be true. The values specified by the user are ignored. Example: /api/v1/tenants?main |
|
Response
HTTP code: 200
Format: JSON
|
Possible errors
View token bearer information
GET /api/v1/users/whoami
Response
HTTP code: 200
Format: JSON
|
Appendices
This section provides information that complements the main document text with reference information.
Commands for components manual starting and installing
This section contains the parameters of KUMA's executable file /opt/kaspersky/kuma/kuma that can be used to manually start or install KUMA services. This may be useful for when you need to see output in the server operating system console.
Commands parameters
Commands |
Description |
|
Start KUMA administration tools. |
|
Install, start, or uninstall a Collector service. |
|
Install, start, or uninstall a Core service. |
|
Install, start, or uninstall a Correlator service. |
|
Get information about available commands and parameters. |
|
Get information about license. |
|
Start or install a Storage. |
|
Get information about version of the program. |
Flags:
-h, --h are used to get help about any kuma command. For example, kuma <component> --help.
Examples:
kuma versionis used to get version of the KUMA installer.kuma core -his used to get help aboutcorecommand of KUMA installer.kuma collector --core <address of the server where the collector should obtain its settings> --id <ID of the installed service> --api.port <port>is used to start collector service installation.
Normalized event data model
This section presents the KUMA normalized event data model. All events that are processed by KUMA Correlator to detect alerts must be compliant to this model.
Events that are not compliant to this data model must be imported into this format (or normalized) using Collectors.
Normalized event data model
Field name |
Field type |
Description |
AggregationRuleName |
Internal |
The name of the aggregation rule that processed the event. |
BaseEventIDs |
Internal |
IDs of events that triggered creation of the correlation event. |
Code |
Internal |
In a base event, this is the code of a process, function or operation return from the source. In a correlation event, the alert code for the first line support or the template code of the notification to be submitted is written to this field. |
CorrelationRuleName |
Internal |
It is filled in only for the correlation event. The name of the correlation rule that gave rise to the correlation event. |
ID |
Internal |
Unique event ID of UID type. The collector generates the ID for the base event that is generated in the collector. The correlator generates the ID of the correlation event. The ID never changes its value. You can search for the event in Storage using this ID. |
Raw |
Internal |
Text of the source "as is" event. |
Score |
Internal |
It is filled in for events that were processed by the triggered correlation rule. This is the priority of the identified <incident> that was specified in the correlation rule. |
ServiceAddress |
Internal |
IP address of the host on which the service is deployed. |
ServiceID |
Internal |
Identifier of a service instance: correlator, collector, storage. |
ServiceKind |
Internal |
Service type: correlator, collector, storage |
ServiceName |
Internal |
The name of the service instance that the KUMA administrator assigns the service when it is created. |
Tactic |
Internal |
Name of the tactic from MITRE |
Technique |
Internal |
Name of the technique from MITRE |
Timestamp |
Internal |
Timestamp of the base event created in the collector. Timestamp of the correlation event created in the collector. The time is specified in UTC0. |
Extra |
Internal |
Used for mapping unparsed values during event normalization. |
TICategories |
Internal |
Threat intelligence categories that were received from external TI sources in response to receiving event indicators. |
DeviceVendor |
CEF |
Name of the log source producer. The value is taken from the raw event. The DeviceVendor, DeviceProduct, and DeviceVersion all uniquely identify the log source. |
DeviceProduct |
CEF |
Product name from the log source. The value is taken from the raw event. The DeviceVendor, DeviceProduct, and DeviceVersion all uniquely identify the log source. |
DeviceVersion |
CEF |
Product version from the log source. The value is taken from the raw event. The DeviceVendor, DeviceProduct, and DeviceVersion all uniquely identify the log source. |
DeviceEventClassID |
CEF |
Unique ID for the event type from the log source. Certain log sources categorize events. |
Name |
CEF |
Event name in the raw event. |
Severity |
CEF |
Error priority from the raw event. This can be a Severity field or a Level field, etc., depending on the log. |
DeviceAction |
CEF |
Action taken by the asset. The action that was taken by the producer of the log source. For example, blocked, detected. |
ApplicationProtocol |
CEF |
Application Level Protocol (HTTP, HTTPS, Telnet, and so on) |
DeviceCustomIPv6Address1 |
CEF |
Field for mapping IPv6 address value that cannot be mapped to any other data model element. It can be used to process the logs of network assets where you need to distinguish between the IP addresses of various assets (for firewalls, etc.). The field is customizable. |
DeviceCustomIPv6Address1Label |
CEF |
Field for describing the purpose of the DeviceCustomIPv6Address1 field. |
DeviceCustomIPv6Address2 |
CEF |
Field for mapping IPv6 address value that cannot be mapped to any other data model element. It can be used to process the logs of network assets where you need to distinguish between the IP addresses of various assets (for firewalls, etc.). The field is customizable. |
DeviceCustomIPv6Address2Label |
CEF |
Field for describing the purpose of the DeviceCustomIPv6Address2 field. |
DeviceCustomIPv6Address3 |
CEF |
Field for mapping IPv6 address value that cannot be mapped to any other data model element. It can be used to process the logs of network assets where you need to distinguish between the IP addresses of various assets (for firewalls, etc.). The field is customizable. |
DeviceCustomIPv6Address3Label |
CEF |
Field for describing the purpose of the DeviceCustomIPv6Address3 field. |
DeviceCustomIPv6Address4 |
CEF |
Field for mapping IPv6 address value that cannot be mapped to any other data model element. It can be used to process the logs of network assets where you need to distinguish between the IP addresses of various assets (for firewalls, etc.). The field is customizable. |
DeviceCustomIPv6Address4Label |
CEF |
Field for describing the purpose of the DeviceCustomIPv6Address4 field. |
DeviceEventCategory |
CEF |
The raw event category from the diagram of categorization of log producer events. |
DeviceCustomFloatingPoint1 |
CEF |
Field for mapping the Float type value that cannot be mapped to any other data model element. The field is customizable. |
DeviceCustomFloatingPoint1Label |
CEF |
Field for describing the purpose of the DeviceCustomFloatingPoint1 field. |
DeviceCustomFloatingPoint2 |
CEF |
Field for mapping the Float type value that cannot be mapped to any other data model element. The field is customizable. |
DeviceCustomFloatingPoint2Label |
CEF |
Field for describing the purpose of the DeviceCustomFloatingPoint2 field. |
DeviceCustomFloatingPoint3 |
CEF |
Field for mapping the Float type value that cannot be mapped to any other data model element. The field is customizable. |
DeviceCustomFloatingPoint3Label |
CEF |
Field for describing the purpose of the DeviceCustomFloatingPoint3 field. |
DeviceCustomFloatingPoint4 |
CEF |
Field for mapping the Float type value that cannot be mapped to any other data model element. The field is customizable. |
DeviceCustomFloatingPoint4Label |
CEF |
Field for describing the purpose of the DeviceCustomFloatingPoint4 field. |
DeviceCustomNumber1 |
CEF |
Field for mapping the integer value that cannot be mapped to any other data model element. The field is customizable. |
DeviceCustomNumber1Label |
CEF |
Field for describing the purpose of the DeviceCustomNumber1 field. |
DeviceCustomNumber2 |
CEF |
Field for mapping the integer value that cannot be mapped to any other data model element. The field is customizable. |
DeviceCustomNumber2Label |
CEF |
Field for describing the purpose of the DeviceCustomNumber2 field. |
DeviceCustomNumber3 |
CEF |
Field for mapping the integer value that cannot be mapped to any other data model element. The field is customizable. |
DeviceCustomNumber3Label |
CEF |
Field for describing the purpose of the DeviceCustomNumber3 field. |
BaseEventCount |
CEF |
For a correlation event, this is the number of base events that were processed by the correlation rule that generated the correlation event. |
DeviceCustomString1 |
CEF |
Field for mapping the string value that cannot be mapped to any other data model element. The field is customizable. |
DeviceCustomString1Label |
CEF |
Field for describing the purpose of the DeviceCustomString1 field. |
DeviceCustomString2 |
CEF |
Field for mapping the string value that cannot be mapped to any other data model element. The field is customizable. |
DeviceCustomString2Label |
CEF |
Field for describing the purpose of the DeviceCustomString2 field. |
DeviceCustomString3 |
CEF |
Field for mapping the string value that cannot be mapped to any other data model element. The field is customizable. |
DeviceCustomString3Label |
CEF |
Field for describing the purpose of the DeviceCustomString3 field. |
DeviceCustomString4 |
CEF |
Field for mapping the string value that cannot be mapped to any other data model element. The field is customizable. |
DeviceCustomString4Label |
CEF |
Field for describing the purpose of the DeviceCustomString4 field. |
DeviceCustomString5 |
CEF |
Field for mapping the string value that cannot be mapped to any other data model element. The field is customizable. |
DeviceCustomString5Label |
CEF |
Field for describing the purpose of the DeviceCustomString5 field. |
DeviceCustomString6 |
CEF |
Field for mapping the string value that cannot be mapped to any other data model element. The field is customizable. |
DeviceCustomString6Label |
CEF |
Field for describing the purpose of the DeviceCustomString6 field. |
DestinationDnsDomain |
CEF |
The DNS domain portion of the complete fully qualified domain name (FQDN) of the destination, if the raw event contains the values of the traffic sender and recipient. This is used to process network traffic logs in which you need to be able to distinguish between the source and destination. |
DestinationServiceName |
CEF |
Service name on the traffic recipient's side. For example, "sshd". This is used to process network traffic logs in which you need to be able to distinguish between the source and destination. |
DestinationTranslatedAddress |
CEF |
IP address of the traffic recipient asset (after the address is translated). This is used to process network traffic logs in which you need to be able to distinguish between the source and destination. |
DestinationTranslatedPort |
CEF |
Port number on the traffic recipient asset (after the recipient address is translated). This is used to process network traffic logs in which you need to be able to distinguish between the source and destination. |
DeviceCustomDate1 |
CEF |
Field for mapping the Timestamp type value that cannot be mapped to any other data model element. The field is customizable. The time is specified in UTC0. |
DeviceCustomDate1Label |
CEF |
Field for describing the purpose of the DeviceCustomDate1 field. |
DeviceCustomDate2 |
CEF |
Field for mapping the Timestamp type value that cannot be mapped to any other data model element. The field is customizable. The time is specified in UTC0. |
DeviceCustomDate2Label |
CEF |
Field for describing the purpose of the DeviceCustomDate2 field. |
DeviceDirection |
CEF |
This field stores a description of the connection direction from the raw event. |
DeviceDnsDomain |
CEF |
The DNS domain part of the complete fully qualified domain name (FQDN) of the asset IP address from which the raw event was received. |
DeviceExternalID |
CEF |
External unique asset (product) ID, if it is communicated in the raw event. |
DeviceFacility |
CEF |
Facility from the raw event, if one exists. For example, the Facility field in the Syslog can be used to transmit the OS component name where an error occurred. |
DeviceInboundInterface |
CEF |
Name of the incoming connection interface. |
DeviceNtDomain |
CEF |
Windows Domain Name of the asset |
DeviceOutboundInterface |
CEF |
Name of the outgoing connection interface. |
DevicePayloadID |
CEF |
The payload's unique ID associated with the raw event. |
DeviceProcessName |
CEF |
Name of the process from the raw event |
DeviceTranslatedAddress |
CEF |
Retranslated IP address of the asset from which the raw event was received. |
DestinationHostName |
CEF |
Host name of the traffic receiver. FQDN of the traffic recipient, if available. This is used to process network traffic logs in which you need to be able to distinguish between the source and destination. |
DestinationMacAddress |
CEF |
MAC address of the traffic recipient asset. This is used to process network traffic logs in which you need to be able to distinguish between the source and destination. |
DestinationNtDomain |
CEF |
Windows Domain Name of the traffic recipient asset. |
DestinationProcessID |
CEF |
ID of the system process that is associated with the traffic recipient in the raw event. For example, if Process ID 105 is specified in the event, then DestinationProcessId=105 This is used to process network traffic logs in which you need to be able to distinguish between the source and destination. |
DestinationUserPrivileges |
CEF |
Names of security roles that identify user privileges at the destination. For example, "User", "Guest", "Administrator", etc. This is used to process network traffic logs in which you need to be able to distinguish between the source and destination. |
DestinationProcessName |
CEF |
Name of the system process at the destination. For example, "sshd", "telnet", etc. This is used to process network traffic logs in which you need to be able to distinguish between the source and destination. |
DestinationPort |
CEF |
Port number at the destination. This is used to process network traffic logs in which you need to be able to distinguish between the source and destination. |
DestinationAddress |
CEF |
Destination IPv4 address. This is used to process network traffic logs in which you need to be able to distinguish between the source and destination. |
DeviceTimeZone |
CEF |
Time zone of the asset where the event was generated |
DestinationUserID |
CEF |
User ID at the destination. This is used to process network traffic logs in which you need to be able to distinguish between the source and destination. |
DestinationUserName |
CEF |
User name at the destination. It may contain the email address of the user. This is used to process network traffic logs in which you need to be able to distinguish between the source and destination. |
DeviceAddress |
CEF |
IPv4 address of the asset from which the event was received. |
DeviceHostName |
CEF |
Name of the asset host from which the event was received. FQDN of the asset, if available. |
DeviceMacAddress |
CEF |
MAC address of the asset from which the event was received. FQDN of the asset, if available. |
DeviceProcessID |
CEF |
ID of the system process on the device that generated the event. |
EndTime |
CEF |
Timestamp when the event was terminated. The time is specified in UTC0. |
ExternalID |
CEF |
ID of the device that generated the event. |
FileCreateTime |
CEF |
Time of file creation from the event. The time is specified in UTC0. |
FileHash |
CEF |
Hash of the file. |
FileID |
CEF |
File ID if one exists. |
FileModificationTime |
CEF |
Time when the file was last modified. The time is specified in UTC0. |
FilePath |
CEF |
File path, including the file name. |
FilePermission |
CEF |
List of file permissions. |
FileType |
CEF |
File type. For example, application, pipe, socket, etc. |
FlexDate1 |
CEF |
Field for mapping the Timestamp type value that cannot be mapped to any other data model element. The field is customizable. The time is specified in UTC0. |
FlexDate1Label |
CEF |
Field for describing the purpose of the flexDate1Label field. |
FlexString1 |
CEF |
Field for mapping the String type value that cannot be mapped to any other data model element. The field is customizable. |
FlexString1Label |
CEF |
Field for describing the purpose of the flexString1Label field. |
FlexString2 |
CEF |
Field for mapping the String type value that cannot be mapped to any other data model element. The field is customizable. |
FlexString2Label |
CEF |
Field for describing the purpose of the flexString2Label field. |
FlexNumber1 |
CEF |
Field for mapping the integer type that cannot be mapped to any other data model element. The field is customizable. |
FlexNumber1Label |
CEF |
Field for describing the purpose of the flexNumber1Label field. |
FlexNumber2 |
CEF |
Field for mapping the integer type that cannot be mapped to any other data model element. The field is customizable. |
FlexNumber2Label |
CEF |
Field for describing the purpose of the flexNumber2Label field. |
FileName |
CEF |
Filename without specifying the file path. |
FileSize |
CEF |
File size |
BytesIn |
CEF |
Number of obtained bytes that were received from the source and transmitted to the destination. This is used to process network traffic logs in which you need to be able to distinguish between the source and destination. |
Message |
CEF |
Short name of the error (problem) from the event. |
OldFileCreateTime |
CEF |
Time of the old file creation from the event. The time is specified in UTC0. |
OldFileHash |
CEF |
Hash of the old file. |
OldFileID |
CEF |
ID of the old file, if one exists. |
OldFileModificationTime |
CEF |
Time when the old file was last modified. The time is specified in UTC0. |
OldFileName |
CEF |
Name of the old file (without the file path). |
OldFilePath |
CEF |
Path to the old file, including the file name. |
OldFilePermission |
CEF |
List of the old file permissions. |
OldFileSize |
CEF |
Size of the old file. |
OldFileType |
CEF |
File type. For example, application, pipe, socket, etc. |
BytesOut |
CEF |
Number of sent bytes. This is used to process network traffic logs in which you need to be able to distinguish between the source and destination. |
EventOutcome |
CEF |
Result of the Action execution. For example, "success", "failure". |
TransportProtocol |
CEF |
OSI layer 4 protocol name (TCP, UDP, etc.). |
Reason |
CEF |
Short description of the audit reason in the audit messages. |
RequestUrl |
CEF |
Requested URL. |
RequestClientApplication |
CEF |
Agent that processed the Request. |
RequestContext |
CEF |
Description of the request context. |
RequestCookies |
CEF |
Cookie files related to the request. |
RequestMethod |
CEF |
Method that was used to access the URL (POST, GET, etc.). |
DeviceReceiptTime |
CEF |
Time when the event was received. The time is specified in UTC0. |
SourceHostName |
CEF |
Name of the host of the traffic source. FQDN of the traffic source, if available. This is used to process network traffic logs in which you need to be able to distinguish between the source and destination. |
SourceDnsDomain |
CEF |
Windows Domain Name of the traffic source asset. |
SourceServiceName |
CEF |
Name of the service at the traffic source. For example, "sshd". This is used to process network traffic logs in which you need to be able to distinguish between the source and destination. |
SourceTranslatedAddress |
CEF |
Source translated IPv4 address. This is used to process network traffic logs in which you need to be able to distinguish between the source and destination. |
SourceTranslatedPort |
CEF |
Number of the translated port at the source. This is used to process network traffic logs in which you need to be able to distinguish between the source and destination. |
SourceMacAddress |
CEF |
MAC address of the traffic source asset. This is used to process network traffic logs in which you need to be able to distinguish between the source and destination. |
SourceNtDomain |
CEF |
Windows Domain Name of the traffic source asset. This is used to process network traffic logs in which you need to be able to distinguish between the source and destination. |
SourceProcessID |
CEF |
System process ID that is associated with the traffic source in the raw event. For example, if Process ID 105 is specified in the event, SourceProcessId=105 This is used to process network traffic logs in which you need to be able to distinguish between the source and destination. |
SourceUserPrivileges |
CEF |
Names of security roles that identify user privileges at the source. For example, "User", "Guest", "Administrator", etc. This is used to process network traffic logs in which you need to be able to distinguish between the source and destination. |
SourceProcessName |
CEF |
Name of the system process at the source. For example, "sshd", "telnet", etc. This is used to process network traffic logs in which you need to be able to distinguish between the source and destination. |
SourcePort |
CEF |
Port number at the source. This is used to process network traffic logs in which you need to be able to distinguish between the source and destination. |
SourceAddress |
CEF |
Source IPv4 address. This is used to process network traffic logs in which you need to be able to distinguish between the source and destination. |
StartTime |
CEF |
Timestamp of the action associated with the event began. |
SourceUserID |
CEF |
User ID at the source. This is used to process network traffic logs in which you need to be able to distinguish between the source and destination. |
SourceUserName |
CEF |
User name at the source. It may contain the email address of the user. This is used to process network traffic logs in which you need to be able to distinguish between the source and destination. |
Type |
CEF |
The following values are available:
|
CorrelationBucketHash |
CEF |
Correlation Bucket key. Correlation event fields are used when generating a key. Used when generating notifications for the user. |
GroupedBy |
CEF |
List of names of the fields that were used for grouping in the correlation rule. It is filled in only for the correlation event. |
TenantID |
CEF |
Tenant ID |
Correlation event fields
Correlation events are created by the KUMA Correlators when specified the conditions, set in the Configuration rules are met. The correlation event conforms to the normalized event data model.
Correlation event fields
Field |
Description |
|
Unique identifier |
|
Indicator of the correlation event type. The correlation event corresponds to the value of 3. |
|
Correlation event name. By default, the name of the parent correlation rule (the Correlation rule resource that created the correlation event) is used. This can be changed in the Correlation rule settings in the Enrichment group of settings parameters. |
|
Time and date of correlation event creation. |
|
Identifier of the correlation rule that triggered the event. |
|
Name of the correlation rule that triggered the event. |
|
Priority of the correlation event |
|
Identifier of the correlator service that created the event. |
|
|
|
|
|
The number of base events that are related to the correlation event. |
|
List of IDs of base events that were used as the basis for the correlation event. For drilldown analysis. |
|
List of unique addresses, hosts, users, and IDs of assets that were affected by the potential incident |
<Fields that are selected in the Identical fields field in the Correlation rule resource parameters> |
Copied from the events, processed by the Correlation rule. |
Audit event fields
Audit events are created when certain security-related actions happen in KUMA; these events are used to ensure system integrity. This section contain information about audit event fields.
Event fields with general information
Every audit event has the event fields described below.
Event field name |
Field value |
ID |
Unique event ID in the form of a UUID. |
Timestamp |
Event time. |
DeviceHostName |
The event source host. For audit events, it is the hostname where kuma-core is installed, because it is the source of events. |
Type |
Type of the audit event. For audit event the value is |
User was successfully signed in or failed to sign in
Event field name |
Field value |
DeviceAction |
|
EventOutcome |
|
SourceTranslatedAddress |
This field contains the value of the HTTP header x-real-ip or x-forwarded-for. If these headers are absent, the field will be empty. |
SourceAddress |
The address from which the user logged in. If the user logged in using a proxy, there will be a proxy address. |
SourcePort |
Port from which the user logged in. If the user logged in using a proxy, there will be a port on the proxy side. |
SourceUserName |
User login. |
SourceUserID |
User ID. |
Message |
Description of the error; appears only if an error occurred during login. Otherwise, the field will be empty. |
User login successfully changed
Event field name |
Field value |
DeviceAction |
|
EventOutcome |
|
SourceTranslatedAddress |
This field contains the value of the HTTP header x-real-ip or x-forwarded-for. If these headers are absent, the field will be empty. |
SourceAddress |
The address from which the user logged in. If the user logged in using a proxy, there will be a proxy address. |
SourcePort |
Port from which the user logged in. If the user logged in using a proxy, there will be a port on the proxy side. |
SourceUserName |
User login that was used to change data. |
SourceUserID |
User ID that was used to change data. |
DestinationUserName |
User login whose data was changed. |
DestinationUserID |
User ID whose data was changed. |
DeviceCustomString1 |
Current value of the login. |
DeviceCustomString1Label |
|
DeviceCustomString2 |
Value of the login before it was changed. |
DeviceCustomString2Label |
|
User role was successfully changed
Event field name |
Field value |
DeviceAction |
|
EventOutcome |
|
SourceTranslatedAddress |
This field contains the value of the HTTP header x-real-ip or x-forwarded-for. If these headers are absent, the field will be empty. |
SourceAddress |
The address from which the user logged in. If the user logged in using a proxy, there will be a proxy address. |
SourcePort |
Port from which the user logged in. If the user logged in using a proxy, there will be a port on the proxy side. |
SourceUserName |
User login that was used to change data. |
SourceUserID |
User ID that was used to change data. |
DestinationUserName |
User login whose data was changed. |
DestinationUserID |
User ID whose data was changed. |
DeviceCustomString1 |
Current value of the role. |
DeviceCustomString1Label |
|
DeviceCustomString2 |
Value of the role before it was changed. |
DeviceCustomString2Label |
|
Other data of the user was successfully changed
Event field name |
Field value |
DeviceAction |
|
EventOutcome |
|
SourceTranslatedAddress |
This field contains the value of the HTTP header x-real-ip or x-forwarded-for. If these headers are absent, the field will be empty. |
SourceAddress |
The address from which the user logged in. If the user logged in using a proxy, there will be a proxy address. |
SourcePort |
Port from which the user logged in. If the user logged in using a proxy, there will be a port on the proxy side. |
SourceUserName |
User login that was used to change data. |
SourceUserID |
User ID that was used to change data. |
DestinationUserName |
User login whose data was changed. |
DestinationUserID |
User ID whose data was changed. |
User successfully logged out
This event appears only when the user pressed the logout button.
This event will not appear if the user is logged out due to the end of the session or if the user logs in again from another browser.
Event field name |
Field value |
DeviceAction |
|
EventOutcome |
|
SourceTranslatedAddress |
This field contains the value of the HTTP header x-real-ip or x-forwarded-for. If these headers are absent, the field will be empty. |
SourceAddress |
The address from which the user logged in. If the user logged in using a proxy, there will be a proxy address. |
SourcePort |
Port from which the user logged in. If the user logged in using a proxy, there will be a port on the proxy side. |
SourceUserName |
User login. |
SourceUserID |
User ID. |
User password was successfully changed
Event field name |
Field value |
DeviceAction |
|
EventOutcome |
|
SourceTranslatedAddress |
This field contains the value of the HTTP header x-real-ip or x-forwarded-for. If these headers are absent, the field will be empty. |
SourceAddress |
The address from which the user logged in. If the user logged in using a proxy, there will be a proxy address. |
SourcePort |
Port from which the user logged in. If the user logged in using a proxy, there will be a port on the proxy side. |
SourceUserName |
User login that was used to change data. |
SourceUserID |
User ID that was used to change data. |
DestinationUserName |
User login whose data was changed. |
DestinationUserID |
User ID whose data was changed. |
User was successfully created
Event field name |
Field value |
DeviceAction |
|
EventOutcome |
|
SourceTranslatedAddress |
This field contains the value of the HTTP header x-real-ip or x-forwarded-for. If these headers are absent, the field will be empty. |
SourceAddress |
The address from which the user logged in. If the user logged in using a proxy, there will be a proxy address. |
SourcePort |
Port from which the user logged in. If the user logged in using a proxy, there will be a port on the proxy side. |
SourceUserName |
User login that was used to create the user account. |
SourceUserID |
User ID that was used to create the user account. |
DestinationUserName |
User login for which the user account was created. |
DestinationUserID |
User ID for which the user account was created. |
DeviceCustomString1 |
Role of the created user. |
DeviceCustomString1Label |
|
User access token was successfully changed
Event field name |
Field value |
DeviceAction |
|
EventOutcome |
|
SourceTranslatedAddress |
This field contains the value of the HTTP header x-real-ip or x-forwarded-for. If these headers are absent, the field will be empty. |
SourceAddress |
The address from which the user logged in. If the user logged in using a proxy, there will be a proxy address. |
SourcePort |
Port from which the user logged in. If the user logged in using a proxy, there will be a port on the proxy side. |
SourceUserName |
User login that was used to change data. |
SourceUserID |
User ID that was used to change data. |
DestinationUserName |
User login whose data was changed. |
DestinationUserID |
User ID whose data was changed. |
Service was successfully created
Event field name |
Field value |
DeviceAction |
|
EventOutcome |
|
SourceTranslatedAddress |
This field contains the value of the HTTP header x-real-ip or x-forwarded-for. If these headers are absent, the field will be empty. |
SourceAddress |
The address from which the user logged in. If the user logged in using a proxy, there will be a proxy address. |
SourcePort |
Port from which the user logged in. If the user logged in using a proxy, there will be a port on the proxy side. |
SourceUserName |
User login that was used to create the service. |
SourceUserID |
User ID that was used to create the service. |
DeviceExternalID |
Service ID. |
DeviceProcessName |
Service name. |
DeviceFacility |
Service type. |
Service was successfully deleted
Event field name |
Field value |
DeviceAction |
|
EventOutcome |
|
SourceTranslatedAddress |
This field contains the value of the HTTP header x-real-ip or x-forwarded-for. If these headers are absent, the field will be empty. |
SourceAddress |
The address from which the user logged in. If the user logged in using a proxy, there will be a proxy address. |
SourcePort |
Port from which the user logged in. If the user logged in using a proxy, there will be a port on the proxy side. |
SourceUserName |
User login that was used to delete the service. |
SourceUserID |
User ID that was used to delete the service. |
DeviceExternalID |
Service ID. |
DeviceProcessName |
Service name. |
DeviceFacility |
Service type. |
DestinationAddress |
The address of the machine that was used to start the service. If the service has never been started before, the field will be empty. |
DestinationHostName |
The FQDN of the machine that was used to start the service. If the service has never been started before, the field will be empty. |
Service was successfully reloaded
Event field name |
Field value |
DeviceAction |
|
EventOutcome |
|
SourceTranslatedAddress |
This field contains the value of the HTTP header x-real-ip or x-forwarded-for. If these headers are absent, the field will be empty. |
SourceAddress |
The address from which the user logged in. If the user logged in using a proxy, there will be a proxy address. |
SourcePort |
Port from which the user logged in. If the user logged in using a proxy, there will be a port on the proxy side. |
SourceUserName |
User login that was used to create the service. |
SourceUserID |
User ID that was used to create the service. |
DeviceExternalID |
Service ID. |
DeviceProcessName |
Service name. |
DeviceFacility |
Service type. |
Service was successfully restarted
Event field name |
Field value |
DeviceAction |
|
EventOutcome |
|
SourceTranslatedAddress |
This field contains the value of the HTTP header x-real-ip or x-forwarded-for. If these headers are absent, the field will be empty. |
SourceAddress |
The address from which the user logged in. If the user logged in using a proxy, there will be a proxy address. |
SourcePort |
Port from which the user logged in. If the user logged in using a proxy, there will be a port on the proxy side. |
SourceUserName |
User login that was used to create the service. |
SourceUserID |
User ID that was used to create the service. |
DeviceExternalID |
Service ID. |
DeviceProcessName |
Service name. |
DeviceFacility |
Service type. |
Service was successfully started
Event field name |
Field value |
DeviceAction |
|
EventOutcome |
|
SourceTranslatedAddress |
This field contains the value of the HTTP header x-real-ip or x-forwarded-for. If these headers are absent, the field will be empty. |
SourceAddress |
Address that reported information about service start. It may be a proxy address if the information passed through a proxy. |
SourcePort |
Port that reported information about service start. It may be a proxy port if the information passed through a proxy. |
DeviceExternalID |
Service ID. |
DeviceProcessName |
Service name. |
DeviceFacility |
Service type. |
DestinationAddress |
Address of the machine where the service was started. |
DestinationHostName |
FQDN of the machine where the service was started. |
Service was successfully paired
Event field name |
Field value |
DeviceAction |
|
EventOutcome |
|
SourceTranslatedAddress |
This field contains the value of the HTTP header x-real-ip or x-forwarded-for. If these headers are absent, the field will be empty. |
SourceAddress |
Address that sent a service pairing request. It may be a proxy address if the request passed through a proxy. |
SourcePort |
Port that sent a service pairing request. It may be a proxy port if the request passed through a proxy. |
DeviceExternalID |
Service ID. |
DeviceProcessName |
Service name. |
DeviceFacility |
Service type. |
Service status was changed
Event field name |
Field value |
DeviceAction |
|
DeviceExternalID |
Service ID. |
DeviceProcessName |
Service name. |
DeviceFacility |
Service type. |
DestinationAddress |
Address of the machine where the service was started. |
DestinationHostName |
FQDN of the machine where the service was started. |
DeviceCustomString1 |
|
DeviceCustomString1Label |
|
DeviceCustomString2 |
|
DeviceCustomString2Label |
|
Storage index was deleted by user
Event field name |
Field value |
DeviceAction |
|
EventOutcome |
|
SourceTranslatedAddress |
This field contains the value of the HTTP header x-real-ip or x-forwarded-for. If these headers are absent, the field will be empty. |
SourceAddress |
The address from which the user logged in. If the user logged in using a proxy, there will be a proxy address. |
SourcePort |
Port from which the user logged in. If the user logged in using a proxy, there will be a port on the proxy side. |
SourceUserName |
User login that was used to create the service. |
SourceUserID |
User ID that was used to create the service. |
Name |
Index name. |
Message |
|
Storage partition was deleted automatically due to expiration
Event field name |
Field value |
DeviceAction |
|
EventOutcome |
|
Name |
Index name |
SourceServiceName |
|
Message |
|
Active list was successfully cleared or operation failed
This event can arrive with a succeeded or failed status.
Since the request to clear the active list is made over a remote connection, a data transfer error may occur both before deletion and after deletion.
This means that the active list may be cleared successfully, but the event will still have the failed status. So, in fact, EventOutcome returns the TCP/IP connection status of the request, not the succeeded or failed status of the active list clearing.
Event field name |
Field value |
DeviceAction |
|
EventOutcome |
|
SourceTranslatedAddress |
This field contains the value of the HTTP header x-real-ip or x-forwarded-for. If these headers are absent, the field will be empty. |
SourceAddress |
The address from which the user logged in. If the user logged in using a proxy, there will be a proxy address. |
SourcePort |
Port from which the user logged in. If the user logged in using a proxy, there will be a port on the proxy side. |
SourceUserName |
User login that was used to clear the active list. |
SourceUserID |
User ID that was used to clear the active list. |
DeviceExternalID |
Service ID for which the active list is cleared. |
ExternalID |
Active list ID. |
Name |
Active list name. |
Message |
If EventOutcome = |
Active list item was successfully deleted or operation was unsuccessful
This event can arrive with a succeeded or failed status.
Since the request to delete the active list item is made over a remote connection, a data transfer error may occur both before deletion and after deletion.
This means that the active list item may be deleted successfully, but the event will still have the failed status. So, in fact, EventOutcome returns the TCP/IP connection status of the request, not the succeeded or failed status of the active list item deletion.
Event field name |
Field value |
DeviceAction |
|
EventOutcome |
|
SourceTranslatedAddress |
This field contains the value of the HTTP header x-real-ip or x-forwarded-for. If these headers are absent, the field will be empty. |
SourceAddress |
The address from which the user logged in. If the user logged in using a proxy, there will be a proxy address. |
SourcePort |
Port from which the user logged in. If the user logged in using a proxy, there will be a port on the proxy side. |
SourceUserName |
User login that was used to delete the item from the active list. |
SourceUserID |
User ID that was used to delete the item from the active list. |
DeviceExternalID |
Service ID for which the active list is cleared. |
ExternalID |
Active list ID. |
Name |
Active list name. |
DeviceCustomString1 |
Key name. |
DeviceCustomString1Label |
|
Message |
If EventOutcome = |
Active list was successfully imported or operation failed
Imported partially over a remote connection.
An error may occur during the operation, which means that EventOutcome = failed may also mean a connection error, where data may be either partially or completely imported.
But in most cases, the error means that the data was not imported or was partially imported.
Event field name |
Field value |
DeviceAction |
|
EventOutcome |
|
SourceTranslatedAddress |
This field contains the value of the HTTP header x-real-ip or x-forwarded-for. If these headers are absent, the field will be empty. |
SourceAddress |
The address from which the user logged in. If the user logged in using a proxy, there will be a proxy address. |
SourcePort |
Port from which the user logged in. If the user logged in using a proxy, there will be a port on the proxy side. |
SourceUserName |
User login that was used to perform the import. |
SourceUserID |
User ID that was used to perform the import. |
DeviceExternalID |
Service ID for which an import was performed. |
ExternalID |
Active list ID. |
Name |
Active list name. |
Message |
If EventOutcome = |
Active list was exported successfully
Event field name |
Field value |
DeviceAction |
|
EventOutcome |
|
SourceTranslatedAddress |
This field contains the value of the HTTP header x-real-ip or x-forwarded-for. If these headers are absent, the field will be empty. |
SourceAddress |
The address from which the user logged in. If the user logged in using a proxy, there will be a proxy address. |
SourcePort |
Port from which the user logged in. If the user logged in using a proxy, there will be a port on the proxy side. |
SourceUserName |
User login that was used to perform the export. |
SourceUserID |
User ID that was used to perform the export. |
DeviceExternalID |
Service ID for which an export was performed. |
ExternalID |
Active list ID. |
Name |
Active list name. |
Resource was successfully added
Event field name |
Field value |
DeviceAction |
|
EventOutcome |
|
SourceTranslatedAddress |
This field contains the value of the HTTP header x-real-ip or x-forwarded-for. If these headers are absent, the field will be empty. |
SourceAddress |
The address from which the user logged in. If the user logged in using a proxy, there will be a proxy address. |
SourcePort |
Port from which the user logged in. If the user logged in using a proxy, there will be a port on the proxy side. |
SourceUserName |
User login that was used to add the resource. |
SourceUserID |
User ID that was used to add the resource. |
DeviceExternalID |
Resource ID. |
DeviceProcessName |
Resource name. |
DeviceFacility |
Resource type:
|
Resource was successfully deleted
Event field name |
Field value |
DeviceAction |
|
EventOutcome |
|
SourceTranslatedAddress |
This field contains the value of the HTTP header x-real-ip or x-forwarded-for. If these headers are absent, the field will be empty. |
SourceAddress |
The address from which the user logged in. If the user logged in using a proxy, there will be a proxy address. |
SourcePort |
Port from which the user logged in. If the user logged in using a proxy, there will be a port on the proxy side. |
SourceUserName |
User login that was used to delete the resource. |
SourceUserID |
User ID that was used to delete the resource. |
DeviceExternalID |
Resource ID. |
DeviceProcessName |
Resource name. |
DeviceFacility |
Resource type:
|
Resource was successfully updated
Event field name |
Field value |
DeviceAction |
|
EventOutcome |
|
SourceTranslatedAddress |
This field contains the value of the HTTP header x-real-ip or x-forwarded-for. If these headers are absent, the field will be empty. |
SourceAddress |
The address from which the user logged in. If the user logged in using a proxy, there will be a proxy address. |
SourcePort |
Port from which the user logged in. If the user logged in using a proxy, there will be a port on the proxy side. |
SourceUserName |
User login that was used to update the resource. |
SourceUserID |
User ID that was used to update the resource. |
DeviceExternalID |
Resource ID. |
DeviceProcessName |
Resource name. |
DeviceFacility |
Resource type:
|
Asset was successfully created
Event field name |
Field value |
DeviceAction |
|
EventOutcome |
|
SourceTranslatedAddress |
This field contains the value of the HTTP header x-real-ip or x-forwarded-for. If these headers are absent, the field will be empty. |
SourceAddress |
The address from which the user logged in. If the user logged in using a proxy, there will be a proxy address. |
SourcePort |
Port from which the user logged in. If the user logged in using a proxy, there will be a port on the proxy side. |
SourceUserName |
User login that was used to add the asset. |
SourceUserID |
User ID that was used to add the asset. |
DeviceExternalID |
Asset ID. |
SourceHostName |
Asset ID. |
Name |
Asset name. |
DeviceCustomString1 |
Comma-separated IP addresses of the asset. |
DeviceCustomString1Label |
|
Asset was successfully deleted
Event field name |
Field value |
DeviceAction |
|
EventOutcome |
|
SourceTranslatedAddress |
This field contains the value of the HTTP header x-real-ip or x-forwarded-for. If these headers are absent, the field will be empty. |
SourceAddress |
The address from which the user logged in. If the user logged in using a proxy, there will be a proxy address. |
SourcePort |
Port from which the user logged in. If the user logged in using a proxy, there will be a port on the proxy side. |
SourceUserName |
User login that was used to add the asset. |
SourceUserID |
User ID that was used to add the asset. |
DeviceExternalID |
Asset ID. |
SourceHostName |
Asset ID. |
Name |
Asset name. |
DeviceCustomString1 |
Comma-separated IP addresses of the asset. |
DeviceCustomString1Label |
|
Asset category was successfully added
Event field name |
Field value |
DeviceAction |
|
EventOutcome |
|
SourceTranslatedAddress |
This field contains the value of the HTTP header x-real-ip or x-forwarded-for. If these headers are absent, the field will be empty. |
SourceAddress |
The address from which the user logged in. If the user logged in using a proxy, there will be a proxy address. |
SourcePort |
Port from which the user logged in. If the user logged in using a proxy, there will be a port on the proxy side. |
SourceUserName |
User login that was used to add the category. |
SourceUserID |
User ID that was used to add the category. |
DeviceExternalID |
Category ID. |
Name |
Category name. |
Asset category was deleted successfully
Event field name |
Field value |
DeviceAction |
|
EventOutcome |
|
SourceTranslatedAddress |
This field contains the value of the HTTP header x-real-ip or x-forwarded-for. If these headers are absent, the field will be empty. |
SourceAddress |
The address from which the user logged in. If the user logged in using a proxy, there will be a proxy address. |
SourcePort |
Port from which the user logged in. If the user logged in using a proxy, there will be a port on the proxy side. |
SourceUserName |
User login that was used to delete the category. |
SourceUserID |
User ID that was used to delete the category. |
DeviceExternalID |
Category ID. |
Name |
Category name. |
Settings were updated successfully
Event field name |
Field value |
DeviceAction |
|
EventOutcome |
|
SourceTranslatedAddress |
This field contains the value of the HTTP header x-real-ip or x-forwarded-for. If these headers are absent, the field will be empty. |
SourceAddress |
The address from which the user logged in. If the user logged in using a proxy, there will be a proxy address. |
SourcePort |
Port from which the user logged in. If the user logged in using a proxy, there will be a port on the proxy side. |
SourceUserName |
User login that was used to update the settings. |
SourceUserID |
User ID that was used to update the settings. |
DeviceFacility |
Type of settings. |
Information about third-party code
Information about third-party code is in the LEGAL_NOTICES file located in the /opt/kaspersky/kuma/LEGAL_NOTICES folder.
Page top
Trademark notices
Registered trademarks and service marks are the property of their respective owners.
AMD is a trademark or registered trademark of Advanced Micro Devices, Inc.
Apache and the Apache feather logo are trademarks of The Apache Software Foundation.
Cisco is a registered trademark or trademark of Cisco Systems, Inc. and/or its affiliates in the United States and in certain other countries.
The Grafana word mark and the Grafana logo are registered trademarks/service marks or trademarks/service marks of Coding Instinct AB, in the United States and other countries and are used with Coding Instinct's permission. We are not affiliated with, endorsed, or sponsored by Coding Instinct, or the Grafana community.
Firebird is a registered trademark of the Firebird Foundation.
Google and Chrome are trademarks of Google LLC.
Huawei is a trademark of Huawei Technologies Co., Ltd registered in China and other countries.
Intel is a trademark of Intel Corporation registered in the United States and/or other countries.
Linux is a trademark of Linus Torvalds in the U.S. and other countries.
Microsoft, Active Directory, Windows, and Windows Server are trademarks of Microsoft Corporation.
CVE is a registered trademark of The MITRE Corporation.
Mozilla and Firefox are trademarks of the Mozilla Foundation.
Oracle is a registered trademark of Oracle and/or its affiliates.
Python is a trademark or registered trademark of the Python Software Foundation.
Ansible is a trademark or registered trademark of Red Hat, Inc. or its subsidiaries in the United States and other countries.
ClickHouse is a trademark of YANDEX LLC.
Page topGlossary
Aggregation
Combining several messages of the same type from the event source into a single event.
Cluster
A group of servers on which the KUMA program has been installed and that have been clustered together for centralized management using the program's web interface.
Collector
A KUMA service that receives events from event sources, converts them, and transmits them to other program components for further processing.
Connector
A KUMA service that ensures transport for receiving data from external systems.
Enrichment
The conversion of the textual representation of an event using dictionaries, constants, calls to the DNS service, and other tools.
Event
An instance of security-related activity of network devices and services that can be seen and recorded. For example, events include violations of the information security policy, the disabling of security measures, the occurrence of an unprecedented situation, etc.
Filter
The set of conditions the program uses to select events for further processing.
KUMA web interface
A KUMA service that provides a user interface to configure and track KUMA operations.
Network port
A TCP and UDP protocol setting that defines the destination of IP-format data packets that are transmitted to a host over a network and allows various programs running on the same host to receive the data independently of each other. Each program processes the data sent to a specific port (sometimes it is said that the program listens to this port number).
It's standard practice to assign standard port numbers to certain common network protocols (for example, web servers usually receive data over HTTP on TCP port 80), although in general a program can use any protocol on any port. Possible values: from 1 to 65535.
Normalization
A process that formats data received from an event in accordance with the fields of the KUMA event data model. During normalization, certain rules for changing the data may be executed (for example, changing upper case characters to lower case, replacing characters, etc.).
Role
A set of access privileges established to grant the KUMA web interface user the authority to perform tasks.
SELinux (Security-Enhanced Linux)
A system for controlling process access to operating system resources based on the use of security policies.
SIEM
Security Information and Event Management system. A solution for managing information and events in a company's security system.
STARTTLS
Text exchange protocol enhancement that lets you create an encrypted connection (TLS or SSL) directly over an ordinary TCP connection instead of opening a separate port for the encrypted connection.
UserPrincipalName
UserPrincipalName (UPN)—user name in email address format, such as username@domain.com.
The UPN must match the actual email address of the user. In this example, username is the user name in the Active Directory domain (user logon name), and domain.com is the UPN suffix. They are separated by the @ character. The DNS name of the Active Directory domain is used as the default UPN suffix in Active Directory.