Kaspersky SD-WAN supports two deployment scenarios for solution components:
In the N+1 deployment scenario, you deploy two nodes of the solution component. If one node fails, the second node provides the functionality of the solution component.
In the 2N+1 deployment scenario, you deploy multiple nodes of the solution component. One node is the primary node and the rest are secondary nodes. If the primary node fails, a randomly chosen secondary node takes its place. This redundancy scheme allows solution components to remain operational even when multiple failures occur in a row.
The table below lists the solution components and the deployment scenarios that are applicable to them.
Solution component
Redundancy scheme
Database of the Zabbix monitoring system
2N+1
Zabbix server
N+1
Frontend part of the Zabbix monitoring system
N+1
Zabbix proxy server
N+1
MongoDB database
2N+1
Redis database:
Redis replica server
Redis Sentinel system
2N+1
Controller
2N+1
Frontend part of the solution
N+1
Orchestrator
N+1
Virtual Network Function Manager
N+1
Virtual Network Function Manager proxy
N+1
You can specify the number of nodes you want to deploy for each solution component in the configuration file.
When you configure the deployment settings for the MongoDB database or the controller node in accordance with the 2N+1 deployment scenario, the last node you specify becomes the arbiter node. The arbiter node is linked to other nodes and is used to choose the primary node. A node that has lost contact with the arbiter node enters standby mode. One of the nodes that have retained contact with the arbiter node stays or becomes the primary node. An arbiter node cannot become a primary node and does not store data.
Failure scenarios of solution component nodes
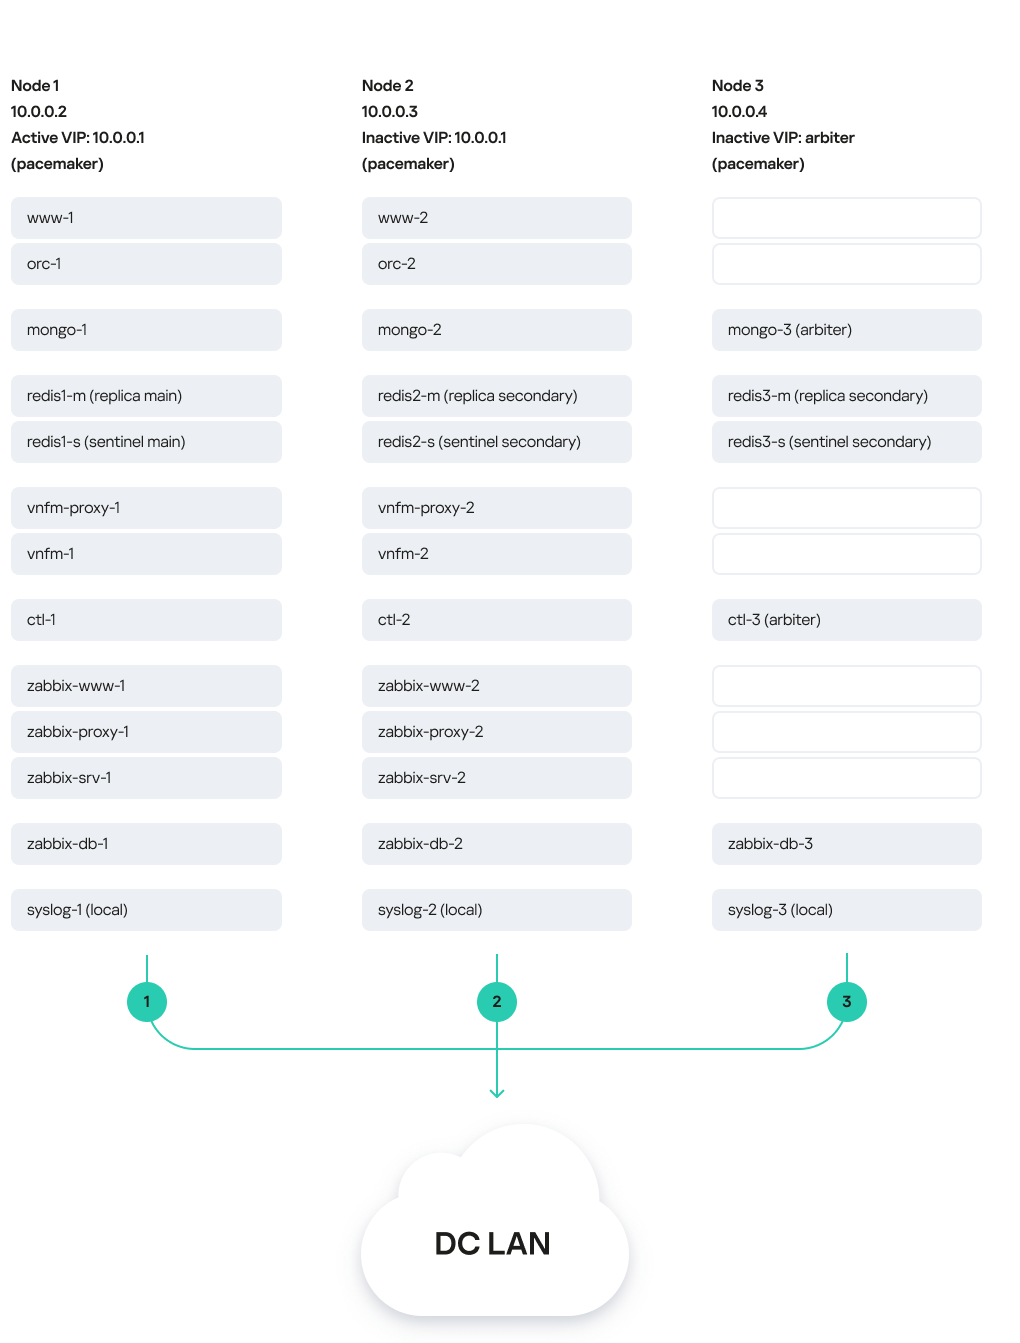
The figure below shows a diagram of Kaspersky SD-WAN deployed on three virtual machines in a data center. The diagram uses the following symbols:
'www' is the frontend part of the solution
'orc' is the orchestrator
'mongo' is the MongoDB database
'redis-m' is a Redis replica server
'redis-s' is a Redis Sentinel system
'vnfm-proxy' is a virtual network functions manager proxy
'vnfm' is a Virtual Network Function Manager
'ctl' is the controller and its database
'zabbix-www' is the frontend part of the Zabbix monitoring system
'zabbix-proxy' is the Zabbix proxy server
'zabbix-srv' is the Zabbix server
'zabbix-db' is the database of the Zabbix monitoring system
'syslog' is the Syslog server
Users and CPE devices gain access to the web interface of the orchestrator and the web interface of the Zabbix monitoring system using a virtual IP address. The virtual IP address is assigned to virtual machine 1.
Solution deployed on three virtual machines
In this deployment scenario, the following failure modes are possible:
If virtual machine 1 or its link fails, the solution remains operational. The following changes occur in the state of the nodes of solution components:
The virtual IP address is assigned to virtual machine 2.
The www-1 node of the frontend part of solution is unavailable; www-2 is available. The orchestrator web interface is displayed in the browser.
The orc-1 orchestrator node is unavailable; orc-2 is available. The backend part of the solution is functional, users can log into the orchestrator web interface and manage it.
The mongo-1 node of the MongoDB database is unavailable; mongo-2 and mongo-3 are available; mongo-2 becomes the primary node because mongo-3 is the arbiter node and cannot become the primary node. The orchestrator continues using the MongoDB database.
State of the Redis database:
The redis1-m node of the Redis replica server is unavailable; redis2-m and redis3-m are available.
The redis1-s node of the Redis Sentinel system is unavailable; redis2-s and redis3-s are available; redis2-s becomes the primary node and randomly assigns either the redis2-m or the redis3-m node of the Redis replica server as the primary node.
The orchestrator continues using the Redis database.
States of the Virtual Network Function Manager:
The vnfm-proxy-1 node of the virtual network function manager proxy is unavailable; vnfm-proxy-2 is available.
The vnfm-1 Virtual Network Function Manager node is unavailable; vnfm-2 is available.
SSH consoles of the solution components are operational.
The ctl-1 node of the controller is unavailable; ctl-2 and ctl-3 are available; ctl-2 becomes the primary node because ctl-3 is the arbiter node and cannot become the primary node. Physical connectivity between CPE devices is maintained.
State of the Zabbix monitoring system:
The zabbix-www-1 node of the frontend part of solution is unavailable; zabbix-www-2 is available.
The zabbix-proxy-1 node of the Zabbix proxy server is unavailable; zabbix-proxy-2 is available.
The zabbix-srv-1 node of the Zabbix server is unavailable; zabbix-srv-2 is available.
The zabbix-db-1 node of the Zabbix monitoring system database is unavailable; zabbix-db-2 is available.
If virtual machine 2 or 3 or its link fails, nodes of solution components that are deployed on virtual machine 1 stay primary, and the solution remains operational.
If virtual machines 1 and 3 or virtual machines 2 and 3, or their links fail simultaneously, the solution stops working. The following changes occur in the state of the nodes of solution components:
The orchestrator web interface is not displayed in the browser. Users cannot log into the orchestrator web interface and manage it.
The Zabbix monitoring system stops working.
Network connectivity between CPE devices and the network devices connected to them is maintained; traffic continues to be transmitted.
Network connectivity within P2M services and M2M services is maintained for established sessions. For new sessions, network connectivity is maintained if, when creating the P2P service or M2M service, in the MAC learn mode drop-down list, you selected Learn and flood.
CPE devices use a reordering compensation mechanism to reduce the number of duplicate packets on network devices connected to these CPE devices.
The load on the CPE devices and the SD-WAN network increases proportionately to the number of CPE devices and links.
If links are restored, the solution is also restored and resumes normal operation.
If virtual machines 1 and 3 or virtual machines 2 and 3 fail simultaneously, the configuration of solution components is lost. To restore the configuration of solution components, you can contact Kaspersky Professional Services.
If virtual machines 1 and 2 fail simultaneously, the configuration of the solution components is irreversibly lost because virtual machine 3 has arbiter that do not store data. To avoid this situation, we recommend deploying databases and controllers on separate virtual machines or physical servers and making regular backups.