Kaspersky Unified Monitoring and Analysis Platform
- Kaspersky Unified Monitoring and Analysis Platform Help
- About Kaspersky Unified Monitoring and Analysis Platform
- Program architecture
- Program licensing
- About the End User License Agreement
- About the license
- About the License Certificate
- About the license key
- About the key file
- About the license code
- Data provision in Kaspersky Unified Monitoring and Analysis Platform
- Adding a license key to the program web interface
- Viewing information about an added license key in the program web interface
- Removing a license key in the program web interface
- Administrator's guide
- Installing and removing KUMA
- Program installation requirements
- Ports used by KUMA during installation
- Reissuing internal CA certificates
- Modifying the self-signed web console certificate
- Synchronizing time on servers
- About the inventory file
- Installation on a single server
- Distributed installation
- Distributed installation in a high availability configuration
- KUMA backup
- Modifying the configuration of KUMA
- Updating previous versions of KUMA
- Troubleshooting update errors
- Delete KUMA
- Working with tenants
- Managing users
- KUMA services
- Services tools
- Service resource sets
- Creating a storage
- Creating a correlator
- Creating an event router
- Creating a collector
- Predefined collectors
- Creating an agent
- Configuring event sources
- Configuring receipt of Auditd events
- Configuring receipt of KATA/EDR events
- Configuring the export of Kaspersky Security Center events to the KUMA SIEM system
- Configuring receiving Kaspersky Security Center event from MS SQL
- Creating an account in the MS SQL database
- Configuring the SQL Server Browser service
- Creating a secret in KUMA
- Configuring a connector
- Configuring the KUMA Collector for receiving Kaspersky Security Center events from an MS SQL database
- Installing the KUMA Collector for receiving Kaspersky Security Center events from the MS SQL database
- Configuring receipt of events from Windows devices using KUMA Agent (WEC)
- Configuring audit of events from Windows devices
- Configuring centralized receipt of events from Windows devices using the Windows Event Collector service
- Granting permissions to view Windows events
- Granting permissions to log on as a service
- Configuring the KUMA Collector for receiving events from Windows devices
- Installing the KUMA Collector for receiving events from Windows devices
- Configuring forwarding of events from Windows devices to KUMA using KUMA Agent (WEC)
- Configuring receipt of events from Windows devices using KUMA Agent (WMI)
- Configuring receipt of DNS server events using the ETW agent
- Configuring receipt of PostgreSQL events
- Configuring receipt of IVK Kolchuga-K events
- Configuring receipt of CryptoPro NGate events
- Configuring receipt of Ideco UTM events
- Configuring receipt of KWTS events
- Configuring receipt of KLMS events
- Configuring receipt of KSMG events
- Configuring the receipt of KICS for Networks events
- Configuring receipt of PT NAD events
- Configuring receipt of events using the MariaDB Audit Plugin
- Configuring receipt of Apache Cassandra events
- Configuring receipt of FreeIPA events
- Configuring receipt of VipNet TIAS events
- Configuring receipt of Nextcloud events
- Configuring receipt of Snort events
- Configuring receipt of Suricata events
- Configuring receipt of FreeRADIUS events
- Configuring receipt of VMware vCenter events
- Configuring receipt of zVirt events
- Configuring receipt of Zeek IDS events
- Configuring Windows event reception using Kaspersky Endpoint Security for Windows
- Configuring receipt of Codemaster Mirada events
- Configuring receipt of Postfix events
- Configuring receipt of CommuniGate Pro events
- Configuring receipt of Yandex Cloud events
- Configuring receipt of MongoDB events
- Monitoring event sources
- Managing assets
- Adding an asset category
- Configuring the table of assets
- Searching assets
- Exporting asset data
- Viewing asset details
- Adding assets
- Assigning a category to an asset
- Editing the parameters of assets
- Archiving assets
- Deleting assets
- Updating third-party applications and fixing vulnerabilities on Kaspersky Security Center assets
- Moving assets to a selected administration group
- Asset audit
- Custom asset fields
- Critical information infrastructure assets
- Integration with other solutions
- Integration with Kaspersky Security Center
- Configuring Kaspersky Security Center integration settings
- Adding a tenant to the list for Kaspersky Security Center integration
- Creating Kaspersky Security Center connection
- Editing Kaspersky Security Center connection
- Deleting Kaspersky Security Center connection
- Importing events from the Kaspersky Security Center database
- Kaspersky Endpoint Detection and Response integration
- Integration with Kaspersky CyberTrace
- Integration with Kaspersky Threat Intelligence Portal
- Integration with R-Vision Security Orchestration, Automation and Response
- Integration with Active Directory, Active Directory Federation Services and FreeIPA
- Connecting over LDAP
- Enabling and disabling LDAP integration
- Adding a tenant to the LDAP server integration list
- Creating an LDAP server connection
- Creating a copy of an LDAP server connection
- Changing an LDAP server connection
- Changing the data update frequency
- Changing the data storage period
- Starting account data update tasks
- Deleting an LDAP server connection
- Authentication using domain accounts
- Connecting over LDAP
- NCIRCC integration
- Integration with the Security Orchestration Automation and Response Platform (SOAR)
- Kaspersky Industrial CyberSecurity for Networks integration
- Integration with Neurodat SIEM IM
- Kaspersky Automated Security Awareness Platform
- Sending notifications to Telegram
- UserGate integration
- Integration with Kaspersky Web Traffic Security
- Integration with Kaspersky Secure Mail Gateway
- Importing asset information from RedCheck
- Configuring receipt of Sendmail events
- Integration with Kaspersky Security Center
- Managing KUMA
- Working with geographic data
- Downloading CA certificates
- Installing and removing KUMA
- User guide
- KUMA resources
- Operations with resources
- Destinations
- Normalizers
- Aggregation rules
- Enrichment rules
- Correlation rules
- Filters
- Active lists
- Viewing the table of active lists
- Adding active list
- Viewing the settings of an active list
- Changing the settings of an active list
- Duplicating the settings of an active list
- Deleting an active list
- Viewing records in the active list
- Searching for records in the active list
- Adding a record to an active list
- Duplicating records in the active list
- Changing a record in the active list
- Deleting records from the active list
- Import data to an active list
- Exporting data from the active list
- Predefined active lists
- Proxies
- Dictionaries
- Response rules
- Notification templates
- Connectors
- Viewing connector settings
- Adding a connector
- Connector settings
- Connector, tcp type
- Connector, udp type
- Connector, netflow type
- Connector, sflow type
- Connector, nats-jetstream type
- Connector, kafka type
- Connector, kata/edr type
- Connector, http type
- Connector, sql type
- Connector, file type
- Connector, 1c-xml type
- Connector, 1c-log type
- [2.0] Connector, diode type
- Connector, ftp type
- Connector, nfs type
- Connector, vmware type
- Connector, wmi type
- Connector, wec type
- Connector, snmp type
- [2.0.1] Connector, snmp-trap type
- Connector, elastic type
- Connector, etw type
- Predefined connectors
- Secrets
- Segmentation rules
- Context tables
- Viewing the list of context tables
- Adding a context table
- Viewing context table settings
- Editing context table settings
- Duplicating context table settings
- Deleting a context table
- Viewing context table records
- Searching context table records
- Adding a context table record
- Editing a context table record
- Deleting a context table record
- Importing data into a context table
- Exporting data from a context table
- Example of incident investigation with KUMA
- Incident conditions
- Step 1. Preliminary steps
- Step 2. Assigning an alert to a user
- Step 3. Check if the triggered correlation rule matches the data of the alert events
- Step 4. Analyzing alert information
- Step 5. False positive check
- Step 6. Determining alert severity
- Step 7. Incident creation
- Step 8. Investigation
- Step 9. Searching for related assets
- Step 10. Searching for related events
- Step 11. Recording the causes of the incident
- Step 12. Incident response
- Step 13. Restoring assets operability
- Step 14. Closing the incident
- Analytics
- Working with events
- Filtering and searching events
- Selecting Storage
- Generating an SQL query using a builder
- Manually creating an SQL query
- Filtering events by period
- Grouping events
- Displaying names instead of IDs
- Presets
- Limiting the complexity of queries in alert investigation mode
- Saving and selecting events filter configuration
- Deleting event filter configurations
- Supported ClickHouse functions
- Viewing event detail areas
- Exporting events
- Configuring the table of events
- Refreshing events table
- Getting events table statistics
- Viewing correlation event details
- Filtering and searching events
- Dashboard
- Reports
- Widgets
- Working with alerts
- Working with incidents
- About the incidents table
- Saving and selecting incident filter configuration
- Deleting incident filter configurations
- Viewing information about an incident
- Incident creation
- Incident processing
- Changing incidents
- Automatic linking of alerts to incidents
- Categories and types of incidents
- Interaction with NCIRCC
- Retroscan
- Working with events
- KUMA resources
- Contacting Technical Support
- REST API
- Creating a token
- Configuring permissions to access the API
- Authorizing API requests
- Standard error
- REST API v1 operations
- Viewing a list of active lists on the correlator
- Import entries to an active list
- Searching alerts
- Closing alerts
- Searching assets
- Importing assets
- Deleting assets
- Searching events
- Viewing information about the cluster
- Resource search
- Loading resource file
- Viewing the contents of a resource file
- Importing resources
- Exporting resources
- Downloading the resource file
- Search for services
- Tenant search
- View token bearer information
- Dictionary updating in services
- Dictionary retrieval
- Viewing custom fields of the assets
- Creating a backup of the KUMA Core
- Restoring the KUMA Core from the backup
- Viewing the list of context tables in the correlator
- Importing records into a context table
- Exporting records from a context table
- REST API v2 operations
- Viewing a list of active lists on the correlator
- Import entries to an active list
- Searching alerts
- Closing alerts
- Searching assets
- Importing assets
- Deleting assets
- Searching events
- Viewing information about the cluster
- Resource search
- Loading resource file
- Viewing the contents of a resource file
- Importing resources
- Exporting resources
- Downloading the resource file
- Search for services
- Tenant search
- View token bearer information
- Dictionary updating in services
- Dictionary retrieval
- Viewing custom fields of the assets
- Creating a backup of the KUMA Core
- Restoring the KUMA Core from the backup
- Viewing the list of context tables in the correlator
- Importing records into a context table
- Exporting records from a context table
- REST API v2.1 operations
- Appendices
- Commands for components manual starting and installing
- Integrity check of KUMA files
- Normalized event data model
- Configuring the data model of a normalized event from KATA EDR
- Alert data model
- Asset data model
- User account data model
- KUMA audit events
- Event fields with general information
- User was successfully signed in or failed to sign in
- User login successfully changed
- User role was successfully changed
- Other data of the user was successfully changed
- User successfully logged out
- User password was successfully changed
- User was successfully created
- User role was successfully assigned
- User role was successfully revoked
- The user has successfully edited the set of fields settings to define sources
- User access token was successfully changed
- Service was successfully created
- Service was successfully deleted
- Service was successfully reloaded
- Service was successfully restarted
- Service was successfully started
- Service was successfully paired
- Service status was changed
- Victoria Metrics alert registered for the service
- Monitoring thresholds changed for the service
- Storage partition was deleted by user
- Storage partition was deleted automatically due to expiration
- Active list was successfully cleared or operation failed
- Active list item was successfully changed, or operation was unsuccessful
- Active list item was successfully deleted or operation was unsuccessful
- Active list was successfully imported or operation failed
- Active list was exported successfully
- Resource was successfully added
- Resource was successfully deleted
- Resource was successfully updated
- Asset was successfully created
- Asset was successfully deleted
- Asset category was successfully added
- Asset category was deleted successfully
- Settings were updated successfully
- Tenant was successfully created
- Tenant was successfully enabled
- Tenant was successfully disabled
- Other tenant data was successfully changed
- Updated data retention policy after changing drives
- The dictionary was successfully updated on the service or operation was unsuccessful
- Response in Active Directory
- Response via KICS for Networks
- Kaspersky Automated Security Awareness Platform response
- KEDR response
- Correlation rules
- Sending test events to KUMA
- Time format
- Mapping fields of predefined normalizers
- Deprecated resources
- Generating events for testing a normalizer
- Information about third-party code
- Trademark notices
- Glossary
"Events" widget
You can use the Events widget to get analytics based on SQL queries.
When creating this type of widget, you must set values for the following settings:
The tab:
- Graph is the type of the graph. The following graph types are available:
- Pie chart.
- Bar chart.
- Counter.
- Line chart.
- Table.
- Date Histogram.
Tenant is the tenant for which data is displayed in the widget. You can select multiple tenants. By default, data is displayed for tenants selected in layout settings.
- Period is the period for which data is displayed in the widget. The following periods are available:
- As layout means data is displayed for the period selected for the layout. The default value.
- 1 hour—data is displayed for the previous hour.
- 1 day—data is displayed for the previous day.
- 7 days—data is displayed for the previous 7 days.
- 30 days—data is displayed for the previous 30 days.
- In period—data is displayed for a custom time period. If you select this option, use the opened calendar to select the start and end dates of the period and click Apply Filter. The date and time format depends on your operating system's settings. You can manually change the date values if necessary.
The upper boundary of the period is not included in the time slice defined by it. In other words, to receive analytics for a whole day, you must configure the period as <Day 1>, 00:00:00 – <Day 2>, 00:00:00 instead of <Day 1>, 00:00:00 – <Day 1>, 23:59:59.
- Show data for previous period—enable the display of data for two periods at the same time: for the current period and for the previous period.
- Storage is the storage that is searched for events.
- SQL query field (
) is the query for manually filtering and searching for events. You can create a query in Builder by clicking
.
How to create a query in Builder
To create a query in Builder:
- Specify the values of the following parameters:
- SELECT—event fields that should be returned. The number of available fields depends on the selected graph type.
- In the drop-down list on the left, select the event fields for which you want to display data in the widget.
- The middle field displays what the selected field is used for in the widget: metric or value.
If you selected the Table graph type, in the middle fields, you must specify column names using ANSII-ASCII characters.
- In the drop-down list on the right, you can select an operation to be performed on the data:
- count—event count. This operation is available only for the ID event field. Used by default for line charts, pie charts, bar charts, and counters. This is the only option for date histogram.
- max is the maximum value of the event field from the event selection.
- min is the minimum value of the event field from the event selection.
- avg is the average value of the event field from the event selection.
- sum is the sum of event field values from the event selection.
- SOURCE is the type of the data source. Only the events value is available for selection.
- WHERE—conditions for filtering events.
- In the drop-down list on the left, select the event field that you want to use for filtering.
- Select the necessary operator from the middle drop-down list. The available operators depend on the type of value of the selected event field.
- In the drop-down list on the right, enter the value of the condition. Depending on the selected type of field, you may have to manually enter the value, select it from the drop-down list, or select it on the calendar.
You can add search conditions by clicking Add condition or remove search conditions by clicking
.
You can also add groups of conditions by clicking Add group. By default, groups of conditions are added with the AND operator, but you can change the it if necessary. Available values: AND, OR, NOT. Group conditions are deleted using the Delete group button.
- GROUP BY—event fields or aliases to be used for grouping the returned data. This parameter is not available for Counter graph type.
- ORDER BY—columns used as the basis for sorting the returned data. This parameter is not available for the Date Histogram and Counter graph types.
- In the drop-down list to the left, select the value that will be used for sorting.
- Select the sort order from the drop-down list on the right: ASC for ascending, DESC for descending.
- For Table type graphs, you can add sorting conditions by clicking Add column.
- LIMIT is the maximum number of data points for the widget. This parameter is not available for the Date Histogram and Counter graph types.
- SELECT—event fields that should be returned. The number of available fields depends on the selected graph type.
- Click Apply.
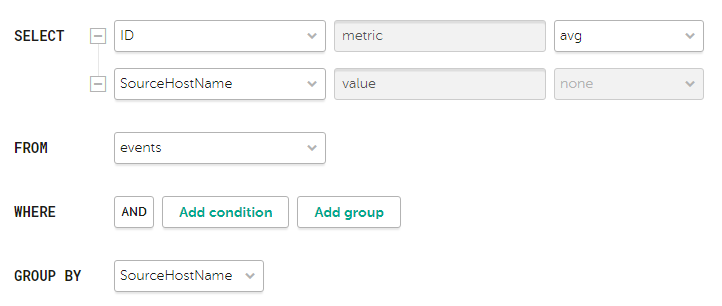
Example of search conditions in the query builder
Search condition parameters for the widget showing average bytes received per host
The following limitations apply:
- The
metric
andvalue
aliases in SQL queries cannot be edited for any type of event analytics widget, except tables. - Aliases in widgets of the Table type can contain Latin and Cyrillic characters, as well as spaces. When using spaces or Cyrillic, the alias must be enclosed in quotation marks:
"An alias with a space"
,`Another alias`
. ARRAY JOIN
SQL queries are not supported.- When displaying data for the previous period, sorting by the
count(ID)
parameter may not work correctly. We recommend sorting by themetric
parameter. For example,SELECT count(ID) AS "metric", Name AS "value" FROM `events` GROUP BY Name ORDER BY metric ASC LIMIT 250
. - In widgets of the Counter type, you must specify the method of data processing for the values of the
SELECT
function:count
,max
,min
,avg
,sum
.
- Specify the values of the following parameters:
The tab:
The tab is displayed if on the tab in the Graph field you have selected one of the following values: Bar chart, Line chart, Date Histogram.
- The Y-min and Y-max values set the scale of the Y axis.
- The X-min and X-max values set the scale of the X axis.
Negative values can be displayed on chart axes. This is due to the scaling of charts on the widget and can be fixed by setting zero as the minimum chart values instead of Auto.
- Line-width is the width of the line on the graph. This field is displayed for the "Line chart" graph type.
- Point size is the size of the pointer on the graph. This field is displayed for the "Line chart" graph type.
The tab:
- Name is the name of the widget.
- Description is the description of the widget.
- Color is the color used for displaying the information:
- default for your browser's default font color
- green
- red
- blue
- yellow
- Horizontal makes the histogram horizontal instead of vertical.
When this option is enabled, when a widget displays a large amount of data, horizontal scrolling is not available and all available information is fit into the fixed size of the widget. If there is a lot of data to display, it is recommended to increase the widget size.
- Show total shows sums total of the values.
- Legend displays a legend for analytics. The toggle switch is turned on by default.
Show nulls in legend displays parameters with a null value in the legend for analytics. The toggle switch is turned off by default.
- Decimals is the number of decimals to which the displayed value must be rounded off.
- Period segments length (available for graphs of the Date Histogram type) sets the length of segments into which you want to divide the period.