Monitoring the application
The Kaspersky application provides the following monitoring functionality:
- Application performance report.
The Kaspersky application constantly generates reports about its performance. Reports are available in the user interface of the application and as files in the application directory.
- Application traces and dumps.
You may need traces and dumps when contacting Kaspersky Technical Support.
Application performance report
The Kaspersky application generates reports of the following types:
- Standard report.
A standard report includes warning and error events. This report is available in the user interface of the application. The application also creates report files in the directory of the application. For example, a report may contain information about starting and finishing a computer scan, actions that the application takes on detected objects, and so on.
- Detailed report.
This report is only available as a file in the directory of the application. To enable detailed report generation, you must run a special command. The detailed report reflects all application events.
To enable the generation of detailed reports, run the following command:
./kaspl.run -- -details
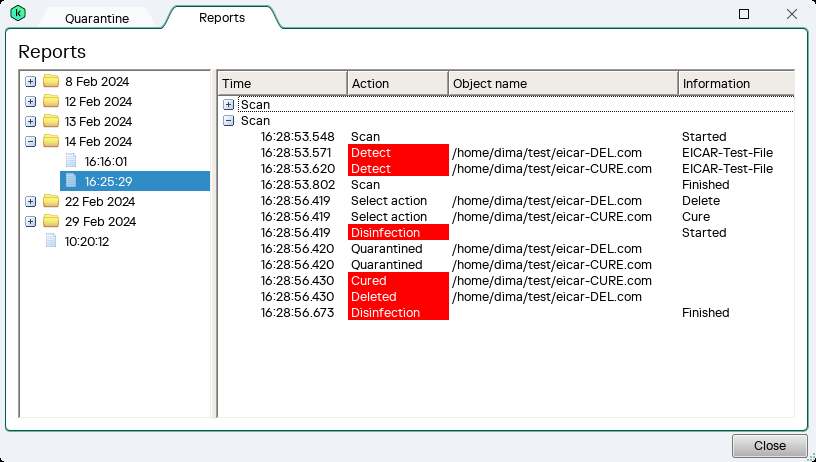
To open the standard application performance report:
- Run the Kaspersky application.
- Select the Reports tab.
The application displays reports grouped by date. The application also generates reports in the following directory:
/var/opt/kaspersky/Kaspersky 24.0/Reportsif the application was run by the superuser (root)./home/<user_name>/kaspersky/Kaspersky 24.0/Reportsif the application was run by an ordinary user.
Files are stored in an encrypted form. You can view reports in the application interface only. To view reports in a text editor, you must run the application from the command line with the -dontencrypt option.
Standard report file names have the report_<date>_*.klr.enc1 format. Detailed report file names have the details_<date>_*.klr.enc1 format. The files are accessible to all users.
Application performance report
Page topCollecting traces and dumps
If you cannot find a solution to your problem in the application documentation or other sources of information about the application, we recommend contacting Technical Support. After you explain your problem to Kaspersky Technical Support, they may ask you to create a trace file and a dump file. The trace file allows tracing the process of performing application commands step by step and determining the stage of application operation at which an error occurs. A dump file contains all information about the working memory of Kaspersky application processes at the moment when the dump file was created. The Kaspersky application creates dumps when the application quits unexpectedly.
To enable trace file collection, run the following command:
./kaspl.run -- -trace
You can also configure the trace level using the -tracelevel <level> option.
Next, you must reproduce the actions that led to the issue. As a result, the Kaspersky application creates trace and dump files in the following directory:
/var/opt/kaspersky/Kaspersky 24.0/Tracesif the application was run by the superuser (root)./home/<user_name>/kaspersky/Kaspersky 24.0/Tracesif the application was run by an ordinary user.
Files are stored in an encrypted form. Trace file names have the KASPL.<application_version>_<date>_<time>_*.log.enc1 format. Dump file names have the *.dmp.enc1 format. Only the user that ran the application can access the files.