Contents
- Monitoring solution components
- Specifying the Zabbix server
- Specifying the Zabbix proxy server
- Configuring CPE device monitoring
- Viewing monitoring results
- Viewing problems
- Viewing the status of the solution and its components
- Viewing logs
- Viewing and deleting service requests
- Sending CPE device notifications to users
- Selecting the Docker container log verbosity
- Monitoring CPE, VNF, and PNF devices using SNMP
- Link monitoring
Monitoring solution components
An external Zabbix monitoring system is used for monitoring of CPE devices, as well as virtual and physical network functions. You must deploy a Zabbix server on one of your locations, or connect an existing Zabbix server, and deploy Zabbix proxy servers.
Zabbix proxy servers are used for receiving monitoring results at individual locations and sending these results to the Zabbix server. The Zabbix server processes the monitoring results, after which they are displayed in the web interface of the orchestrator.
The orchestrator uses an API to integrate with the Zabbix server. When you register a CPE device or deploy a VNF or PNF in a network service, a corresponding host is automatically created on the Zabbix server. You can specify the groups on the Zabbix server in which hosts are to be placed. The host on the Zabbix server is automatically deleted if you delete its corresponding CPE device, VNF, or PNF.
Two monitoring methods are supported:
- Monitoring using Zabbix agents involves a component automatically sending monitoring data to a Zabbix proxy server.
- Monitoring via SNMP involves the Zabbix proxy server automatically connecting to a component via SNMP and receiving monitoring data.
For details about configuring the monitoring system, see the official documentation of the Zabbix solution.
Specifying the Zabbix server
To specify the Zabbix server:
- In the menu, go to the Monitoring section.
The settings for connecting to the Zabbix server are displayed.
- In the URL field, enter the URL of the Zabbix API. The orchestrator sends HTTP requests to this URL to receive monitoring results and display then as charts.
The URL consists of the address of the Zabbix web interface and the api_jsonrpc.php file name, which is used for API calls. For example, if the Zabbix web interface is located at http://192.168.2.1, enter
http://192.168.2.1/api_jsonrpc.php. - In the Username field, enter the user name for connecting the orchestrator to the Zabbix API. You must enter the user name of an account that has read and write permissions to groups on the Zabbix server, as well as permission to create groups.
- In the Password field, enter the password for connecting to the Zabbix API.
- In the Grouping by Zabbix drop-down list, select a method for grouping CPE device hosts, as well as virtual and physical network functions on the Zabbix server:
- By specified groups to place hosts of CPE devices, virtual network functions, and physical network functions into the specified groups. If you select this option, do the following:
- In the VNF/PNF group field, enter a group name for the virtual and physical network function hosts.
- In the CPE group field, enter a group name for CPE device hosts.
- By tenant to place hosts of CPE devices, virtual network functions, and physical network functions into automatically created groups. Groups correspond to tenants to which the CPE devices are added, and virtual and physical network functions are assigned.
- By specified groups to place hosts of CPE devices, virtual network functions, and physical network functions into the specified groups. If you select this option, do the following:
- In the Triggers synchronization (sec.) field, enter the interval in seconds for receiving notifications about problems from the Zabbix server on the orchestrator. Range of values: 5 to 600. Default value:
600. - Below the Token field, click Generate to generate a token that API requests from the Zabbix server to the orchestrator must contain. If an API request does not contain the token, the orchestrator does not accept such a request. Security is also protected by TLS certificates.
You can enter the token manually or view it by clicking the view icon
 .
. - If you want to check the availability of the Zabbix server, click Test connection.
- Click Apply.
The Zabbix server is specified.
Page topSpecifying the Zabbix proxy server
To specify a Zabbix proxy server:
- In the menu, go to the Infrastructure section.
This opens the resource management page. By default, the Network resources tab is selected, which displays the table of controllers.
- In the Resources pane, select the created domain, then select the added data center for which you want to specify a Zabbix proxy server.
- Select the System resources tab.
The settings for connecting to the Zabbix proxy server and VNFM are displayed.
- Under Zabbix proxy, in the Name field, enter the name of the Zabbix proxy server. The name must match the name specified in the Zabbix server settings.
- In the IP field, enter the IP address of the Zabbix proxy server. The entered IP address must be accessible for the CPE devices and virtual and physical network functions that you want to monitor.
- Click Apply.
The Zabbix proxy server is specified.
You can delete the Zabbix proxy server connection settings by clicking Delete.
Page topConfiguring CPE device monitoring
You can configure monitoring in a CPE template. When you configure monitoring in a CPE template, the settings are propagated to all CPE devices that are using the template.
To configure CPE device monitoring:
- In the menu, go to the SD-WAN → CPE templates section.
A table of CPE templates is displayed.
- Click the CPE template in which you want to configure monitoring.
The settings area is displayed in the lower part of the page. You can expand the settings area to fill the entire page by clicking the expand icon
 . By default, the Information tab is selected, which displays general information about the CPE template.
 - Select the Monitoring tab.
The CPE device monitoring settings are displayed.
- In the Monitoring type drop-down list, select a monitoring method for the CPE device:
- SNMP means monitoring using the SNMP protocol.
- Agent means monitoring using Zabbix agents.
- In the Zabbix template field, enter the name of the Zabbix template.
- In the upper part of the settings area, click Save to save CPE template settings.
Viewing monitoring results
You can view monitoring results for an SD-WAN instance, CPE device, a virtual network function, or a physical network function:
- To view the monitoring results for an SD-WAN instance, go to the SD-WAN→SD-WAN instances section, the SD-WAN instance, and select the Monitoring tab.
- To display monitoring results for a CPE device, go to the SD-WAN → CPE section, click the CPE device, and select the Monitoring tab.
- To display monitoring results for a virtual or physical network function, log in to the self-service portal, go to the Catalog menu section, in the Network services pane, click the deployed network service, click the virtual or physical network function, and select the Monitoring tab.
In the drop-down list in the upper part of the settings area, you can select the parameter for which the monitoring results are displayed. To display monitoring results for a selected period, you can use the following time filters:
- Real-time
- Day
- Week
- Month
You can also specify the time period manually.
Page topViewing problems
The monitoring settings on the Zabbix server determine which problems warrant notifications and how these problems are classified according to their severity levels. The table of problems is displayed on the CPE device and in virtual or physical network function settings:
- To display the table of problems for a CPE device, go to the SD-WAN → CPE menu section, click the CPE device, and select the Problems tab.
- To display the table of problems for a virtual or physical network function, log in to the self-service portal, go to the Catalog menu section, in the Network services pane, click the deployed network service, click the virtual or physical network function, and select the Problems tab.
Information about problems is displayed in the following columns of the table:
- Name is the name of the problem.
- Level is the severity level of the problem:
- Average
- Disaster
- High
- Information
- Not classified
- Time is the time when the problem occurred.
- Duration is the duration of the problem in seconds.
Viewing the status of the solution and its components
To view the status of solution components:
- In the menu, go to the Dashboard section.
The following blocks of information are displayed:
- Event errors contains errors that occurred during events.
- Task errors contains errors that occurred when performing custom tasks.
- Active sessions contains active user sessions.
- Resources contains information about computing resource usage by solution components.
- Service requests contains service requests.
- Disconnected CPE contains CPE devices to which access has been lost.
- Errors on CPE contains errors encountered by CPE devices.
- Problems on CPE contains problems encountered by CPE devices.
- Problems on VNF/PNF contains problems encountered by virtual and physical network functions.
If a solution component is operating correctly, the corresponding widget displays the Everything is running smoothly message. An update icon
 is displayed in the upper part of a block; when this icon is clicked, the displayed information is refreshed. You can drag widgets with the mouse to change the layout.
 - If you want to configure which blocks are displayed by default, in the upper part of the page, click the settings icon
 → Reset to default layout.
 - If you want to set a different time interval for updating information in blocks:
- In the upper part of the page, click the settings icon → Set update interval.
- This opens a window; in that window, in the Update dashboard every (sec.) field, enter the interval in seconds for updating information in blocks. Range of values: 5 to 86,400. The default setting is
60. - Click Ok.
The interval in seconds for updating information in blocks is modified.
- In the upper part of the page, click the settings icon
Viewing logs
You can view the logs of solution components for technical support purposes. Kaspersky SD-WAN does not send logs outside the perimeter of your organization's information infrastructure.
To view logs:
- In the menu, go to the Logs section.
The log management page is displayed.
- In the Data centers pane, select the created data center to which the solution components belong.
- In the Resources pane, select the solution component whose log you want to view.
The log is displayed. By default, the Tasks tab is selected, which displays the table of custom tasks. Information about custom tasks is displayed in the following columns of the table:
- Task action is the action of the custom task.
- Object is the solution component associated with the custom task.
- SR is a link to the service request associated with the custom task.
- Object ID is the ID of the solution component associated with the custom task.
- Object name is the name of the solution component associated with the custom task.
- Initiator is the name of the user that ran the custom task.
- Initiator IP is the IP address of the user that ran the custom task.
- Start time is the date and time when the custom task began running.
- End time is the date and time when the custom task finished running.
- If you want to view information about events that occurred during the operation of a solution component, select the Events tab.
A table of events is displayed. Information about events is displayed in the following columns of the table:
- Event action is the action of the event.
- Object is the solution component associated with the event.
- SR is a link to the service request associated with the event.
- Object name is the name of the solution component associated with the event.
- Object ID is the ID of the solution component associated with the event.
- Initiator is the name of the user whose action caused the event.
- Time is the date and time when the event was created.
- If you want to view the service requests of a solution component, select the Service requests tab.
A table of service requests is displayed. Information about service requests is displayed in the following columns of the table:
- Service request is the name of the service request.
- Status is the status of the service request.
- Initiator is the name of the user whose action caused the service request.
- Time is the date and time when the service request was created.
The actions you can perform with the tables are described in the Managing solution component tables instructions.
Page topViewing and deleting service requests
Service requests are tasks that are performed while solution components are working and are automatically created as a result of user actions. For example, when a user applies a CPE template to a CPE device, a corresponding service request is created. Each service request consists of several steps that are executed in sequence.
Viewing service requests
You can view the service requests of a tenant, a CPE device, and an SD-WAN instance:
- To view service requests for a tenant, go to the Tenants section and under Tenants, select a tenant.
The list of service requests is displayed under Service requests.
- To view the service requests for an SD-WAN instance, go to the SD-WAN→SD-WAN instances section, the SD-WAN instance, and select the Service requests tab.
A table of service requests is displayed.
- To display service requests for a CPE device, go to the SD-WAN → CPE section, click the CPE device, and select the Service requests tab.
A table of service requests is displayed.
The list of service requests of a tenant displays the name and ID of the service request, as well as its creation date and time. Information about service requests of an SD-WAN instance and CPE device is displayed in the following table columns:
- Name is the name of the service request.
- Created is the date and time when the service request was created.
- Task ID is the ID of the service request.
- Time is the duration of the service request in seconds.
- Status is the status of the service request:
- Created means the service request is created.
- Executing means the service request is being executed.
- Not executed means an error occurred while executing the service request.
- Executed means the service request was successfully executed.
- Reverting means an error occurred while executing one of the steps of the service request, so the steps that already have been executed are now being reverted.
- Not reverted means an error occurred while reverting one of the previously executed steps of the service request.
- Reverted means the previously executed steps of the service request have been successfully reverted.
- Actions contains the actions can be performed with the service requests.
You can open the step-by-step log of the service request:
- If you want to open the step-by-step log of a tenant's service request, click the name of the service request.
- If you want to open a step-by-step log of a service request for an SD-WAN instance or CPE device, click the ID of the service request.
A step-by-step log of the service request is displayed.
The log contains information about the steps at which the errors occurred, as well as a detailed description of the errors.
Deleting service requests
You can delete service requests of an SD-WAN instance or a CPE device. Deleting a service request stops the associated operation.
Deleted service requests cannot be restored.
To delete a service request, do one of the following:
- If you want to delete an individual service request, click Delete next to it.
- If you want to delete all service requests, in the upper part of the settings area, under Actions, click Delete all service requests.
The service requests are deleted and are no longer displayed in the table.
Page topSending CPE device notifications to users
Kaspersky SD-WAN supports sending notifications to user email addresses with the following information about CPE devices:
- Events from the log:
- Enabling and disabling a CPE device
- Connecting or disconnecting a port
- Connecting or disconnecting a link
- Problems:
- Encountered problems
- Resolved problems
Information is accumulated for five seconds before the notification is sent. For example, if disconnecting a port causes five links to be disconnected, this information must be accumulated and sent to the user in the same notification.
Specify the SMTP server to be used by all tenants for sending notifications. On the administrator portal, you can configure notifications about events and problems for all tenants. On the self-service portal, you can configure notifications about events and problems for an individual tenant.
Page topSpecifying the SMTP Server
To specify an SMTP server:
- In the menu, go to the Notification section.
By default, the SMTP tab is selected, which displays the SMTP server connection settings.
- Select the Enable check box to use the SMTP server. This check box is cleared by default.
- In the SMTP server field, enter the IP address or domain name of the SMTP server.
- In the SMTP server port field, enter the port number of the SMTP server. Range of values: 0 to 65,535. Default value:
25. - In the Sender email field, enter the email address from which the SMTP server sends notifications to users.
- If you want to configure encryption of the connection between Kaspersky SD-WAN and the SMTP server, in the SSL/TLS drop-down list, select one of the following values:
- None to leave the connection unencrypted. Default value.
- STARTTLS to determine the encryption method and then establish an encrypted connection.
- SMTPS to establish an encrypted connection straight away.
- If you want to enable Kaspersky SD-WAN authentication on the SMTP server:
- Select the Authentication check box. This check box is cleared by default.
- In the Username field, enter the user name that Kaspersky SD-WAN uses to authenticate on the SMTP server. Maximum length: 64 characters.
- In the Password field, enter the password that Kaspersky SD-WAN uses to authenticate on the SMTP server. Maximum length: 64 characters. To see the entered password, you can click the show icon .
- If you want to send a test message using the SMTP server:
- Click Test.
- This opens a window; in that window, enter the email address to which you want the SMTP server to send a test message.
- Click Send.
A test message is sent to the specified email address with Notification test in the subject and body.
- Click Apply.
The SMTP server is specified.
Page topConfiguring notifications
The platform administrator must specify the SMTP server to enable sending notifications to the user.
To configure notifications:
- Navigate to the configuration of user notifications in one of the following ways:
- If you logged in to the administrator portal, go to the Notification menu section and select the Alert tab.
- If you logged in to the self-service portal, go to the Notification menu section.
Notification settings are displayed.
- Select the Enable check box to send notifications to the user. This check box is cleared by default.
- In the Receiver email field, enter the email address to which you want to send notifications.
- In the Subject field, enter the subject text of the notification email messages. Maximum length: 64 characters.
- Click Apply.
Notifications will be sent to the specified email address.
Page topSelecting the Docker container log verbosity
Kaspersky SD-WAN automatically keeps logs of Docker containers, which are used to deploy and maintain solution components. You can select the level of detail of these logs for monitoring Docker containers and quickly recovering from faults.
To select Docker container log verbosity:
- In the lower part of the menu, click the settings icon → Log settings.
This opens a page displaying a table of Docker containers. Information about Docker containers is displayed in the following columns of the table:
- Module name is the name of the Docker container.
- Logging level is the Docker container log verbosity:
- Select the Docker container verbosity level in one of the following ways:
- If you want to select the verbosity level of all Docker containers, click the corresponding button in the General logging level section.
- If you want to select the verbosity level for an individual Docker container, click the corresponding button next to it.
You can select the following verbosity levels for Docker containers:
- TRACE to have the log include the most complete information about the operation and condition of the module and its variables. You can use this level of detail for observing code execution, as well as for diagnostics and detailed analysis of errors that occur during development.
- DEBUG to have the log include the information necessary for debugging the module, such as the status of operations and values of variables. You can use this level of detail to diagnose errors and analyze module behavior.
- INFO to have the log include general information necessary for understanding the functioning of the module, for example, confirmations of operations. You can use this level of detail to track the progress of the execution of the module. This level of detail is selected by default for all containers.
- WARN to have the log include information about incidents that are not errors, but may compromise the operation of the container and require your intervention, such as problems with settings and deprecated functions. You can use this level of detail to prevent potential errors.
- ERROR to have the log include information about errors that occur during the execution of the code and require your intervention. An error message can contain information about the part of the container in which the error occurred, as well as detailed information about the error. You can use this level of detail to resolve occurring errors.
Monitoring CPE, VNF, and PNF devices using SNMP
You can use SNMP to monitor CPE devices as well as virtual and physical network functions. You need to install an SNMP agent on the component that you want to monitor. The SNMP agent gathers monitoring data and sends it to the SNMP manager for processing. In Kaspersky SD-WAN, the Zabbix proxy server acts as the SNMP manager.
The SNMP manager and SNMP agents exchange requests and notifications. By default, SNMP agents receive requests from the SNMP manager on port 161. However, the SNMP manager can send requests through any available port. The response arrives on the same port from which the request was sent.
By default, the SNMP manager receives notifications from SNMP agents on port 162. However, SNMP agents can send notifications through any available port. Two types of notifications exist:
- Traps are notifications about events that the SNMP agent sends without a prior request from the SNMP manager. When a specified event occurs, such as a shutdown of a CPE device or one of its network interfaces, the SNMP agent generates a trap and sends it to the SNMP manager as a UPD message. Traps allow automatically informing the SNMP manager about events without waiting for a request.
- Inform requests are notifications similar to traps, which differ in that they require additional confirmation from the SNMP manager. When the SNMP agent sends an inform request to the SNMP manager, the SNMP agent waits to receive an acknowledgment. If the SNMP manager successfully receives and processes the inform request, it sends an acknowledgment message to the SNMP agent. The acknowledgment mechanism allows you to ensure the reliability of delivery of notifications.
When using the TLS or DTLS protocol, traps arrive on port 10162 of the SNMP manager, and information requests arrive on port 10161.
All basic protocol data units (PDUs) have the same structure (see figure below). The IP header and UDP header are used for encapsulation and are not actually part of the protocol data unit.
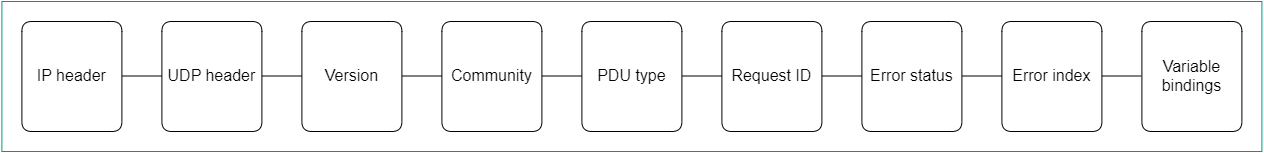
SNMP Protocol Data Unit diagram
To display the table of traps, go to the Infrastructure menu section, click Management → Configuration menu next to the controller to which the components that you want to monitor are connected, and go to the SNMP section. Information about traps is displayed in the following columns of the table:
- # is the serial number of the trap.
- Manager IP is the IP address or host name of the SNMP manager.
- Manager port is the port number of the SNMP manager.
- Community is the SNMP community string.
- Allowed traps are traps that SNMP agents must send to the SNMP manager.
- Description is a brief description of the trap.
Configuring the connection of the SNMP manager to SNMP agents
You must specify the settings for connecting the SNMP manager to SNMP agents installed on CPE devices, as well as on the virtual and physical network functions. The specified settings are used for all SNMP agents.
To configure the connection of the SNMP manager to SNMP agents:
- In the menu, go to the Infrastructure section.
This opens the resource management page. By default, the Network resources tab is selected, which displays the table of SD-WAN Controllers.
- Click Management → Configuration menu next to the controller to which the components that you want to monitor are connected.
This opens the controller configuration menu. By default, you are taken to the Controller nodes section, which displays a table of controller nodes.
- Go to the SNMP section.
A table of traps is displayed.
- In the upper part of the page, under Manager parameters, click Edit.
- This opens a window; in that window, in the Address field, enter the IP address or host name of the equipment on which the SNMP agent is installed, in the
<transport protocol>:<IP address or host name>/<port number>format. For example, you can enterudp:192.168.2.0/24. - In the Community field, enter the SNMP community string. The SNMP community string is used as a password which the SNMP manager uses to connect to SNMP agents. Default value:
publicmeans read-only access is granted. We recommend changing the default to a unique community string to ensure the security of communication between the SNMP manager and the SNMP agents.You must specify the same community string when configuring the SNMP manager connection to SNMP agents and when creating or editing traps.
- Click Save.
The connecting of the SNMP manager to agents is configured.
Page topCreating a trap
You can create a trap that SNMP agents must send to the SNMP manager.
To create a trap:
- In the menu, go to the Infrastructure section.
This opens the resource management page. By default, the Network resources tab is selected, which displays the table of SD-WAN Controllers.
- Click Management → Configuration menu next to the controller to which the components that you want to monitor are connected.
This opens the controller configuration menu. By default, you are taken to the Controller nodes section, which displays a table of controller nodes.
- Go to the SNMP section.
A table of traps is displayed.
- Under Trap parameters, click Edit.
- This opens a window; in that window, click + Add to create a trap.
- In the Manager IP field, enter the IP address or host name of the SNMP manager. Range of values: 1 to 255.
- In the Manager port field, enter the port number of the SNMP manager. Range of values: 1 to 65,534. Default value:
162. - In the Community field, enter the SNMP community string. The SNMP community string is used as a password which the SNMP manager uses to connect to SNMP agents. Default value:
publicmeans read-only access is granted. We recommend changing the default to a unique community string to ensure the security of communication between the SNMP manager and the SNMP agents.You must specify the same SNMP community string when configuring the SNMP manager connection to SNMP agents and when creating or editing traps.
- In the Allowed traps field, click Edit and clear the following check boxes to specify which traps SNMP agents do not send to the SNMP manager:
- Clear the Trap, when an interface is active check box to prevent the SNMP agent from sending a trap to the SNMP manager when one of the ports of the component on which the SNMP agent is installed becomes active.
- Clear the Trap, when an interface is inactive check box to prevent the SNMP agent from sending a trap to the SNMP manager when one of the ports of the component on which the SNMP agent is installed becomes inactive.
- Clear the Trap, when an equipment is active check box to prevent the SNMP agent from sending a trap to the SNMP manager when the component on which the SNMP agent is installed becomes active.
- Clear the Trap, when an equipment is inactive check box to prevent the SNMP agent from sending a trap to the SNMP manager when the component on which the SNMP agent is installed becomes inactive.
By default, the check boxes are selected.
- Click Back to continue specifying trap settings.
- In the Description field, enter a brief description of the trap.
- Click Save.
The trap is created and displayed in the table.
Page topEditing a trap
To edit a trap:
- In the menu, go to the Infrastructure section.
This opens the resource management page. By default, the Network resources tab is selected, which displays the table of controllers.
- Click Management → Configuration menu next to the controller to which the components that you want to monitor are connected.
This opens the controller configuration menu. By default, you are taken to the Controller nodes section, which displays a table of controller nodes.
- Go to the SNMP section.
A table of traps is displayed.
- Under Trap parameters, click Edit.
- This opens a window; in that window, if necessary, edit the trap settings. For a description of the settings, see instructions for creating a trap.
- Click Save.
The trap is modified and updated in the table.
Page topDeleting a trap
Deleted traps cannot be restored.
To delete a trap:
- In the menu, go to the Infrastructure section.
This opens the resource management page. By default, the Network resources tab is selected, which displays the table of controllers.
- Click Management → Configuration menu next to the controller to which the components that you want to monitor are connected.
This opens the controller configuration menu. By default, you are taken to the Controller nodes section, which displays a table of controller nodes.
- Go to the SNMP section.
A table of traps is displayed.
- Under Trap parameters, click Edit.
- This opens a window; in that window, click Delete next to the trap that you want to delete.
- Click Save.
The trap is deleted and is no longer displayed in the table.
Page topLink monitoring
To enable link monitoring:
- Enable link monitoring in one of the following ways:
- If you want to enable monitoring for a link that was established from a CPE device, go to the SD-WAN → CPE section, click the CPE device, select the Links tab, and click Management → Set thresholds next to the link.
- If you want to enable monitoring of one of the links in the table of all links, go to the Infrastructure section, click Management → Configuration menu next to the controller, go to the Links section, and click Management → Set thresholds next to the link.
- If you want to enable monitoring of one of the links in the graphic topology with all links, go to the Infrastructure section, click Management → Configuration menu next to the controller, go to the Topology section, click the link, and click Set thresholds.
- Select the Enable tunnel thresholds monitoring check box to enable link monitoring. This check box is cleared by default.
- If you want to specify link monitoring thresholds:
- To set default link monitoring thresholds, click Set to default.
- If you want the controller to use the link as the last resort when calculating paths, regardless of monitoring thresholds, select the Unsolicited check box. This check box is cleared by default.
- In the Interval for processing errors and utilization rate (sec.) field, enter the time interval in seconds for measuring the number of errors on the link and its level of utilization. Range of values: 1 to 300. Default value:
60. - If you want to specify a threshold for the number of errors per second on the link, select the Enable error monitoring check box and in the Critical error level (errors/sec.) field, enter the threshold value. Range of values: 1 to 1,000,000. By default, the check box is cleared and the field is set to
1000. - If you want to specify a threshold for link utilization as a percentage of the bit rate of the source service interface, select the Enable utilization monitoring check box and in the Critical utilization level (%) field, enter the threshold value. By default, the check box is cleared and the field is set to
95. - In the Interval for processing latency, jitter, and packet loss (sec.) field, enter the time interval, in seconds, for measuring latency, jitter, and packet loss on the link. Range of values: 1 to 600. Default value:
30. - If you want to specify a threshold for latency in milliseconds for transmitting traffic over the link, select the Enable latency monitoring check box and in the Critical latency level (ms.) field, enter the threshold value. Range of values: 5 to 1000. By default, the check box is cleared and the field is set to
100. - If you want to specify a threshold for jitter time in milliseconds for transmitting traffic over the link, select the Enable jitter monitoring check box and in the Critical jitter level (ms.) field, enter the threshold value. Range of values: 5 to 1000. By default, the check box is cleared and the field is set to
100. - If you want to specify a threshold for the percentage of lost traffic packages on the link, select the Enable packet loss monitoring check box and in the Critical packet loss level (%) field, enter the threshold value. Range of values: 1 to 100. By default, the check box is cleared and the field is set to
2.
The specified monitoring thresholds are used by the threshold constraints.
- Save the link monitoring settings in one of the following ways:
- To save the link monitoring settings, click Save.
- If you want to save the link monitoring settings and specify the same settings on the opposite-direction link, click Save for both tunnels.
If you have specified link monitoring settings for a link established from the CPE device, click Save in the upper part of the settings area to save the CPE device settings.