Monitoring CPE, VNF, and PNF devices using SNMP
You can use SNMP to monitor CPE devices as well as virtual and physical network functions. You need to install an SNMP agent on the component that you want to monitor. The SNMP agent gathers monitoring data and sends it to the SNMP manager for processing. In Kaspersky SD-WAN, the Zabbix proxy server acts as the SNMP manager.
The SNMP manager and SNMP agents exchange requests and notifications. By default, SNMP agents receive requests from the SNMP manager on port 161. However, the SNMP manager can send requests through any available port. The response arrives on the same port from which the request was sent.
By default, the SNMP manager receives notifications from SNMP agents on port 162. However, SNMP agents can send notifications through any available port. Two types of notifications exist:
- Traps are notifications about events that the SNMP agent sends without a prior request from the SNMP manager. When a specified event occurs, such as a shutdown of a CPE device or one of its network interfaces, the SNMP agent generates a trap and sends it to the SNMP manager as a UPD message. Traps allow automatically informing the SNMP manager about events without waiting for a request.
- Inform requests are notifications similar to traps, which differ in that they require additional confirmation from the SNMP manager. When the SNMP agent sends an inform request to the SNMP manager, the SNMP agent waits to receive an acknowledgment. If the SNMP manager successfully receives and processes the inform request, it sends an acknowledgment message to the SNMP agent. The acknowledgment mechanism allows you to ensure the reliability of delivery of notifications.
When using the TLS or DTLS protocol, traps arrive on port 10162 of the SNMP manager, and information requests arrive on port 10161.
All basic protocol data units (PDUs) have the same structure (see figure below). The IP header and UDP header are used for encapsulation and are not actually part of the protocol data unit.
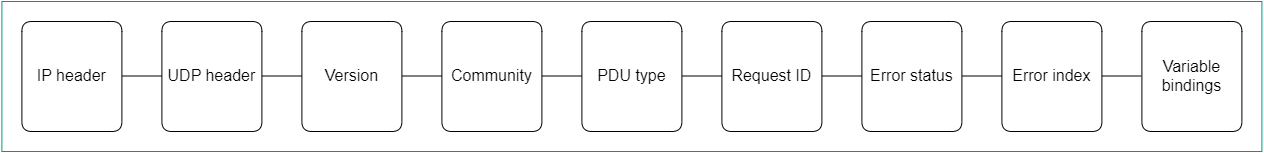
SNMP Protocol Data Unit diagram
To display the table of traps, go to the Infrastructure menu section, click Management → Configuration menu next to the controller to which the components that you want to monitor are connected, and go to the SNMP section. Information about traps is displayed in the following columns of the table:
- # is the serial number of the trap.
- Manager IP is the IP address or host name of the SNMP manager.
- Manager port is the port number of the SNMP manager.
- Community is the SNMP community string.
- Allowed traps are traps that SNMP agents must send to the SNMP manager.
- Description is a brief description of the trap.