Contents
- Kaspersky Next XDR Expert
- Quick links
- What's new
- About Kaspersky Next XDR Expert
- Architecture of Open Single Management Platform
- OSMP Console interface
- Licensing
- About data provision
- Quick start guide
- Deployment of Kaspersky Next XDR Expert
- Hardening Guide
- Deployment schemes
- Ports used by Kaspersky Next XDR Expert
- Preparation work and deployment
- Multi-node deployment: Preparing the administrator and target hosts
- Single node deployment: Preparing the administrator and target hosts
- Preparing the hosts for installation of the KUMA services
- Installing a database management system
- Configuring the PostgreSQL or Postgres Pro server for working with Open Single Management Platform
- Preparing the KUMA inventory file
- Multi-node deployment: Specifying the installation parameters
- Single-node deployment: Specifying the installation parameters
- Specifying the installation parameters by using the Configuration wizard
- Installing Kaspersky Next XDR Expert
- Configuring internet access for the target hosts
- Synchronizing time on machines
- Installing KUMA services
- Deployment of multiple Kubernetes clusters and Kaspersky Next XDR Expert instances
- Pre-check of infrastructure readiness for deployment
- Signing in to Kaspersky Next XDR Expert
- Kaspersky Next XDR Expert maintenance
- Upgrading Kaspersky Next XDR Expert from version 1.1 to 1.2
- Updating Kaspersky Next XDR Expert components
- Adding and deleting nodes of the Kubernetes cluster
- Versioning the configuration file
- Uninstalling Kaspersky Next XDR Expert
- Manual uninstalling of Kaspersky Next XDR Expert components
- Reinstalling Kaspersky Next XDR Expert components
- Stopping the Kubernetes cluster nodes
- Using certificates for public Kaspersky Next XDR Expert services
- Calculation and changing of disk space for storing Administration Server data
- Rotation of secrets
- Adding hosts for installing the additional KUMA services
- Replacing a host that uses KUMA storage
- Migration to Kaspersky Next XDR Expert
- Integration with other solutions
- Threat detection
- Working with alerts
- About alerts
- Alert data model
- Viewing the alert table
- Viewing alert details
- Assigning alerts to analysts
- Changing an alert status
- Creating alerts manually
- Linking alerts to incidents
- Unlinking alerts from incidents
- Linking events to alerts
- Unlinking events from alerts
- Editing alerts by using playbooks
- Working with alerts on the investigation graph
- Aggregation rules
- Working with incidents
- About incidents
- Incident data model
- Creating incidents
- Viewing the incident table
- Exporting information about incidents
- Viewing incident details
- Assigning incidents to analysts
- Changing an incident status
- Changing an incident priority
- Merging incidents
- Editing incidents by using playbooks
- Investigation graph
- Segmentation rules
- Copying segmentation rules to another tenant
- Managing incident types
- Managing incident workflows
- Configuring the retention period of alerts and incidents
- Viewing asset details
- Working with alerts
- Threat hunting
- Threat response
- Response actions
- Terminating processes
- Moving devices to another administration group
- Running a malware scan
- Viewing the result of the malware scan
- Updating databases
- Moving files to quarantine
- Changing authorization status of devices
- Viewing information about KASAP users and changing learning groups
- Responding through Active Directory
- Responding through KATA/KEDR
- Responding through UserGate
- Responding through Ideco NGFW
- Responding through Ideco UTM
- Responding through Redmine
- Responding through Check Point NGFW
- Responding through Sophos Firewall
- Responding through Continent 4
- Responding through SKDPU NT
- Responding through FortiGate
- Viewing response history from alert or incident details
- Playbooks
- Viewing the playbooks table
- Creating playbooks
- Editing playbooks
- Customizing playbooks
- Viewing playbook properties
- Terminating playbooks
- Deleting playbooks
- Launching playbooks and response actions
- Configuring manual approval of response actions
- Approving playbooks or response actions
- Enrichment from playbook
- Viewing response history
- Predefined playbooks
- Playbook trigger
- Playbook algorithm
- Editing incidents by using playbooks
- Editing alerts by using playbooks
- Response actions
- REST API
- API Reference Guide
- Managing Kaspersky Unified Monitoring and Analysis Platform
- About Kaspersky Unified Monitoring and Analysis Platform
- Program architecture
- Administrator's guide
- Logging in to the KUMA Console
- KUMA services
- Services tools
- Service resource sets
- Creating a storage
- Creating a correlator
- Creating an event router
- Creating a collector
- Predefined collectors
- Creating an agent
- Creating a set of resources for an agent
- Managing connections for an agent
- Creating an agent service in the KUMA Console
- Installing an agent in a KUMA network infrastructure
- Automatically created agents
- Update agents
- Transferring events from isolated network segments to KUMA
- Transferring events from Windows machines to KUMA
- AI services
- Configuring event sources
- Configuring receipt of Auditd events
- Configuring receipt of KATA/EDR events
- Configuring Open Single Management Platform for export of events to the KUMA SIEM-system
- Configuring receiving Open Single Management Platform event from MS SQL
- Creating an account in the MS SQL database
- Configuring the SQL Server Browser service
- Creating a secret in KUMA
- Configuring a connector
- Configuring the KUMA Collector for receiving Open Single Management Platform events from an MS SQL database
- Installing the KUMA Collector for receiving Open Single Management Platform events from the MS SQL database
- Configuring receipt of events from Windows devices using KUMA Agent (WEC)
- Configuring audit of events from Windows devices
- Configuring centralized receipt of events from Windows devices using the Windows Event Collector service
- Granting permissions to view Windows events
- Granting permissions to log on as a service
- Configuring the KUMA Collector for receiving events from Windows devices
- Installing the KUMA Collector for receiving events from Windows devices
- Configuring forwarding of events from Windows devices to KUMA using KUMA Agent (WEC)
- Configuring receipt of events from Windows devices using KUMA Agent (WMI)
- Configuring receipt of DNS server events using the ETW agent
- Configuring receipt of PostgreSQL events
- Configuring receipt of IVK Kolchuga-K events
- Configuring receipt of CryptoPro NGate events
- Configuring receipt of Ideco UTM events
- Configuring receipt of KWTS events
- Configuring receipt of KLMS events
- Configuring receipt of KSMG events
- Configuring the receipt of KICS for Networks events
- Configuring receipt of PT NAD events
- Configuring receipt of events using the MariaDB Audit Plugin
- Configuring receipt of Apache Cassandra events
- Configuring receipt of FreeIPA events
- Configuring receipt of VipNet TIAS events
- Configuring receipt of Nextcloud events
- Configuring receipt of Snort events
- Configuring receipt of Suricata events
- Configuring receipt of FreeRADIUS events
- Configuring receipt of VMware vCenter events
- Configuring receipt of zVirt events
- Configuring receipt of Zeek IDS events
- Configuring Windows event reception using Kaspersky Endpoint Security for Windows
- Configuring receipt of Codemaster Mirada events
- Configuring receipt of Postfix events
- Configuring receipt of CommuniGate Pro events
- Configuring receipt of Yandex Cloud events
- Configuring receipt of Microsoft 365 events
- Monitoring event sources
- Managing assets
- Adding an asset category
- Configuring the table of assets
- Searching assets
- Exporting asset data
- Viewing asset details
- Adding assets
- Adding asset information in the KUMA Console
- Importing asset information and asset vulnerability information from Open Single Management Platform
- Importing asset information from MaxPatrol
- Importing asset information from KICS for Networks
- Examples of asset field comparison during import
- Settings of the kuma-ptvm-config.yaml configuration file
- Assigning a category to an asset
- Editing the parameters of assets
- Archiving assets
- Deleting assets
- Bulk deletion of assets
- Updating third-party applications and fixing vulnerabilities on Open Single Management Platform assets
- Moving assets to a selected administration group
- Asset audit
- Custom asset fields
- Critical information infrastructure assets
- Integration with other solutions
- Integration with Open Single Management Platform
- Configuring Open Single Management Platform integration settings
- Adding a tenant to the list for Open Single Management Platform integration
- Creating Open Single Management Platform connection
- Editing Open Single Management Platform connection
- Deleting Open Single Management Platform connection
- Importing events from the Open Single Management Platform database
- Kaspersky Endpoint Detection and Response integration
- Integration with Kaspersky CyberTrace
- Integration with Kaspersky Threat Intelligence Portal
- Connecting over LDAP
- Enabling and disabling LDAP integration
- Adding a tenant to the LDAP server integration list
- Creating an LDAP server connection
- Creating a copy of an LDAP server connection
- Changing an LDAP server connection
- Changing the data update frequency
- Changing the data storage period
- Starting account data update tasks
- Deleting an LDAP server connection
- Integration with the Security Orchestration Automation and Response Platform (SOAR)
- Integration with KICS/KATA
- Integration with Neurodat SIEM IM
- Kaspersky Automated Security Awareness Platform
- Sending notifications to Telegram
- UserGate integration
- Integration with Kaspersky Web Traffic Security
- Integration with Kaspersky Secure Mail Gateway
- Importing asset information from RedCheck
- Configuring receipt of Sendmail events
- Integration with Open Single Management Platform
- Managing KUMA
- Working with geographic data
- User guide
- KUMA resources
- Operations with resources
- Creating, renaming, moving, and deleting resource folders
- Creating, duplicating, moving, editing, and deleting resources
- Bulk deletion of resources
- Link correlators to a correlation rule
- Updating resources
- Exporting resources
- Importing resources
- Tag management
- Resource usage tracing
- Resource versioning
- Destinations
- Normalizers
- Aggregation rules
- Enrichment rules
- Data collection and analysis rules
- Correlation rules
- Filters
- Active lists
- Viewing the table of active lists
- Adding active list
- Viewing the settings of an active list
- Changing the settings of an active list
- Duplicating the settings of an active list
- Deleting an active list
- Viewing records in the active list
- Searching for records in the active list
- Adding a record to an active list
- Duplicating records in the active list
- Changing a record in the active list
- Deleting records from the active list
- Import data to an active list
- Exporting data from the active list
- Predefined active lists
- Dictionaries
- Response rules
- Connectors
- Viewing connector settings
- Adding a connector
- Connector settings
- Connector, internal type
- Connector, tcp type
- Connector, udp type
- Connector, netflow type
- Connector, sflow type
- Connector, nats-jetstream type
- Connector, kafka type
- Connector, http type
- Connector, sql type
- Connector, file type
- Connector, 1c-log type
- Connector, 1c-xml type
- Connector, diode type
- Connector, ftp type
- Connector, nfs type
- Connector, wmi type
- Connector, wec type
- Connector, etw type
- Connector, snmp type
- Connector, snmp-trap type
- Connector, kata/edr type
- Connector, vmware type
- Connector, elastic type
- Connector, office365 type
- Predefined connectors
- Secrets
- Context tables
- Viewing the list of context tables
- Adding a context table
- Viewing context table settings
- Editing context table settings
- Duplicating context table settings
- Deleting a context table
- Viewing context table records
- Searching context table records
- Adding a context table record
- Editing a context table record
- Deleting a context table record
- Importing data into a context table
- Exporting data from a context table
- Operations with resources
- Analytics
- KUMA resources
- Working with Open Single Management Platform
- Basic concepts
- Administration Server
- Hierarchy of Administration Servers
- Virtual Administration Server
- Web Server
- Network Agent
- Administration groups
- Managed device
- Unassigned device
- Administrator's workstation
- Management web plug-in
- Policies
- Policy profiles
- Tasks
- Task scope
- How local application settings relate to policies
- Distribution point
- Connection gateway
- Configuring Administration Server
- Configuring the connection of OSMP Console to Administration Server
- Configuring internet access settings
- Certificates for work with Open Single Management Platform
- About Open Single Management Platform certificates
- Requirements for custom certificates used in Open Single Management Platform
- Reissuing the certificate for OSMP Console
- Replacing certificate for OSMP Console
- Converting a PFX certificate to the PEM format
- Scenario: Specifying the custom Administration Server certificate
- Replacing the Administration Server certificate by using the klsetsrvcert utility
- Connecting Network Agents to Administration Server by using the klmover utility
- Hierarchy of Administration Servers
- Creating a hierarchy of Administration Servers: adding a secondary Administration Server
- Viewing the list of secondary Administration Servers
- Managing virtual Administration Servers
- Configuring Administration Server connection events logging
- Setting the maximum number of events in the event repository
- Changing DBMS credentials
- Backup copying and restoration of the Administration Server data
- Deleting a hierarchy of Administration Servers
- Access to public DNS servers
- Configuring the interface
- Encrypt communication with TLS
- Discovering networked devices
- Managing client devices
- Settings of a managed device
- Creating administration groups
- Device moving rules
- Adding devices to an administration group manually
- Moving devices or clusters to an administration group manually
- About clusters and server arrays
- Properties of a cluster or server array
- Adjustment of distribution points and connection gateways
- Standard configuration of distribution points: Single office
- Standard configuration of distribution points: Multiple small remote offices
- Calculating the number and configuration of distribution points
- Assigning distribution points automatically
- Assigning distribution points manually
- Modifying the list of distribution points for an administration group
- Enabling a push server
- About device statuses
- Configuring the switching of device statuses
- Device selections
- Device tags
- Device tags
- Creating a device tag
- Renaming a device tag
- Deleting a device tag
- Viewing devices to which a tag is assigned
- Viewing tags assigned to a device
- Tagging a device manually
- Removing an assigned tag from a device
- Viewing rules for tagging devices automatically
- Editing a rule for tagging devices automatically
- Creating a rule for tagging devices automatically
- Running rules for auto-tagging devices
- Deleting a rule for tagging devices automatically
- Data encryption and protection
- Changing the Administration Server for client devices
- Viewing and configuring the actions when devices show inactivity
- Deploying Kaspersky applications
- Scenario: Kaspersky applications deployment
- Protection deployment wizard
- Step 1. Starting Protection deployment wizard
- Step 2. Selecting the installation package
- Step 3. Selecting a method for distribution of key file or activation code
- Step 4. Selecting Network Agent version
- Step 5. Selecting devices
- Step 6. Specifying the remote installation task settings
- Step 7. Removing incompatible applications before installation
- Step 8. Moving devices to Managed devices
- Step 9. Selecting accounts to access devices
- Step 10. Starting installation
- Adding management plug-ins for Kaspersky applications
- Removing management web plug-ins
- Viewing the list of components integrated in Open Single Management Platform
- Viewing names, parameters, and custom actions of Kaspersky Next XDR Expert components
- Downloading and creating installation packages for Kaspersky applications
- Creating installation packages from a file
- Creating stand-alone installation packages
- Changing the limit on the size of custom installation package data
- Installing Network Agent for Linux in silent mode (with an answer file)
- Preparing a device running Astra Linux in the closed software environment mode for installation of Network Agent
- Viewing the list of stand-alone installation packages
- Distributing installation packages to secondary Administration Servers
- Preparing a Linux device and installing Network Agent on a Linux device remotely
- Installing applications using a remote installation task
- Specifying settings for remote installation on Unix devices
- Starting and stopping Kaspersky applications
- Replacing third-party security applications
- Removing applications or software updates remotely
- Preparing a device running SUSE Linux Enterprise Server 15 for installation of Network Agent
- Preparing a Windows device for remote installation
- Configuring Kaspersky applications
- Scenario: Configuring network protection
- About device-centric and user-centric security management approaches
- Policy setup and propagation: Device-centric approach
- Policy setup and propagation: User-centric approach
- Policies and policy profiles
- Network Agent policy settings
- Usage of Network Agent for Windows, Linux, and macOS: Comparison
- Comparison of Network Agent settings by operating systems
- Manual setup of the Kaspersky Endpoint Security policy
- Configuring Kaspersky Security Network
- Checking the list of the networks protected by Firewall
- Disabling the scan of network drives
- Excluding software details from the Administration Server memory
- Configuring access to the Kaspersky Endpoint Security for Windows interface on workstations
- Saving important policy events in the Administration Server database
- Manual setup of the group update task for Kaspersky Endpoint Security
- Kaspersky Security Network (KSN)
- Managing tasks
- About tasks
- About task scope
- Creating a task
- Starting a task manually
- Starting a task for selected devices
- Viewing the task list
- General task settings
- Exporting a task
- Importing a task
- Starting the Change tasks password wizard
- Viewing task run results stored on the Administration Server
- Manual setup of the group task for scanning a device with Kaspersky Endpoint Security
- General task settings
- Application tags
- Granting offline access to the external device blocked by Device Control
- Registering Kaspersky Industrial CyberSecurity for Networks application in OSMP Console
- Managing users and user roles
- About user accounts
- About user roles
- Configuring access rights to application features. Role-based access control
- Adding an account of an internal user
- Creating a security group
- Editing an account of an internal user
- Editing a security group
- Assigning a role to a user or a security group
- Adding user accounts to an internal security group
- Assigning a user as a device owner
- Two-step verification
- Scenario: Configuring two-step verification for all users
- About two-step verification for an account
- Enabling two-step verification for your own account
- Enabling required two-step verification for all users
- Disabling two-step verification for a user account
- Disabling required two-step verification for all users
- Excluding accounts from two-step verification
- Configuring two-step verification for your own account
- Prohibit new users from setting up two-step verification for themselves
- Generating a new secret key
- Editing the name of a security code issuer
- Changing the number of allowed password entry attempts
- Deleting a user or a security group
- Changing the password for a user account
- Creating a user role
- Editing a user role
- Editing the scope of a user role
- Deleting a user role
- Associating policy profiles with roles
- Updating Kaspersky databases and applications
- Scenario: Regular updating Kaspersky databases and applications
- About updating Kaspersky databases, software modules, and applications
- Creating the Download updates to the Administration Server repository task
- Viewing downloaded updates
- Verifying downloaded updates
- Creating the task for downloading updates to the repositories of distribution points
- Adding sources of updates for the Download updates to the Administration Server repository task
- Approving and declining software updates
- Automatic installation of updates for Kaspersky Endpoint Security for Windows
- About using diff files for updating Kaspersky databases and software modules
- Enabling the Downloading diff files feature
- Downloading updates by distribution points
- Updating Kaspersky databases and software modules on offline devices
- Remote diagnostics of client devices
- Opening the remote diagnostics window
- Enabling and disabling tracing for applications
- Downloading trace files of an application
- Deleting trace files
- Downloading application settings
- Downloading system information from a client device
- Downloading event logs
- Starting, stopping, restarting the application
- Running the remote diagnostics of Kaspersky Security Center Network Agent and downloading the results
- Running an application on a client device
- Generating a dump file for an application
- Running remote diagnostics on a Linux-based client device
- Managing third-party applications and executable files on client devices
- Using Application Control to manage executable files
- Application Control modes and categories
- Obtaining and viewing a list of applications installed on client devices
- Obtaining and viewing a list of executable files stored on client devices
- Creating an application category with content added manually
- Creating an application category that includes executable files from selected devices
- Creating an application category that includes executable files from selected folder
- Viewing the list of application categories
- Configuring Application Control in the Kaspersky Endpoint Security for Windows policy
- Adding event-related executable files to the application category
- About the license
- Basic concepts
- Monitoring, reporting, and audit
- Scenario: Monitoring and reporting
- About types of monitoring and reporting
- Triggering of rules in Smart Training mode
- Dashboard and widgets
- Reports
- Events and event selections
- About events in Open Single Management Platform
- Events of Open Single Management Platform components
- Using event selections
- Creating an event selection
- Editing an event selection
- Viewing a list of an event selection
- Exporting an event selection
- Importing an event selection
- Viewing details of an event
- Exporting events to a file
- Viewing an object history from an event
- Deleting events
- Deleting event selections
- Setting the storage term for an event
- Blocking frequent events
- Event processing and storage on the Administration Server
- Notifications and device statuses
- Kaspersky announcements
- Cloud Discovery
- Exporting events to SIEM systems
- Configuring event export to SIEM systems
- Before you begin
- About event export
- About configuring event export in a SIEM system
- Marking of events for export to SIEM systems in Syslog format
- About exporting events using Syslog format
- Configuring Open Single Management Platform for export of events to a SIEM system
- Exporting events directly from the database
- Viewing export results
- Managing object revisions
- Deletion of objects
- Downloading and deleting files from Quarantine and Backup
- Operation diagnostics of the Kaspersky Next XDR Expert components
- Multitenancy
- Contact Technical Support
- Known issues
- Appendices
- Commands for components manual starting and installing
- Integrity check of KUMA files
- Normalized event data model
- Configuring the data model of a normalized event from KATA EDR
- Asset data model
- User account data model
- KUMA audit events
- Event fields with general information
- User successfully signed in or failed to sign in
- User successfully logged out
- Changed the set of spaces to differentiate access to events
- Service was successfully created
- Service was successfully deleted
- Service was successfully started
- Service was successfully paired
- Service was successfully reloaded
- Service was successfully restarted
- Service status was changed
- Storage partition was deleted automatically due to expiration
- Storage partition was deleted by user
- Active list was successfully cleared or operation failed
- Active list item was successfully changed, or operation was unsuccessful
- Active list item was successfully deleted or operation was unsuccessful
- Active list was successfully imported or operation failed
- Active list was exported successfully
- Resource was successfully added
- Resource was successfully deleted
- Resource was successfully updated
- Asset was successfully created
- Asset was successfully deleted
- Asset category was successfully added
- Asset category was deleted successfully
- Settings were updated successfully
- Updated data retention policy after changing drives
- The dictionary was successfully updated on the service or operation was unsuccessful
- Request sent to KIRA
- Response in Active Directory
- Response via KICS for Networks
- Kaspersky Automated Security Awareness Platform response
- KEDR response
- Correlation rules
- Time format
- Mapping fields of predefined normalizers
- Glossary
- Administrator host
- Agent
- Alert
- Asset
- Bootstrap
- Collector
- Configuration file
- Context
- Correlation rule
- Correlator
- Custom actions
- Distribution package
- Event
- Incident
- Investigation graph
- Kaspersky Deployment Toolkit
- Kubernetes cluster
- KUMA inventory file
- KUMA services
- Multitenancy
- Network Agent
- Node
- Normalized event
- Observables
- Playbook
- Playbook algorithm
- Registry
- Response actions
- Segmentation rules
- Storage
- Target hosts
- Tenant
- Threat development chain
- Transport archive
- Information about third-party code
- Trademark notices
Kaspersky Next XDR Expert
Kaspersky Next XDR Expert is a complex solution for the cybersecurity of your business, and it includes Kaspersky applications aimed to protect your devices and infrastructure from cybersecurity risks, and to track and respond to most cyberthreats. The Kaspersky Next XDR Expert components are deployed on a single platform called Kaspersky Single Management Platform. The platform provides you with a single user interface for cross-application scenarios, and enables you to integrate both Kaspersky and third-party applications into a unified protection system.
One of the key components of the solution is a SIEM system that allows you to track the events from all components and to perform mutual correlation of the events by using both preset and custom rules. By analyzing logs and telemetry data from the organization's infrastructure, Kaspersky Next XDR Expert automatically detects attacks and allows you to investigate incidents by using a unified investigation graph that combines all events received by Kaspersky Next XDR Expert, from both Kaspersky and third-party applications.
To respond to complex incidents, Kaspersky Next XDR Expert uses both predefined and custom playbooks. Also, the response options include the response actions from third-party applications and complex response actions implemented through several applications.
The solution comprises basic protection of endpoint devices that allows you to block attacks on the endpoint device infrastructure, including both physical and virtual devices. Moreover, the Kaspersky Next XDR Expert components provide specialized protection of mail servers and incoming and outgoing email messages against harmful objects, spam, and phishing.
With Kaspersky Next XDR Expert, you can perform centralized deployment of Kaspersky security applications on the infrastructure devices, run the virus scan tasks and the update tasks remotely, as well as configure the security policies of the managed applications. The monitoring dashboard displays the current protection system state, detailed reports, and policy parameters.
Kaspersky Next XDR Expert components
|
|
||
|
|
||
|
|
||
|
|
||
|
|


Quick links
New features
Key features
- Managing alerts and security incidents
- Threat hunting tools
- Investigation graph
- Predefined and custom playbooks
- Manual threat response actions
- Dashboard and widgets
Compatibility and hardware and software requirements
- Hardware and software requirements
- Compatible applications and solutions
- Integration with other solutions and third-party systems
Getting started
- Walk-through scenario of deployment, activation and initial configuration of Kaspersky Next XDR Expert
- Deployment of Kaspersky Next XDR Expert
- Migration to Kaspersky Next XDR Expert
- Using the threat monitoring, detection and hunting capabilities
- Example of incident investigation with Kaspersky Next XDR Expert
Working with Open Single Management Platform
- Installing Kaspersky security applications on devices on a corporate network
- Remotely run scan and update tasks
- Managing the security policies of managed applications
What's new
Kaspersky Next XDR Expert 1.2
Kaspersky Next XDR Expert has several new features and improvements:
- An updated version of Bootstrap is used in the application. Before you install the new version of Kaspersky Next XDR Expert, update Bootstrap by running the following command:
./kdt apply -k <path_to_XDR_updates_archive> -i <path_to_configuration_file> --force-bootstrap - Kaspersky Next XDR Expert upgrade from version 1.1 to version 1.2.
- Optimized Kaspersky Next XDR Expert deployment: improved configuration file and Configuration wizard for a simplified specifying of the installation parameters.
- Deployment preliminary checks. Before you deploy Kaspersky Next XDR Expert, you can now check if the system requirements are met. Kaspersky Deployment Toolkit (KDT) checks your hardware, operating system, software, and network environment. If at least one requirement is not met, KDT interrupts the deployment and provides you a detailed report.
- Flexible incident workflow. You can configure an incident workflow and view it in the visual editor.
- You can now attach files to alerts or incidents. If necessary, you can remove or download the attached files.
- Customizable incident handling process by using incident types.
- When creating a playbook, you can configure the playbook algorithm to edit the incident properties or the alert properties.
- You can export information about all incidents displayed in the incident table to a JSON file. This may be required when you have to provide this information to third parties.
- AI-based asset scoring. A machine learning-based engine helps you evaluate the processes running on an asset, and define if a particular process is normal or if it is unusual and requires attention from a SOC analyst.
- Improved the configuration process of the templates for email notifications about events occurring in Kaspersky Next XDR Expert.
- You can reduce or increase the retention periods of alerts and incidents, depending on your needs. By default, the retention period of alerts and incidents is 360 days.
- Uninstallation of Kaspersky Next XDR Expert. All created data will also be removed.
- From a shortcut menu in the alert details window or incident details window, you can now open the Threat hunting page on a new browser tab.
- In the alert details window or incident details window, you can now search through affected assets and observables.
- Ability to configure alert aggregation rules through the REST API.
- When you open the Threat hunting page from the alert details window or incident details window, the search is now performed for the period between the first and the last event of the alert or incident, and not for the last 24 hours.
- Deployment preliminary checks. Before you deploy Kaspersky Next XDR Expert, you can now check if the system requirements are met. Kaspersky Deployment Toolkit (KDT) checks your hardware, operating system, software, and network environment. If at least one requirement is not met, KDT interrupts the deployment and provides you a detailed report.
- Open Single Management Platform can now be installed on the Nutanix AHV virtualization platform.
- OSMP Console optimization: the console windows, login page, and the Dashboard now load faster.
- You can now switch from the incident details window to the incident-related events on the Threat hunting page.
- Kaspersky Next XDR Expert now supports the following EPP-applications:
- Kaspersky Endpoint Security for Windows, versions 12.5, 12.6, 12.7
- Kaspersky Endpoint Security 12.1 for Linux
- Kaspersky Endpoint Security 12.1 for Mac
- Kaspersky Industrial CyberSecurity for Nodes 4.0
- Kaspersky Endpoint Agent 4.0
- Kaspersky Next XDR Expert is now compatible with Kaspersky Anti Targeted Attack Platform 7.0.
- You can now refresh the information in the alert details window and the incident details window by clicking the refresh icon.
Kaspersky Next XDR Expert 1.1
Kaspersky Next XDR Expert has several new features and improvements:
- An updated version of Bootstrap is used in the application. Before you install the new version of Kaspersky Next XDR Expert, update Bootstrap by running the following command:
./kdt apply -k <path_to_XDR_updates_archive> -i <path_to_configuration_file> --force-bootstrap - New design of the user interface.
- Reduced hardware and software requirements.
- Increased application stability.
- A new deployment wizard for the simplified configuration of the installation parameters.
- Addition of predefined playbooks.
- Kaspersky Next XDR Expert now supports the following EPP-applications:
- Kaspersky Endpoint Security 12.0 for Mac
- Kaspersky Industrial CyberSecurity for Nodes 3.2
- Kaspersky Endpoint Agent 3.16
- New Dashboard widgets for monitoring responses performed through playbooks.
- Migration from Kaspersky Security Center to Kaspersky Next XDR Expert, including migration of users and tenants, and the binding of tenants to Administration Servers of Kaspersky Security Center.
- Kaspersky Next XDR Expert is now compatible with Kaspersky Anti Targeted Attack Platform 6.0.
- New features and improvements introduced in the August 2024 update of Kaspersky Unified Monitoring and Analysis Platform.
About Kaspersky Next XDR Expert
Kaspersky Next XDR Expert (XDR) is a robust cybersecurity solution that defends your corporate IT infrastructure against sophisticated cyberthreats, including those that cannot be detected by EPP applications installed on corporate assets. It provides full visibility, correlation, and automation; and leverages a diverse range of response tools and data sources, including endpoint assets, and network and cloud data. To protect your IT infrastructure effectively, Kaspersky Next XDR Expert analyzes the data from these sources to identify threats, create alerts for potential incidents, and provide the tools to respond to them. Kaspersky XDR is backed by advanced analytics capabilities and a strong track record of security expertise.
This solution provides a unified detection and response process through integrated components and holistic scenarios in a single interface to improve the efficiency of security professionals.
The detection tools include:
- Threat hunting tools to proactively search for threats and vulnerabilities by analyzing events.
- Advanced threat detection and cross-correlation: real-time correlation of events from different sources, more than 350 correlation rules out-of-the-box for different scenarios with MITRE ATT&CK matrix mapping, ability to create new rules and customize existing ones, and retrospective scans for detecting zero-day vulnerabilities.
- An investigation graph to visualize and facilitate an incident investigation and identify the root causes of the alert.
- Use of Kaspersky Threat Intelligence Portal to get the latest detailed threat intelligence, for example, about web addresses, domains, IP addresses, file hashes, statistical and behavioral data, and WHOIS and DNS data.
The response tools include:
- Manual response actions: asset isolation, run commands, create prevention rules, launch tasks on an asset, Kaspersky Threat Intelligence Portal reputation enrichment, and training assignments for users.
- Playbooks, both predefined and user-created, to automate typical response operations.
- Third-party application response actions and cross-application response scenarios.
Kaspersky Next XDR Expert also takes advantage of the Open Single Management Platform component for asset management and the centralized run of security administration and maintenance tasks:
- Deploying Kaspersky applications on the assets in the corporate network.
- Remotely launching scan and update tasks.
- Obtaining detailed information about asset protection.
- Configuring all the security components by using Kaspersky applications.
Kaspersky Next XDR Expert supports the hierarchy of tenants.
Kaspersky Next XDR Expert is integrated with Active Directory, includes APIs, and supports a wide range of integrations both with Kaspersky applications and third-party solutions for data obtaining and responding. For information about the applications and solutions that XDR supports, see the Compatible Kaspersky applications and Integration with other solutions sections.
Updates functionality (including providing anti-virus signature updates and codebase updates), as well as KSN functionality may not be available in the software in the U.S.
Hardware and software requirements
This article describes hardware requirements of single-node deployment scheme and multi-node deployment scheme, software requirements of Open Single Management Platform, hardware and software requirements of Kaspersky Deployment Toolkit and OSMP components.
Common requirements and considerations
100% vCPU allocation is required if you use virtualization.
For networks that exceed 40,000 devices, use secondary Administration Servers.
Make sure that the DNS server is available on the network.
Single-node deployment cannot be upgraded to multi-node deployment. Multi-node installation should be preferred If network growth is expected.
Effective device and EPS calculation
Hardware requirements may vary depending on the operating system running on endpoint devices. Use the following formula to estimate effective devices in your network:
<number of devices> = <Windows endpoints> + 3* <Linux and macOS endpoints> + 20 * <servers>
An effective device is expected to contribute 0.5 EPS (events per second) with default settings. Total EPS is calculated using the following formula:
<total EPS> = <EPS from effective devices> + <third-party EPS>
You can convert total EPS to effective devices using the following formula:
<total effective devices> = <total EPS> / 0.5
Single-node deployment: hardware requirements
Single-node deployment requires less resources (see the table below), but the following considerations should be taken into account:
- Single-node scheme only supports up to 10,000 devices in the network.
- The database is located on the primary worker node outside the cluster.
In case of single-node deployment, it is strongly recommended that you first install the DBMS manually on the host that will act as a primary node. After that, you can deploy Kaspersky Next XDR Expert on the same host.
- Additional nodes are required for KATA/KEDR.
- To deploy the solution correctly, ensure that CPU of the target host supports the BMI, AVX, and SSE 4.2 instruction set.
Minimum hardware requirements
Hardware requirements for a single-node deployment scheme
Solution
250 devices
1000 devices
3000 devices
5000 devices
10,000 devices
A solution that includes the following applications:
- Open Single Management Platform
- Kaspersky Unified Monitoring and Analysis Platform
- Kaspersky Anti-Targeted Attack Platform / Kaspersky Endpoint Detection and Response Central Node
Note: The requirements do not take into account hosts for KEDR services.
1 XDR primary node:
- CPU: 6 cores, operating frequency of 2.5 GHz
- RAM: 27 GB
- Available disk space: 360 GB
1 KUMA services node:
- CPU: 10 cores
- RAM: 16 GB
- Disk space: 500 GB
1 XDR primary worker node:
- CPU: 8 cores, operating frequency of 2.5 GHz
- RAM: 32 GB
- Available disk space: 400 GB
1 KUMA services node:
- CPU: 10 cores
- RAM: 16 GB
- Disk space: 600 GB
1 XDR primary worker node:
- CPU: 11 cores, operating frequency of 2.5 GHz
- RAM: 38 GB
- Available disk space: 600 GB
1 KUMA services node:
- CPU: 10 cores
- RAM: 16 GB
- Disk space: 1000 GB
1 XDR primary worker node:
- CPU: 15 cores, operating frequency of 2.5 GHz
- RAM: 46 GB
- Available disk space: 740 GB
1 KUMA services node:
- CPU: 10 cores
- RAM: 16 GB
- Disk space: 1400 GB
1 XDR primary worker node:
- CPU: 18 cores, operating frequency of 2.5 GHz
- RAM: 57 GB
- Available disk space: 1500 GB
1 KUMA services node:
- CPU: 10 cores
- RAM: 16 GB
- Disk space: 2400 GB
Multi-node deployment: hardware requirements
Multi-node deployment requires more resources (see the table below). For this scheme, the following considerations should be taken into account:
- Multi-node cluster scheme is recommended for networks that exceed 10,000 devices.
- The database is located on a separate host outside the cluster.
- To deploy the solution correctly, ensure that CPUs of target hosts support the BMI/AVX instruction set.
Minimum hardware requirements
Hardware requirements for a multi-node deployment scheme
Solution
20,000 devices
30,000 devices
50,000 devices
A solution that includes the following applications:
- Open Single Management Platform
- Kaspersky Unified Monitoring and Analysis Platform
- Kaspersky Anti-Targeted Attack Platform / Kaspersky Endpoint Detection and Response Central Node
Note: The requirements do not take into account hosts for KEDR services.
12 nodes:
- 1 XDR primary node
- 3 XDR worker nodes
- 1 XDR database node
- 1 KUMA collector
- 1 KUMA correlator
- 3 KUMA keeper
- 2 KUMA storage
12 nodes:
- 1 XDR primary node
- 3 XDR worker nodes
- 1 XDR database node
- 1 KUMA collector
- 1 KUMA correlator
- 3 KUMA keeper
- 2 KUMA storage
12 nodes:
- 1 XDR primary node
- 3 XDR worker nodes
- 1 XDR database node
- 1 KUMA collector
- 1 KUMA correlator
- 3 KUMA keeper
- 2 KUMA storage
1 XDR primary node:
- CPU: 4 cores
- RAM: 8 GB
- Available disk space: 500 GB
3 XDR worker nodes:
- CPU: 8 cores
- RAM: 20 GB
- Available disk space: 1 TB
1 XDR database node:
- CPU: 10 cores
- RAM: 21 GB
- Available disk space: 1.6 TB
1 KUMA collector node:
- CPU: 8 cores
- RAM: 16 GB
- Available disk space: 500 GB
1 KUMA corellator node:
- CPU: 8 cores
- RAM: 32 GB
- Available disk space: 500 GB
3 KUMA keeper nodes:
- CPU: 6 cores
- RAM: 12 GB
- Available disk space: 150 GB
2 KUMA storage nodes:
- CPU: 24 cores
- RAM: 64 GB
- Available SSD disk space: 4.7 TB
1 XDR primary node:
- CPU: 4 cores
- RAM: 8 GB
- Available disk space: 500 GB
3 XDR worker nodes:
- CPU: 10 cores
- RAM: 24 GB
- Available disk space: 1 TB
1 XDR database node:
- CPU: 12 cores
- RAM: 24 GB
- Available disk space: 2.7 TB
1 KUMA collector node:
- CPU: 8 cores
- RAM: 16 GB
- Available disk space: 500 GB
1 KUMA corellator node:
- CPU: 8 cores
- RAM: 32 GB
- Available disk space: 500 GB
3 KUMA keeper nodes:
- CPU: 6 cores
- RAM: 12 GB
- Available disk space: 150 GB
2 KUMA storage nodes:
- CPU: 24 cores
- RAM: 64 GB
- Available SSD disk space: 7 TB
1 XDR primary node:
- CPU: 4 cores
- RAM: 8 GB
- Available disk space: 500 GB
3 XDR worker nodes:
- CPU: 12 cores
- RAM: 28 GB
- Available disk space: 1 TB
1 XDR database node:
- CPU: 16 cores
- RAM: 32 GB
- Available disk space: 4.3 TB
1 KUMA collector node:
- CPU: 8 cores
- RAM: 16 GB
- Available disk space: 500 GB
1 KUMA corellator node:
- CPU: 8 cores
- RAM: 32 GB
- Available disk space: 500 GB
3 KUMA keeper nodes:
- CPU: 6 cores
- RAM: 12 GB
- Available disk space: 150 GB
2 KUMA storage nodes:
CPU: 24 cores
RAM: 64 GB
Available SSD disk space: 12 TB
Open Single Management Platform: Software requirements
Software requirements and supported systems and platforms
Operating system |
64-bit versions of the following operating systems are supported: Astra Linux Special Edition RUSB.10015-01 (2023-0426SE17 update 1.7.4) Ubuntu Server 22.04 LTS Debian GNU/Linux 11.х (Bullseye) On the target hosts with the Ubuntu family operating systems, the Linux kernel version must be 5.15.0.107 or later. |
Virtualization platforms |
VMWare vSphere 7 VMWare vSphere 8 Microsoft Hyper-V Server 2016 Microsoft Hyper-V Server 2019 Microsoft Hyper-V Server 2022 Kernel-based Virtual Machine Proxmox Virtual Environment 7.2 Proxmox Virtual Environment 7.3 Nutanix AHV 20220304.242 and later |
Database management system (DBMS) |
PostgreSQL 13.х 64-bit PostgreSQL 14.х 64-bit PostgreSQL 15.х 64-bit PostgreSQL 16.x 64-bit Postgres Pro 13.х 64-bit (all editions) Postgres Pro 14.х 64-bit (all editions) Postgres Pro 15.х 64-bit (all editions) Postgres Pro 16.x 64-bit (all editions) |
File system on the cluster nodes (controller and workers) |
ext4 XFS |
Highly available PostgreSQL clusters are supported. The Postgres role used by the Server to access the DBMS needs to have privileges to read the following views (enabled by default):
- pg_stat_replication
- pg_stat_wal_receiver
Kaspersky Deployment Toolkit
All Open Single Management Platform components are installed by using Kaspersky Deployment Toolkit.
Kaspersky Deployment Toolkit has the following hardware and software requirements:
Specification |
System requirements |
Hardware |
CPU: 4 cores, operating frequency of 2.5 GHz RAM: 8 GB Available disk space: 40 GB |
Operating system |
64-bit versions of the following operating systems are supported:
|
Open Single Management Platform components
To view the hardware and software requirements for an Open Single Management Platform component, click its name:
- OSMP Console
- Kaspersky Unified Monitoring and Analysis Platform (hereinafter KUMA)
- Secondary Kaspersky Security Center Administration Servers
- Kaspersky Security Center Network Agent
- Kaspersky Endpoint Security for Windows
- Kaspersky Anti Targeted Attack Platform (hereinafter KATA)
- Kaspersky Industrial CyberSecurity for Networks
- Kaspersky Industrial CyberSecurity for Nodes
- Kaspersky CyberTrace
- Kaspersky Threat Intelligence Portal
- Kaspersky Automated Security Awareness Platform (hereinafter KASAP)
Requirements for hosts with KUMA services
The KUMA services (collectors, correlators, and storages) are installed on the hosts that are outside of the Kubernetes cluster. Hardware and software requirements for these hosts are described in this article.
Recommended hardware and software requirements
This section lists the hardware and software requirements for processing a data stream of up to 40,000 events per second (EPS). The KUMA load value depends on the type of events being parsed and the efficiency of the normalizer.
For event processing efficiency, the CPU core count is more important than the clock rate. For example, 8 CPU cores with a medium clock rate can process events more efficiently than 4 CPU cores with a high clock rate. The table below lists the hardware and software requirements of KUMA components.
The amount of RAM utilized by the collector depends on configured enrichment methods (DNS, accounts, assets, enrichment with data from Kaspersky CyberTrace) and whether aggregation is used. RAM consumption is influenced by the data aggregation window setting, the number of fields used for aggregation of data, volume of data in fields being aggregated.
For example, with an event stream of 1000 EPS and event enrichment disabled (event enrichment is disabled, event aggregation is disabled, 5000 accounts, 5000 assets per tenant), one collector requires the following resources:
- 1 CPU core or 1 virtual CPU
- 512 MB of RAM
- 1 GB of disk space (not counting event cache)
For example, to support 5 collectors that do not perform event enrichment, you must allocate the following resources: 5 CPU cores, 2.5 GB of RAM, and 5 GB of free disk space.
Recommended hardware and software requirements for installation of the KUMA services
|
Collector |
Correlator |
Storage |
|---|---|---|---|
CPU |
Intel or AMD with SSE 4.2 support: at least 4 cores/8 threads or 8 virtual CPUs. |
Intel or AMD with SSE 4.2 support: at least 4 cores/8 threads or 8 virtual CPUs. |
Intel or AMD with SSE 4.2 support: at least 12 cores/24 threads or 24 virtual CPUs. |
RAM |
16 GB |
16 GB |
48 GB |
Free disk space |
/opt directory size: at least 500 GB. |
/opt directory size: at least 500 GB. |
/opt directory size: at least 500 GB. |
Operating systems |
|
||
Network bandwidth |
100 Mbps |
100 Mbps |
The transfer rate between ClickHouse nodes must be at least 10 Gbps if the data stream exceeds 20,000 EPS. |
Installation of KUMA is supported in the following virtual environments:
- VMware 6.5 or later
- Hyper-V for Windows Server 2012 R2 or later
- QEMU-KVM 4.2 or later
- Software package of virtualization tools "Brest" RDTSP.10001-02
Kaspersky recommendations for storage servers
For storage servers Kaspersky specialists recommend the following:
- Put ClickHouse on solid state drives (SSD). SSDs help improve data access speed. Hard drives can be used to store data using the HDFS technology.
- To connect a data storage system to storage servers, use high-speed protocols, such as Fibre Channel or iSCSI 10G. We do not recommend using application-level protocols such as NFS and SMB to connect data storage systems.
- Use the ext4 file system on ClickHouse cluster servers.
- If you are using RAID arrays, use RAID 0 for high performance, or RAID 10 for high performance and fault tolerance.
- To ensure fault tolerance and performance of the data storage subsystem, make sure that ClickHouse nodes are deployed strictly on different disk arrays.
- If you are using a virtualized infrastructure to host system components, deploy ClickHouse cluster nodes on different hypervisors. In this case, it is necessary to prevent two virtual machines with ClickHouse from working on the same hypervisor.
- For high-load KUMA installations, install ClickHouse on physical servers.
Requirements for devices for installing agents
To have data sent to the KUMA collector, you must install agents on the network infrastructure devices. Hardware and software requirements are listed in the table below.
Recommended hardware and software requirements for installation of agents
|
Windows devices |
Linux devices |
|---|---|---|
CPU |
Single-core, 1.4 GHz or higher |
Single-core, 1.4 GHz or higher |
RAM |
512 MB |
512 MB |
Free disk space |
1 GB |
1 GB |
Operating systems |
|
|
Requirements for the operating system
Requirements for the operating system are listed in the table below.
Installation requirements for the operating system
|
Astra Linux |
Python version |
3.6 or later |
SELinux module |
Disabled |
Package manager |
pip3 |
Basic packages |
The packages can be installed using the following command:
|
Dependent packages |
The packages can be installed by using the following command:
If you are planning to query Oracle DB databases from KUMA, you must install the libaio1 Astra Linux package. |
User permissions level required to install the application |
To assign the required permissions to the user account used for installing the application, run the following command:
|
OSMP Console requirements
OSMP Console Server
For hardware and software requirements, refer to the requirements for a worker node.
Client devices
For a client device, use of OSMP Console requires only a browser.
The minimum screen resolution is 1366x768 pixels.
The hardware and software requirements for the device are identical to the requirements of the browser that is used with OSMP Console.
Browsers:
- Google Chrome 100.0.4896.88 or later (official build)
- Microsoft Edge 100 or later
- Safari 15 on macOS
- "Yandex" Browser 23.5.0.2271 or later
- Mozilla Firefox Extended Support Release 102.0 or later
Network Agent requirements
Minimum hardware requirements:
- CPU with operating frequency of 1 GHz or higher. For a 64-bit operating system, the minimum CPU frequency is 1.4 GHz.
- RAM: 512 MB.
- Available disk space: 1 GB.
Software requirement for Linux-based devices: the Perl language interpreter version 5.10 or higher must be installed.
Network Agent. Supported platforms
Operating systems. Microsoft Windows workstations |
Microsoft Windows Embedded POSReady 2009 with latest Service Pack 32-bit Microsoft Windows Embedded 7 Standard with Service Pack 1 32-bit/64-bit Microsoft Windows Embedded 8.1 Industry Pro 32-bit/64-bit Microsoft Windows 10 Enterprise 2015 LTSB 32-bit/64-bit Microsoft Windows 10 Enterprise 2016 LTSB 32-bit/64-bit Microsoft Windows 10 IoT Enterprise 2015 LTSB 32-bit/64-bit Microsoft Windows 10 IoT Enterprise 2016 LTSB 32-bit/64-bit Microsoft Windows 10 Enterprise 2019 LTSC 32-bit/64-bit Microsoft Windows 10 IoT Enterprise version 1703, 1709, 1803, 1809 32-bit/64-bit Microsoft Windows 10 20H2, 21H2 IoT Enterprise 32-bit/64-bit Microsoft Windows 10 IoT Enterprise 32-bit/64-bit Microsoft Windows 10 IoT Enterprise version 1909 32-bit/64-bit Microsoft Windows 10 IoT Enterprise LTSC 2021 32-bit/64-bit Microsoft Windows 10 IoT Enterprise version 1607 32-bit/64-bit Microsoft Windows 10 TH1 (July 2015) Home/Pro/Pro for Workstations/Enterprise/Education 32-bit/64-bit Microsoft Windows 10 TH2 (November 2015) Home/Pro/Pro for Workstations/Enterprise/Education 32-bit/64-bit Microsoft Windows 10 RS1 (August 2016) Home/Pro/Pro for Workstations/Enterprise/Education 32-bit/64-bit Microsoft Windows 10 RS2 (April 2017) Home/Pro/Pro for Workstations/Enterprise/Education 32-bit/64-bit Microsoft Windows 10 RS3 (Fall Creators Update, v1709) Home/Pro/Pro for Workstations/Enterprise/Education 32-bit/64-bit Microsoft Windows 10 RS4 (April 2018 Update, 17134) Home/Pro/Pro for Workstations/Enterprise/Education 32-bit/64-bit Microsoft Windows 10 RS5 (October 2018) Home/Pro/Pro for Workstations/Enterprise/Education 32-bit/64-bit Microsoft Windows 10 RS6 (May 2019) Home/Pro/Pro for Workstations/Enterprise/Education 64-bit Microsoft Windows 10 19H1, 19H2 Home/Pro/Pro for Workstations/Enterprise/Education 32-bit/64-bit Microsoft Windows 10 20H1 (May 2020 Update) Home/Pro/Pro for Workstations/Enterprise/Education 32-bit/64-bit Microsoft Windows 10 20H2 (October 2020 Update) Home/Pro/Pro for Workstations/Enterprise/Education 32-bit/64-bit Microsoft Windows 10 21H1 (May 2021 Update) Home/Pro/Pro for Workstations/Enterprise/Education 32-bit/64-bit Microsoft Windows 10 21H2 (October 2021 Update) Home/Pro/Pro for Workstations/Enterprise/Education 32-bit/64-bit Microsoft Windows 10 22H2 (October 2023 Update) Home/Pro/Pro for Workstations/Enterprise/Education 32-bit/64-bit Microsoft Windows 11 Home/Pro/Pro for Workstations/Enterprise/Education 64-bit Microsoft Windows 11 22H2 Home/Pro/Pro for Workstations/Enterprise/Education 64-bit Microsoft Windows 11 23H2 Home/Pro/Pro for Workstations/Enterprise/Education 64-bit Microsoft Windows 11 24H2 Home/Pro/Pro for Workstations/Enterprise/Education 64-bit Microsoft Windows 8.1 Pro/Enterprise 32-bit/64-bit Microsoft Windows 8 Pro/Enterprise 32-bit/64-bit Microsoft Windows 7 Professional/Enterprise/Ultimate/Home Basic/Premium with Service Pack 1 and later 32-bit/64-bit Microsoft Windows XP Professional with Service Pack 2 32-bit/64-bit (supported by Network Agent version 10.5.1781 only) Microsoft Windows XP Professional with Service Pack 3 and later 32-bit (supported by Network Agent version 14.0.0.20023) Microsoft Windows XP Professional for Embedded Systems with Service Pack 3 32-bit (supported by Network Agent version 14.0.0.20023) |
Operating systems. Microsoft Windows servers |
Microsoft Windows MultiPoint Server 2011 Standard/Premium 64-bit Microsoft Windows Server 2003 SP1 32-bit/64-bit (supported only by Network Agent version 10.5.1781, that you can request through Technical Support) Microsoft Windows Server 2008 Foundation with Service Pack 2 32-bit/64-bit Microsoft Windows Server 2008 Standard/Enterprise/Datacenter with Service Pack 2 32-bit/64-bit Microsoft Windows Server 2008 R2 Datacenter/Enterprise/Foundation/Standard with Service Pack 1 and later 64-bit Microsoft Windows Server 2012 Server Core/Datacenter/Essentials/Foundation/Standard 64-bit Microsoft Windows Server 2012 R2 Server Core/Datacenter/Essentials/Foundation/Standard 64-bit Microsoft Windows Server 2016 Datacenter/Standard/Server Core (Installation Option) (LTSB) 64-bit Microsoft Windows Server 2019 Standard/Datacenter/Core 64-bit Microsoft Windows Server 2019 RS5 Essentials/Standard 64-bit Microsoft Windows Server 2022 Standard/Datacenter/Core 64-bit Microsoft Windows Server 2022 21H2 Standard/Datacenter 64-bit Microsoft Windows Storage Server 2019 64-bit Microsoft Windows Small Business Server 2011 Standard 64-bit Microsoft Windows Small Business Server 2011 Essentials 64-bit Microsoft Windows Small Business Server 2011 Premium Add-on 64-bit |
Operating systems. Linux |
Debian GNU/Linux 10.х (Buster) 32-bit/64-bit Debian GNU/Linux 11.х (Bullseye) 32-bit/64-bit Debian GNU/Linux 12 (Bookworm) 32-bit/64-bit Ubuntu Server 10.04 LTS (Lucid Lynx) 32-bit/64-bit Ubuntu Server 16.04 LTS (Xenial Xerus) 32-bit/64-bit Ubuntu Server 18.04 LTS (Bionic Beaver) 64-bit Ubuntu Server 20.04 LTS (Focal Fossa) 64-bit Ubuntu Server 22.04 LTS (Jammy Jellyfish) 64-bit Ubuntu Server 22.04 LTS ARM 64-bit Ubuntu Server 24.04 LTS (Noble Numbat) 64-bit Ubuntu Desktop 10.04 LTS (Lucid Lynx) 32-bit/64-bit Ubuntu Desktop 16.04 LTS (Xenial Xerus) 32-bit/64-bit CentOS 6.х 32-bit/64-bit CentOS 7.2 and later 64-bit CentOS Stream 8 64-bit CentOS Stream 9 64-bit CentOS Stream 9 ARM 64-bit Red Hat Enterprise Linux Server 6.x 32-bit/64-bit Red Hat Enterprise Linux Server 7.2 and later 64-bit Red Hat Enterprise Linux Server 8.x 64-bit Red Hat Enterprise Linux Server 9.x 64-bit SUSE Linux Enterprise Server 12.5 and later (all Service Packs) 64-bit SUSE Linux Enterprise Server 15 (all Service Packs) 64-bit SUSE Linux Enterprise Server 15 (all Service Packs) ARM 64-bit openSUSE Leap 15 64-bit EulerOS 2.0 SP10 64-bit EulerOS 2.0 SP10 ARM 64-bit Astra Linux Special Edition RUSB.10015-01 (operational update 1.5) 64-bit Astra Linux Special Edition RUSB.10015-01 (operational update 1.6) 64-bit Astra Linux Special Edition RUSB.10015-16 (release 1) (operational update 1.6) 64-bit Astra Linux Special Edition RUSB.10015-17 (operational update 1.7.3) 64-bit Astra Linux Special Edition RUSB.10015-01 (operational update 1.7) 64-bit Astra Linux Special Edition RUSB.10015-01 (operational update 1.8) 64-bit Astra Linux Special Edition RUSB.10015-03 (operational update 7.6) 64-bit Astra Linux Special Edition RUSB.10015-37 (operational update 7.7) 64-bit Astra Linux Special Edition RUSB.10152-02 (operational update 4.7) ARM 64-bit Astra Linux Common Edition (operational update 2.12) 64-bit ALT Workstation 10.1 64-bit ALT Server 10.1 64-bit ALT Education 10.1 64-bit ALT SP Server 10 32-bit/64-bit ALT SP Server 10 ARM 64-bit ALT SP Workstation 10 32-bit/64-bit ALT SP Workstation 10 ARM 64-bit ALT 8 SP Server (LKNV.11100-01) 32-bit/64-bit ALT 8 SP Server (LKNV.11100-02) 32-bit/64-bit ALT 8 SP Server (LKNV.11100-03) 32-bit/64-bit ALT 8 SP Workstation (LKNV.11100-01) 32-bit/64-bit ALT 8 SP Workstation (LKNV.11100-02) 32-bit/64-bit ALT 8 SP Workstation (LKNV.11100-03) 32-bit/64-bit Mageia 4 32-bit Oracle Linux 7 64-bit Oracle Linux 8 64-bit Oracle Linux 9 64-bit Linux Mint 20.3 and later 64-bit Linux Mint 21.1 and later 64-bit Linux Mint 22.x 64-bit AlterOS 7.5 and later 64-bit GosLinux IC6/7.17 64-bit GosLinux IC6/7.2 64-bit SberOS 3.3.3 64-bit Platform V SberLinux OS Server (SLO) 8.8 64-bit Platform V SberLinux OS Server (SLO) 8.9.2 64-bit RED OS 7.3 ARM 64-bit RED OS 7.3 Server 64-bit RED OS 7.3 Certified Edition 64-bit RED OS 8 64-bit RED OS 8 ARM 64-bit ROSA Enterprise Linux Server 7.9 64-bit ROSA Enterprise Linux Desktop 7.9 64-bit ROSA COBALT 7.9 64-bit ROSA CHROME 12 64-bit AlmaLinux 8 and later 64-bit AlmaLinux 9 and later 64-bit Rocky Linux 8 and later 64-bit Rocky Linux 9 and later 64-bit Atlant, Alcyone build, version 2022.02 64-bit MSVSPHERE 9.2 SERVER 64-bit MSVSPHERE 9.2 ARM 64-bit MSVSPHERE 9.4 SERVER 64-bit MSVSPHERE 9.4 ARM 64-bit SynthesisM Server 8.6 64-bit SynthesisM Client 8.6 64-bit OSnova 2.* 64-bit Kylin 10 64-bit EMIAS 1.0 64-bit Amazon Linux 2 64-bit MosOS 15.4 Arbat 64-bit OS MES (Moscow Electronic School) 12 (for computers and laptops) 64-bit OS MES (Moscow Electronic School) 12 (for interactive panels) 64-bit M OS (Moscow Electronic School) 12 Server 64-bit Mostech 64-bit Mostech Server 64-bit Fedora Linux Server 40 64-bit Fedora Linux Workstation 40 64-bit |
Operating systems. macOS |
macOS 12.x macOS 13.x macOS 14.x macOS 15.x For Network Agent, the Apple Silicon (M1) architecture is also supported, as well as Intel. |
Virtualization platforms |
VMware vSphere 6.7.0 VMware vSphere 7.0.3 Citrix XenServer 7.x Citrix XenServer 8.2 Parallels Desktop 18 Oracle VM VirtualBox 7.0.12 Microsoft Hyper-V Server 2019 64-bit Microsoft Hyper-V Server 2022 64-bit Kernel-based Virtual Machine (all Linux operating systems supported by Network Agent) Refer to requirements for managed applications for other supported platforms. |
On the devices running Windows 10 version RS4 or RS5, Kaspersky Security Center might be unable to detect some vulnerabilities in folders where case sensitivity is enabled.
Before installing Network Agent on the devices running Windows 7, Windows Server 2008, Windows Server 2008 R2 or Windows MultiPoint Server 2011, make sure that you have installed the security update KB3063858 for OS Windows (Security Update for Windows 7 (KB3063858), Security Update for Windows 7 for x64-based Systems (KB3063858), Security Update for Windows Server 2008 (KB3063858), Security Update for Windows Server 2008 x64 Edition (KB3063858), Security Update for Windows Server 2008 R2 x64 Edition (KB3063858).
In Microsoft Windows XP, Network Agent might not perform some operations correctly.
You can install or update Network Agent for Windows XP in Microsoft Windows XP only. The supported editions of Microsoft Windows XP and their corresponding versions of the Network Agent are listed in the list of supported operating systems. You can download the required version of the Network Agent for Microsoft Windows XP from this page.
We recommend that you install the same version of the Network Agent for Linux as Open Single Management Platform.
Open Single Management Platform fully supports Network Agent of the same or newer versions.
Network Agent for macOS is provided together with Kaspersky security application for this operating system.
Page top
Requirements for a distribution point
Hardware and software requirements for Windows and Linux-based distribution points are described in this article.
If any remote installation tasks are pending on the Administration Server, the device with the distribution point will also require an amount of free disk space that is equal to the total size of the installation packages to be installed.
If one or multiple instances of the task for update (patch) installation and vulnerability fix are pending on the Administration Server, the device with the distribution point will also require additional free disk space, equal to twice the total size of all patches to be installed.
If you use the scheme where distribution points receive database updates and application software modules directly from Kaspersky update servers, the distribution points must be connected to the internet.
It is not recommended to assign the Administration Server as a distribution point, as this will increase the load on the Administration Server.
Hardware requirements for Windows-based distribution points
Minimum hardware requirements for Windows-based distribution points
Number of client devices |
CPU |
RAM |
RAM, with patch management enabled |
Disk space |
10,000 |
4 cores, 2500 MHz |
8 GB |
8 GB |
120 GB |
5000 |
4 cores, 2500 MHz |
6 GB |
8 GB |
120 GB |
1000 |
2 cores, 2500 MHz |
4 GB |
8 GB |
120 GB |
Hardware requirements for Linux-based distribution points
Minimum hardware requirements for Linux-based distribution points
Number of client devices |
CPU |
RAM |
Disk space |
10,000 |
4 cores, 2500 MHz |
10 GB |
120 GB |
5000 |
4 cores, 2500 MHz |
8 GB |
120 GB |
1000 |
2 cores, 2500 MHz |
6 GB |
120 GB |
Compatible applications and solutions
Kaspersky Next XDR Expert can be integrated with the following versions of applications and solutions:
- Kaspersky Security Center 15 Linux (as secondary Administration Servers)
- Kaspersky Security Center 14.2 Windows (as secondary Administration Servers)
- Kaspersky Anti Targeted Attack Platform 5.1
- Kaspersky Anti Targeted Attack Platform 6.0
- Kaspersky Anti Targeted Attack Platform 7.0
- Kaspersky Endpoint Security for Windows 12.3 or later (supports file servers)
- Kaspersky Endpoint Security for Linux 12.1 or later
- Kaspersky Endpoint Security for Windows 12.3 or later
- Kaspersky Endpoint Security for Mac 12.0 or later
- Kaspersky CyberTrace 4.2 (integration can only be configured in the KUMA Console)
- Kaspersky Industrial CyberSecurity for Nodes 3.2 or later
- Kaspersky Endpoint Agent 3.16
- Kaspersky Industrial CyberSecurity for Networks 4.0 (integration can only be configured in the KUMA Console)
- Kaspersky Secure Mail Gateway 2.0 or later (integration can only be configured in the KUMA Console)
- Kaspersky Security for Linux Mail Server 10 or later (integration can only be configured in the KUMA Console)
- Kaspersky Web Traffic Security 6.0 or later (integration can only be configured in the KUMA Console)
- UserGate 7
- Kaspersky Automated Security Awareness Platform
- Kaspersky Threat Intelligence Portal
- Kaspersky Next Generation Firewall (Kaspersky NGFW) Beta-2 (0.95)
Refer to the Application Support Lifecycle webpage for the versions of the applications.
Known issues
Open Single Management Platform supports management of Kaspersky Endpoint Security for Windows with the following limitations:
- The Adaptive Anomaly Control component is not supported. Open Single Management Platform does not support Adaptive Anomaly Control rules.
- Kaspersky Sandbox components are not supported.
Architecture of Open Single Management Platform
This section provides a description of the components of Open Single Management Platform and their interaction.
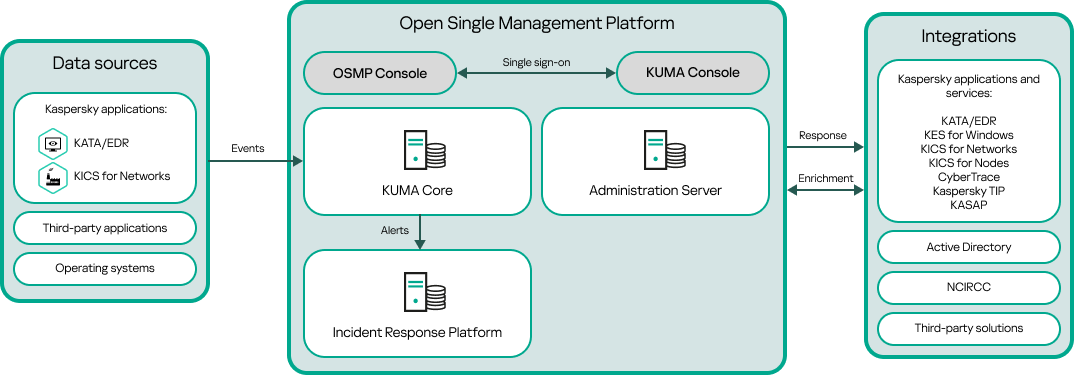
Open Single Management Platform architecture
Open Single Management Platform comprises the following main components:
- Open Single Management Platform (OSMP). The technology basis on which Kaspersky Next XDR Expert is built. OSMP integrates all of the solution components and provides interaction between the components. OSMP is scalable and supports integration with both Kaspersky applications and third-party solutions.
- OSMP Console. Provides a web interface for OSMP.
- KUMA Console. Provides a web interface for Kaspersky Unified Monitoring and Analysis Platform (KUMA).
- KUMA Core. The central component of KUMA. KUMA receives, processes, and stores information security events and then analyzes the events by using correlation rules. As a result of the analysis, if the conditions of a correlation rule are met, KUMA creates an alert and sends it to Incident Response Platform.
- Incident Response Platform. An Open Single Management Platform component that allows you to create incidents automatically or manually, manage alert and incident life cycle, assign alerts and incidents to SOC analysts, and respond to the incidents automatically or manually, including responses through playbooks.
- Administration Server (also referred to as Server). The key component of endpoint protection of a client organization. Administration Server provides centralized deployment and management of endpoint protection through EPP-applications, and allows you to monitor the endpoint protection status.
- Data sources. Information security hardware and software that generates the events. After you integrate Kaspersky Next XDR Expert with the required data sources, KUMA receives the events to store and analyze them.
- Integrations. Kaspersky applications and third-party solutions integrated with OSMP. Through integrated solutions, an SOC analyst can enrich the data required for incident investigation, and then respond to incidents.
OSMP Console interface
Kaspersky Next XDR Expert is managed through the OSMP Console and KUMA Console interfaces.
The OSMP Console window contains the following items:
- Main menu in the left part of the window
- Work area in the right part of the window
Main menu
The main menu contains the following sections:
- Administration Server. Displays the name of the Administration Server that you are currently connected to. Click the settings icon (
 ) to open the Administration Server properties.
 - Monitoring & Reporting. Provides an overview of your infrastructure, protection statuses, and statistics, including threat hunting, alerts and incidents, and playbooks.
- Assets (Devices). Contains tools for assets, as well as tasks and Kaspersky application policies.
- Users & Roles. Allows you to manage users and roles, configure user rights by assigning roles to the users, and associate policy profiles with roles.
- Operations. Contains a variety of operations, including application licensing, viewing and managing encrypted drives and encryption events, and third-party application management. This also provides you access to application repositories.
- Discovery & Deployment. Allows you to poll the network to discover client devices, and distribute the devices to administration groups manually or automatically. This section also contains the quick start wizard and Protection deployment wizard.
- Marketplace. Contains information about the entire range of Kaspersky business solutions and allows you to select the ones you need, and then proceed to purchase those solutions at the Kaspersky website.
- Settings. Contains settings to integrate Kaspersky Next XDR Expert with other Kaspersky applications, allows you to go to the KUMA Console, and create API tokens. It also contains settings related to displaying interface elements depending on features being used, as well as to interface language.
- Your account menu. Contains a link to Kaspersky Next XDR Expert Help. It also allows you to sign out of Kaspersky Next XDR Expert, and view the OSMP Console version and the list of installed management web plug-ins.
Work area
The work area displays the information you choose to view in the sections of the OSMP Console interface window. It also contains control elements that you can use to configure how the information is displayed.
Pinning and unpinning sections of the main menu
You can pin sections of OSMP Console to add them to favorites and access them quickly from the Pinned section in the main menu.
If there are no pinned elements, the Pinned section is not displayed in the main menu.
You can pin sections that display pages only. For example, if you go to Assets (Devices) → Managed devices, a page with the table of devices opens, which means you can pin the Managed devices section. If a window or no element is displayed after you select the section in the main menu, then you cannot pin such a section.
To pin a section:
- In the main menu, hover the mouse cursor over the section you want to pin.
The pin icon (
 ) is displayed.
 - Click the pin icon ().
The section is pinned and displayed in the Pinned section.
The maximum number of elements that you can pin is five.
You can also remove elements from favorites by unpinning them.
To unpin a section:
- In the main menu, go to the Pinned section.
- Hover the mouse cursor over the section you want to unpin, and then click the unpin icon (
 ).
).
The section is removed from favorites.
Page top
Changing the language of the OSMP Console interface
You can select the language of the OSMP Console interface.
To change the interface language:
- In the main menu, go to Settings → Language.
- Select one of the supported localization languages.
Licensing
This section covers the main aspects of Open Single Management Platform licensing.
About the End User License Agreement
The End User License Agreement (License Agreement) is a binding agreement between you and AO Kaspersky Lab stipulating the terms on which you may use the application.
Carefully read the License Agreement before you start using the application.
You can view the terms of the End User License Agreement by using the following methods:
- During installation of Open Single Management Platform.
- By reading the license.txt document. This document is included in the application distribution kit.
You accept the terms of the End User License Agreement by confirming that you agree with the End User License Agreement when installing the application. If you do not accept the terms of the License Agreement, cancel application installation and do not use the application.
Page top
About the license key
A license key is a sequence of bits that you can apply to activate and then use the application in accordance with the terms of the End User License Agreement. License keys are generated by Kaspersky specialists.
You can add a license key to the application using one of the following methods: by applying a key file or by entering an activation code. The license key is displayed in the application interface as a unique alphanumeric sequence after you add it to the application.
The license key may be blocked by Kaspersky in case the terms of the License Agreement have been violated. If the license key has been blocked, you need to add another one if you want to use the application.
A license key may be active or additional (or reserve).
An active license key is a license key that is currently used by the application. An active license key can be added for a trial or commercial license. The application cannot have more than one active license key.
An additional (or reserve) license key is a license key that entitles the user to use the application, but is not currently in use. The additional license key automatically becomes active when the license associated with the current active license key expires. An additional license key can be added only if an active license key has already been added.
A license key for a trial license can be added as an active license key. A license key for a trial license cannot be added as an additional license key.
Page top
About the activation code
An activation code is a unique sequence of 20 letters and numbers. You have to enter an activation code in order to add a license key for activating Open Single Management Platform. You receive the activation code at the email address that you provided when you bought Open Single Management Platform or requested the trial version of Open Single Management Platform.
To activate the application by using the activation code, you need internet access in order to connect to Kaspersky activation servers.
If you have lost your activation code after installing the application, contact the Kaspersky partner from whom you purchased the license.
Page top
About the key file
A key file is a file with the .key extension provided to you by Kaspersky. Key files are designed to activate the application by adding a license key.
You receive a key file at the email address that you provided when you bought Open Single Management Platform or ordered the trial version of Open Single Management Platform.
You do not need to connect to Kaspersky activation servers in order to activate the application with a key file.
You can restore a key file if it has been accidentally deleted. You may need a key file to register a Kaspersky CompanyAccount, for example.
To restore your key file, perform any of the following actions:
- Contact the license seller.
- Receive a key file through Kaspersky website by using your available activation code.
License limits
When you purchase a Kaspersky Next XDR Expert license, you determine the number of users you want to protect. You can exceed the license limit by no more than 5%. If you exceed the license limit by more than 5%, the extra devices and extra accounts are added to the Restricted assets list.
If the license limit is exceeded, a notification appears at the top of the OSMP Console.
It is not possible to launch response actions or playbooks for restricted assets.
To view the list of restricted assets:
- In the main menu, go to Settings → Tenants.
- In the Tenants section, click the Root tenant.
The Root tenant's properties window opens.
- Select the Licenses tab.
- Click the link with the number of restricted assets.
The Restricted assets window opens.
The list shows a maximum of 2000 restricted assets (the first 1000 devices and the first 1000 accounts).
Page top
Activating Kaspersky Next XDR Expert
After you install Kaspersky Next XDR Expert, you must activate the application in the Administration Server properties.
To activate Kaspersky Next XDR Expert:
- In the main menu, click the settings icon (
 ) next to the name of the root Administration Server.
The Administration Server properties window opens.
- On the General tab, select the License keys section.
- Under Current license, click the Select button.
- In the window that opens, select the license key that you want to use to activate Kaspersky Next XDR Expert. If the license key is not listed, click the Add new license key button, and then specify a new license key.
- If necessary, you can also add a . To do this, under Reserve license key, click the Select button, and then select an existing license key or add a new one. Note that you cannot add a reserve license key if there is no active license key.
- Click the Save button.

Viewing information about license keys in use
To view active and reserve license keys:
- In the main menu, go to Settings → Tenants.
- In the Tenants section, click the root tenant.
The root tenant's properties window opens.
- Select the Licenses tab.
The active and reserve license keys are displayed.
The displayed license key is applied to all child tenants of the root tenant. Specifying a separate license key for a child tenant is not available. The properties window for child tenants does not include the Licenses tab.
If the license keys limit is exceeded, a notification is shown, and the information about the license key shows a warning.
You can click the Go to Administration Server button to manage Kaspersky Next XDR Expert license keys.
On the Licenses tab, you can also view the list of licensed objects. To do this, click the ![]() button.
button.
The availability of the licensed object depends on the purchased license type.
Page top
Renewing licenses for Kaspersky applications
You can renew licenses for Kaspersky Next XDR Expert and included Kaspersky applications, such as Kaspersky Unified Monitoring and Analysis Platform, and Kaspersky Endpoint Detection and Response Expert. You can renew licenses that have expired or are going to expire within 30 days.
An email with an archive containing the new license keys will be sent to your email address after you purchase a new Kaspersky Next XDR Expert license.
To renew a license of Kaspersky Next XDR Expert:
- Extract the new license keys from the archive sent to your email address.
- Follow the steps described in Activating Kaspersky Next XDR Expert.
The license is renewed.
If you need to renew the licenses of the included Kaspersky applications, you must add new license keys to the web interfaces of these solutions.
For how to renew a license of Kaspersky Unified Monitoring and Analysis Platform, see the Adding a license key to the program web interface section of the Kaspersky Unified Monitoring and Analysis Platform Help.
For how to renew a license of Kaspersky Endpoint Detection and Response Expert, see the Adding a key section of the Kaspersky Anti Targeted Attack Platform Help.
In OSMP Console, the notifications are displayed when a license is about to expire, according to the following schedule:
- 30 days before the expiration
- 7 days before the expiration
- 3 days before the expiration
- 24 hours before the expiration
- When a license has expired
About data provision
Data processed locally
Kaspersky Next XDR Expert is designed to optimize threat detection, incident investigation, threat response (including automatic), and proactive threat hunting in real time.
Kaspersky Next XDR Expert performs the following main functions:
- Receiving, processing, and storing information security events.
- Analysis and correlation of incoming data.
- Incidents and alerts investigation, manual response.
- Automatic response by using the predefined and custom playbooks.
- Event-based threat hunting in real time.
To perform its main functions, Kaspersky Next XDR Expert can receive, store and process the following information:
- Information about the devices on which all Kaspersky Next XDR Expert components are installed:
- Technical specifications: device name, MAC address, operating system vendor, operating system build number, OS kernel version, required installed packages, account rights, service management tool type, and port status. This data is obtained by Kaspersky Deployment Toolkit during installation.
- Technical specifications: IPv4 address. This data is specified by the user in the Kaspersky Deployment Toolkit configuration file.
- Device access data: account names and SSH keys. This data is specified by the user in the Kaspersky Deployment Toolkit configuration file.
- Database access data: IP/DNS name, port, user name, and password. This data is specified by the user in the Kaspersky Deployment Toolkit configuration file.
- KUMA inventory file and license keys. This data is specified by the user in the Kaspersky Deployment Toolkit configuration file.
- DNS zone. This data is specified by the user in the Kaspersky Deployment Toolkit configuration file.
- Certificates for secure connection of devices to OSMP components. This data is specified by the user in the Kaspersky Deployment Toolkit configuration file.
Information is saved in the installation log, which is stored in the Kaspersky Deployment Toolkit database. The installation log of the initial infrastructure is saved to a file on the user's device. The storage period is indefinite; the installation log file will be deleted when Kaspersky Next XDR Expert is uninstalled. User names and passwords are stored in an encrypted form.
- Information about incident types: incident type name, description and other general information.
- Information about user accounts: full name and email address. The user enters data in the OSMP and KUMA Consoles. The data is stored in the database until the user deletes it.
- Integration token data.
- Information about tenants: tenant name, parent tenant name, description. The user enters data in the OSMP and KUMA Consoles. The data is stored in the database until the user deletes it.
- Alerts and incidents data:
- Alert data: triggered rules, compliance with the MITRE matrix, alert status, resolution, assigned operator, affected assets (devices and accounts), observables (IP, MD5, SHA256, URL, DNS domain, or DNS name) user name, host name, comments, changelog, files. This information is generated in the OSMP Console automatically, based on correlation events obtained from Kaspersky Unified Monitoring and Analysis Platform.
- Incident data: linked alerts, triggered rules, compliance with the MITRE matrix, incident status, resolution, affected assets (devices and accounts), observables (from the alert), comments, changelog, files, incident type. This information is generated in the OSMP Console automatically, according to the rules or manually by the user.
- Data on configuring the segmentation rules for generating incidents from alerts: the name and the rule triggering conditions, the template for the name of a new incident, a rule description, and the rule launch priority. The user enters data in the OSMP Console.
- Information about notification templates: template name, message subject, message template, template description, and detection rules. When the detection rules are triggered, notifications are sent. The user enters data in the OSMP Console.
The above data is stored in the database until the expiration date set by the user.
Data about segmentation rules and notification templates is stored until the user deletes it.
- Expiration date settings for alerts and incidents.
- Playbook data:
- Playbook operational data, including data on response action parameters: name, description, tags, trigger, and algorithm. The user enters data in the OSMP console.
- Data on the execution of response actions within a playbook: data from integrated systems, data from devices.
- The full response history of alerts and incidents.
The data listed above is stored in the database for three days and then deleted. Data is completely deleted when Kaspersky Next XDR Expert is uninstalled.
- Integration settings data (both with Kaspersky solutions or services, and with third-party solutions that participate in Kaspersky Next XDR Expert scenarios):
- Kaspersky Threat Intelligence Portal integration: API access token for connecting to Kaspersky Threat Intelligence Portal, cache retention period, whether the connection is through a proxy, or service type. The user enters data in the OSMP console.
- KATA and KEDR integration: KATA and KEDR server address: IP address or host name, port, unique ID for connecting to KATA and KEDR, certificate file, and a private key for connecting to KATA and KEDR. The user enters data in the OSMP console.
- Connection to the host where the custom script will be run: IP address or host name, port, user name and SSH key, and password or key. The user enters data in the OSMP console.
- OSMP Administration Server integration: Administration Server name, full path to the Administration Server in the hierarchy. The user enters data in the OSMP console.
- Kaspersky CyberTrace integration: IPv4 address or hostname and port through which Kaspersky CyberTrace is available, name, and password. The user enters data in the KUMA Console.
- Kaspersky Automated Security Awareness Platform (KASAP) integration: API access token for connecting to KASAP, KASAP portal URL, KASAP administrator email, and whether the connection is through a proxy. The user enters data in the KUMA Console.
- Active Directory integration: addresses of domain controllers, user name and password for connecting to domain controllers, and certificate. The user enters data in the KUMA Console.
- External system integration (such as UserGate): account name and SSH key or password for remote access to the client device.
The above data is stored in the database until the user deletes it. This data is completely deleted when the application is uninstalled.
- IP address from which the user connects to the OSMP console. This data is logged automatically in the OSMP console and is stored until the expiration of revisions of user-edited objects.
For detailed information about other data received, stored, and processed to perform the main functions of Kaspersky Next XDR Expert, refer to the application Help:
All data processed locally can be transferred to Kaspersky only through the dump files, trace files, or log files of Kaspersky Next XDR Expert components, including log files created by installers and utilities. The dump files, trace files, or log files of Kaspersky Next XDR Expert components contain personal or confidential data. The dump files, trace files, and log files are stored on the devices in an unencrypted form. The dump files, trace files, or log files are not transferred to Kaspersky automatically, but an administrator may transfer those files to Kaspersky manually by request from Technical Support to resolve issues related to Kaspersky Next XDR Expert performance. Kaspersky protects any information received in accordance with the law and applicable Kaspersky rules. Data is transmitted over a secure channel. The default storage term for this information (rotation period) is 7 days.
Data transferred to AO Kaspersky Lab
By following the links from the OSMP console to Kaspersky Next XDR Expert Help, the user agrees to the automatic transfer of the following data to Kaspersky:
- Kaspersky Next XDR Expert code
- Kaspersky Next XDR Expert version
- Kaspersky Next XDR Expert localization
To assign a training course to an employee, Kaspersky Next XDR Expert transfers the following data to Kaspersky Automated Security Awareness Platform:
- user email
- Kaspersky Automated Security Awareness Platform ID
- training group ID
To obtain additional alert data, Kaspersky Next XDR Expert transfers the type and value of observables related to alerts, incidents and events to Kaspersky Threat Intelligence Portal.
Data transferred to third parties
By following the link from the alert or incident details for receiving information about the MITRE tactics or technique, the following information about MITRE tactics or techniques is transferred to the MITRE website: ID and type.
Page top
Data provision in Open Single Management Platform
Data processed locally
Open Single Management Platform is designed for centralized execution of basic administration and maintenance tasks on an organization's network. Open Single Management Platform provides the administrator with access to detailed information about the organization's network security level; Open Single Management Platform lets an administrator configure all the components of protection based on Kaspersky applications. Open Single Management Platform performs the following main functions:
- Detecting devices and their users on the organization's network
- Creating a hierarchy of administration groups for device management
- Installing Kaspersky applications on devices
- Managing the settings and tasks of installed applications
- Activating Kaspersky applications on devices
- Managing user accounts
- Viewing information about the operation of Kaspersky applications on devices
- Viewing reports
To perform its main functions Open Single Management Platform can receive, store, and process the following information:
- Information about the devices on the organization's network received through scanning of Active Directory or Samba domain controllers or through scanning of IP intervals. Administration Server gets data independently or receives data from Network Agent.
- Information from Active Directory and Samba about organizational units, domains, users, and groups. Administration Server gets data by itself or receives data from Network Agent assigned to work as a distribution point.
- Details of managed devices. Network Agent transfers the data listed below from the device to Administration Server. The user enters the display name and description of the device in the OSMP Console interface:
- Technical specifications of the managed device and its components required for device identification: device display name and description, Windows domain name and type (for devices belonging to a Windows domain), device name in Windows environment (for devices belonging to a Windows domain), DNS domain and DNS name, IPv4 address, IPv6 address, network location, MAC address, operating system type, whether the device is a virtual machine together with hypervisor type, and whether the device is a dynamic virtual machine as part of VDI.
- Other specifications of managed devices and their components required for audit of managed devices: operating system architecture, operating system vendor, operating system build number, operating system release ID, operating system location folder, if the device is a virtual machine—the virtual machine type, name of the virtual Administration Server that manages the device.
- Details of actions on managed devices: date and time of the last update, time the device was last visible on the network, restart waiting status, and time the device was turned on.
- Details of device user accounts and their work sessions.
- Data received by running remote diagnostics on a managed device: trace files, system information, details of Kaspersky applications installed on the device, dump files, event logs, the results of running the diagnostic scripts received from Kaspersky Technical Support.
- Distribution point operation statistics if the device is a distribution point. Network Agent transfers data from the device to Administration Server.
- Distribution point settings entered by the User in OSMP Console.
- Details of Kaspersky applications installed on the device. The managed application transfers data from the device to Administration Server through Network Agent:
- Settings of Kaspersky applications installed on the managed device: Kaspersky application name and version, status, real-time protection status, last device scan date and time, number of threats detected, number of objects that failed to be disinfected, availability and status of the application components, details of Kaspersky application settings and tasks, information about the active and reserve license keys, application installation date and ID.
- Application operation statistics: events related to the changes in the status of Kaspersky application components on the managed device and to the performance of tasks initiated by the application components.
- Device status defined by the Kaspersky application.
- Tags assigned by the Kaspersky application.
- Data contained in events from Open Single Management Platform components and Kaspersky managed applications. Network Agent transfers data from the device to Administration Server.
- Settings of Open Single Management Platform components and Kaspersky managed applications presented in policies and policy profiles. The User enters data in the OSMP Console interface.
- Task settings of Open Single Management Platform components and Kaspersky managed applications. The User enters data in the OSMP Console interface.
- Data processed by the System management feature. Network Agent transfers from the device to Administration Server the following information:
- Information about the hardware detected on managed devices (Hardware registry).
If Network Agent is installed on a device running Windows, it sends to the Administration Server the following information about the device hardware:
- RAM
- Mass storage devices
- Motherboard
- CPU
- Network adapters
- Monitors
- Video adapter
- Sound card
If Network Agent is installed on a device running Linux, it sends to the Administration Server the following information about the device hardware, if this information is provided by the operating system:
- Total RAM volume
- Total volume of mass storage devices
- Motherboard
- CPU
- Network adapters
- Information about the software installed on managed devices (Software registry). The software can be compared with the information about the executable files detected on the devices by the Application Control function.
- Information about the hardware detected on managed devices (Hardware registry).
- User categories of applications. The User enters data in the OSMP Console interface.
- Details of executable files detected on managed devices by the Application Control feature. The managed application transfers data from the device to Administration Server through Network Agent. A complete list of data is provided in the Help files of the corresponding application.
- Information about encrypted Windows-based devices and the encryption status. The managed application transfers data from the device to Administration Server through Network Agent.
- Details of data encryption errors on Windows-based devices performed using the Data encryption feature of Kaspersky applications. The managed application transfers data from the device to Administration Server through Network Agent. A complete list of data is provided in the Help files of the corresponding application.
- Details of files placed in Backup. The managed application transfers data from the device to Administration Server through Network Agent. A complete list of data is provided in the Help files of the corresponding application.
- Details of files placed in Quarantine. The managed application transfers data from the device to Administration Server through Network Agent. A complete list of data is provided in the Help files of the corresponding application.
- Details of files requested by Kaspersky specialists for detailed analysis. The managed application transfers data from the device to Administration Server through Network Agent. A complete list of data is provided in the Help files of the corresponding application.
- Details of external devices (memory units, information transfer tools, information hardcopy tools, and connection buses) installed or connected to the managed device and detected by the Device Control feature. The managed application transfers data from the device to Administration Server through Network Agent. A complete list of data is provided in the Help files of the corresponding application.
- Information about encrypted devices and the encryption status. A managed application transfers data from the device to Administration Server through Network Agent.
- Information about data encryption errors on the devices. The encryption is performed by the Encryption data function of Kaspersky applications. A managed application transfers data from the device to Administration Server through Network Agent. The full list of data is provided in the Online Help of the corresponding application.
- List of managed programmable logic controllers (PLCs). The managed application transfers data from the device to Administration Server through Network Agent. A complete list of data is provided in the Help files of the corresponding application.
- Data required for creation of a threat development chain. The managed application transfers data from the device to Administration Server through Network Agent. A complete list of data is provided in the Help files of the corresponding application.
- Details of the entered activation codes and key files. The User enters data in the Administration Console or OSMP Console interface.
- User accounts: name, description, full name, email address, main phone number, and password. The User enters data in the OSMP Console interface.
- Revision history of management objects. The User enters data in the OSMP Console interface.
- Registry of deleted management objects. The User enters data in the OSMP Console interface.
- Installation packages created from the file, as well as installation settings. The User enters data in the OSMP Console interface.
- Data required for the display of announcements from Kaspersky in OSMP Console. The User enters data in the OSMP Console interface.
- Data required for the functioning of plug-ins of managed applications in OSMP Console and saved by the plug-ins in the Administration Server database during their routine operation. The description and ways of providing the data are provided in the Help files of the corresponding application.
- OSMP Console user settings: localization language and theme of the interface, Monitoring panel display settings, information about the status of notifications (Already read / Not yet read), status of columns in spreadsheets (Show / Hide), Training mode progress. The User enters data in the OSMP Console interface.
- Certificate for secure connection of managed devices to the Open Single Management Platform components. The User enters data in the OSMP Console interface.
- Information on which Kaspersky legal agreement terms have been accepted by the user.
- The Administration Server data that the User enters in the OSMP Console or program interface Kaspersky Security Center OpenAPI.
- Any data that the User enters in the OSMP Console interface.
The data listed above can be present in Open Single Management Platform if one of the following methods is applied:
- The User enters data in the OSMP Console interface.
- Network Agent automatically receives data from the device and transfers it to Administration Server.
- Network Agent receives data retrieved by the Kaspersky managed application and transfers it to Administration Server. The lists of data processed by Kaspersky managed applications are provided in the Help files for the corresponding applications.
- Administration Server gets the information about the networked devices by itself or receives data from Network Agent assigned to work as a distribution point.
The listed data is stored in the Administration Server database. User names and passwords are stored in encrypted form.
All data processed locally can be transferred to Kaspersky only through dump files, trace files, or log files of Open Single Management Platform components, including log files created by installers and utilities.
The dump files, trace files, or log files of Open Single Management Platform components contain arbitrary data of Administration Server, Network Agent, and OSMP Console. The files may contain personal or confidential data. The dump files, trace files, or log files are stored on the devices in an unencrypted form. The dump files, trace files, or log files are not transferred to Kaspersky automatically, but an administrator may transfer those files to Kaspersky manually by request from Technical Support to resolve issues related to Open Single Management Platform performance.
Kaspersky protects any information received in accordance with law and applicable Kaspersky rules. Data is transmitted over a secure channel.
Following the links in the Administration Console or OSMP Console, the User agrees to the automatic transfer of the following data:
- Open Single Management Platform code
- Open Single Management Platform version
- Open Single Management Platform localization
- License ID
- License type
- Whether the license was purchased through a partner
The list of data provided via each link depends on the purpose and location of the link.
Kaspersky uses the received data in anonymized form and for general statistics only. Summary statistics are generated automatically from the originally received information and do not contain any personal or confidential data. As soon as new data is accumulated, the previous data is wiped (once a year). Summary statistics are stored indefinitely.
Page top
Data provision in Kaspersky Unified Monitoring and Analysis Platform
Data provided to third parties
KUMA functionality does not involve automatic provision of user data to third parties.
Locally processed data
Kaspersky Unified Monitoring and Analysis Platform (hereinafter KUMA or "program") is an integrated software solution that includes the following primary functions:
- Receiving, processing, and storing information security events.
- Analysis and correlation of incoming data.
- Search within the obtained events.
- Creation of notifications upon detecting symptoms of information security threats.
- Creation of alerts and incidents for processing information security threats.
- Displaying information about the status of the customer's infrastructure on the dashboard and in reports.
- Monitoring event sources.
- Device (asset) management — viewing information about assets, searching, adding, editing, and deleting assets, exporting asset information to a CSV file.
To perform its primary functions, KUMA may receive, store and process the following information:
- Information about devices on the corporate network.
The KUMA Core server receives data if the corresponding integration is configured. You can add assets to KUMA in the following ways:
- Import assets:
- On demand from MaxPatrol.
- On a schedule from Open Single Management Platform and KICS for Networks.
- Create assets manually through the web interface or via the API.
KUMA stores the following device information:
- Technical characteristics of the device.
- Vulnerabilities, detected on an asset.
- Information specific to the source of the asset.
- Import assets:
- Additional technical attributes of devices on the corporate network that the user specifies to send an incident to NCIRCC: IP addresses, domain names, URIs, email address of the attacked object, attacked network service, and port/protocol.
- Information about the organization: name, tax ID, address, email address for sending notifications.
- Active Directory information about organizational units, domains, users, and groups obtained as a result of querying the Active Directory network.
The KUMA Core server receives this information if the corresponding integration is configured. To ensure the security of the connection to the LDAP server, the user must enter the server URL, the Base DN, connection credentials, and certificate in the KUMA Console.
- Information for domain authentication of users in KUMA: root DN for searching access groups in the Active Directory directory service, URL of the domain controller, certificate (the root public key that the AD certificate is signed with), full path to the access group of users in AD (distinguished name).
- Information contained in events from configured sources.
In the collector, the event source is configured, KUMA events are generated and sent to other KUMA services. Sometimes events can arrive first at the agent service, which relays events from the source to the collector. In addition, you can configure saving the address or a hostname of the server that aggregates the events.
- Information required for the integration of KUMA with other applications (Kaspersky Threat Lookup, Kaspersky CyberTrace, Open Single Management Platform, Kaspersky Industrial CyberSecurity for Networks, Kaspersky Automated Security Awareness Platform, Kaspersky Endpoint Detection and Response, Security Orchestration, Automation and Response, AI services: AI asset score and status, Kaspersky Investigation and Response Assistant).
It can include certificates, tokens, URLs or credentials for establishing a connection with the other application, or other data necessary for the basic functionality of KUMA, for example, email. The user enters this data in the KUMA Console
- Information about sources from which event receipt is configured.
It can include the source name, host name, IP address, the monitoring policy assigned to the source. The monitoring policy specifies the email address of the person responsible, to whom a notification will be sent if the policy is violated.
- User accounts: name, username, email address. The user can view their profile data in the KUMA Console.
- User profile settings:
- User role in KUMA. A user can see their assigned roles.
- Localization language, notification settings, display of non-printable characters.
The user enters this data in the KUMA interface.
- List of asset categories in the Assets section, default dashboard, TV mode flag for the dashboard, SQL query for default events, default preset.
The user specifies these settings in the corresponding sections of the KUMA Console.
- Data for domain authentication of users in KUMA:
- Active Directory: root DN for searching access groups in the Active Directory directory service, URL of the domain controller, certificate (the root public key that the AD certificate is signed with), full path to the access group of users in AD (distinguished name).
- Active Directory Federation Services: trusted party ID (KUMA ID in ADFS), URI for getting Connect metadata, URL for redirection from ADFS, and the ADFS server certificate.
- FreeIPA: Base DN, URL, certificate (the public root key that was used to signed the FreeIPA certificate), custom integration credentials, connection credentials.
- Audit events
KUMA automatically records audit events.
- KUMA log
The user can enable extended logging in the KUMA Console. Log entries are stored on the user's device, no data is transmitted automatically.
- Information about the user accepting the terms and conditions of legal agreements with Kaspersky.
- Any information that the user enters in the KUMA interface.
The information listed above can find its way into KUMA in the following ways:
- The user enters information in the KUMA Console.
- KUMA services (agent or collector) receive data if the user has configured a connection to event sources.
- Through the KUMA REST API.
- Device information can be obtained using the utility from MaxPatrol.
The listed information is stored in the KUMA database (MongoDB, ClickHouse, SQLite). Passwords are stored in an encrypted form (the hash of the password is stored).
All of the information listed above can be transmitted to Kaspersky only in dump files, trace files, or log files of KUMA components, including log files created by the installer and utilities.
Dump files, trace files, and log files of KUMA components may contain personal and confidential information. Dump files, trace files, and log files are stored on the device in unencrypted form. Dump files, trace files, and log files are not automatically submitted to Kaspersky, but the administrator can manually submit this information to Kaspersky at the request of Technical Support to help troubleshoot KUMA problems.
Kaspersky uses the received data in anonymized form and only for general statistical purposes. Summary statistics are generated from the received raw data automatically and does not contain any personal or other confidential information. When new data accumulates, older data is erased (once a year). Summary statistics are stored indefinitely.
Kaspersky protects all received data in accordance with applicable law and Kaspersky policies. Data is transmitted over secure communication channels.
Page top
Quick start guide
The following scenarios are step-by-step walkthroughs from the purchase of Kaspersky Next XDR Expert to incident investigation and threat hunting.
Start with installation and initial setup of Kaspersky Next XDR Expert, then explore Kaspersky Next XDR Expert threat detection and hunting features, and then check out an example of an incident investigation workflow.
Deployment and initial setup of Kaspersky Next XDR Expert
Following this scenario, you can deploy Open Single Management Platform with all the components necessary for operation of the Kaspersky Next XDR Expert solution, and then perform the required preliminary configurations and integrations.
Prerequisites
Before you start, make sure that:
- You have a license key for Kaspersky Next XDR Expert and the compatible EPP applications.
- Your infrastructure meets the hardware and software requirements.
Stages
The main installation and initial setup scenario proceeds in stages:
- Deployment
Prepare your infrastructure for the deployment of Open Single Management Platform and all the required components for Kaspersky Next XDR Expert, and then deploy the solution by using the Kaspersky Deployment Toolkit utility.
- Activation
Activate the Kaspersky Next XDR Expert solution under your license.
- Configuring multitenancy
If necessary, you can use the multitenancy features:
- Plan and create the required hierarchy of tenants.
- Create the matching hierarchy of Administration Servers in Open Single Management Platform.
- Bind tenants to the corresponding Administration Servers.
- Create user accounts for all Kaspersky Next XDR Expert users, and then assign roles.
- Adding assets
The devices in your infrastructure that must be protected are represented as assets in Kaspersky Next XDR Expert. Open Single Management Platform allows you to discover the devices in your network and manage their protection. You will also be able to add assets manually or import them from other sources during stage 8.
User accounts are also represented as assets in Kaspersky Next XDR Expert. Make sure to configure the integration with Active Directory during stage 9, to enable the display of affected user accounts in the related events, alerts, and incidents.
- Adding users and assigning roles
Assign roles to the user accounts, to define their access rights to various Kaspersky Next XDR Expert features depending on their tasks.
- Connecting to an SMTP server
Configure the connection to an SMTP server for email notifications about events occurring in Kaspersky Next XDR Expert.
- Installing endpoint protection applications and solutions
Kaspersky Next XDR Expert works with events received from security applications installed on your assets. Check the list of compatible Kaspersky applications and solutions. You can use Open Single Management Platform to deploy Kaspersky applications on the devices in your infrastructure.
Ensure that endpoint protection applications are integrated with Kaspersky Anti Targeted Attack Platform. For example, if you use Kaspersky Endpoint Security on your assets, refer to one of the following Help documentations to learn how to configure integration with KATA:
- Configuring event sources, storage, and correlation
Specify where the events must be received from, and how they must be stored and processed:
- Log in to the KUMA Console.
- Set up integration of Kaspersky Unified Monitoring and Analysis Platform and Open Single Management Platform.
- Import assets from Open Single Management Platform.
- Add assets manually or import them from other sources (optional action).
- Configure the event sources to specify where you want to receive the events from.
- Create a storage for events.
- Create collectors for receiving, processing (normalizing), and transmitting the events.
- Create correlators for initial analysis of normalized events and their further processing.
During the collector creation, you can create correlation rules to define the rules of processing and responding to the events.You can also import the previously saved correlation rules or use the ready-made set of correlation rules provided with the Kaspersky Next XDR Expert solution. After the correlator is created, you can link correlation rules to the correlator, if needed.
We strongly recommended configuring the exclusions on this stage, to avoid false positives and irrelevant data.
- Configuring the integrations
Configure the integration of Kaspersky Next XDR Expert with Active Directory and with other Kaspersky solutions, to extend its possibilities and to enrich data available for incident investigation.
- Integration with Active Directory (strongly recommended).
- Integration with KATA/EDR (license is required).
- Integration with Kaspersky CyberTrace (optional integration; license is required).
- Integration with Kaspersky TIP (optional integration; license is required) or Kaspersky Open TIP.
- Integration with Kaspersky Automated Security Awareness Platform (optional integration; license is required).
- Configuring updates
Create the Download updates to the Administration Server repository task.
- Verify correctness of configuration
Use the EICAR test file on one of the assets. If the initial setup was performed correctly and the necessary correlation rules were configured, this event will trigger creation of an alert in the alerts list.
After the initial setup is complete, events from the protected assets will be received and processed by Kaspersky Next XDR Expert, and an alert will be created in the event a correlation rule is triggered.
Verifying correctness of the Kaspersky Next XDR Expert configuration
You can use the EICAR test virus on one of the assets, to ensure that Kaspersky Next XDR Expert is deployed and configured correctly. If the initial setup was performed correctly and the necessary correlation rules were configured, the correlation event will trigger the creation of an alert in the alerts list.
To verify correctness of the Kaspersky Next XDR Expert configuration:
- Create a new correlator in KUMA Console.
When creating the correlator, do not specify parameters in the Correlation section.
- Import correlation rules from the SOC Content package to obtain the predefined correlation rules used to detect the EICAR test virus.
- Specify the correlation rule for the created correlator.
You can use one of the following methods to specify the correlation rule:
- Link the predefined correlation rule to the created correlator:
- Go to Resources, click Correlation rules, and then select the tenant to which the correlation rule will be applied.
- In the list of the predefined correlation rules, select the R077_02_KSC.Malware detected rule to detect events from Kaspersky Security Center.
- Click Link to correlator, and then select the created correlator to link the selected correlation rule to the correlator.
- Create the correlation rule with the predefined filters manually:
- Open the created correlator settings, go to the Correlation section, and then click Add.
- In the Create correlation rule window, on the General tab, set the following parameters, as well as other rule parameters:
- Kind: simple.
- Propagated fields: DestinationAddress, DestinationHostName, DestinationAccountID, DestinationAssetID, DestinationNtDomain, DestinationProcessName, DestinationUserName, DestinationUserID, SourceAccountID, SourceUserName.
- Go to Selectors → Settings, and then specify the expression to filter the required events:
- In builder mode, add the f: KSC events, f: KSC virus found, and f: Base events filters with the AND operator.
- Alternatively, you can specify this expression in the source code mode as follows:
filter='b308fc22-fa79-4324-8fc6-291d94ef2999'AND filter='a1bf2e45-75f4-45c1-920d-55f5e1b8843f'AND filter='1ffa756c-e8d9-466a-a44b-ed8007ca80ca'
- In the Actions section of the correlation rule settings, select only the Output check box (the Loop to correlator and No alert check boxes must be cleared). In this case, when the EICAR test virus is detected, a correlation event will be created and an alert will be created in the alert list of Kaspersky Next XDR Expert.
- Click Create new to save the correlation rule settings linked to the correlator.
- Link the predefined correlation rule to the created correlator:
- Create, and then configure, a collector in KUMA Console for receiving information about Administration Server events from an MS SQL database.
Alternatively, you can use the predefined [OOTB] KSC SQL collector.
- In the Routing section of the collector settings, set Type to correlator, and then specify the created correlator in the URL field, to forward the processed events to it.
- Install Network Agent and the endpoint protection application (for example, Kaspersky Endpoint Security) on an asset of your organization network. Ensure that the asset is connected to Administration Server.
- Place the EICAR test file on the asset, and then detect the test virus by using the endpoint protection application.
After that, Administration Server will be notified about the event on the asset. This event will be forwarded to the KUMA component, transformed to the correlation event, and then this event will trigger creation of an alert in the alerts list in Kaspersky Next XDR Expert. If the alert has been created, it means that Kaspersky Next XDR Expert is working correctly.
Page top
Using the threat monitoring, detection and hunting features
After you have installed and configured Kaspersky Next XDR Expert, you can use Kaspersky Next XDR Expert features for monitoring the security of your infrastructure, investigating security incidents, automating workflows and proactive searching for threats:
- Using dashboard and customizing widgets
The Detection and response tab of the dashboard can contain widgets that display information about detected and registered alerts and incidents, and response actions to them. You can use and customize the preconfigured layouts of widgets for your dashboard or create new layouts and widgets.
Open Single Management Platform also provides various security monitoring and reporting tools.
- Using reports
You can configure the generation of reports in Kaspersky Unified Monitoring and Analysis Platform to receive the required summary data according to the specified schedule.
- Using threat hunting
You can use threat hunting tools to analyze events to search for threats and vulnerabilities that have not been detected automatically. Threat hunting can be used both for alert and incident investigation and for proactive search for threats.
- Using playbooks
You can use playbooks to automate response to alerts and incidents according to the specified algorithm. There are a number of predefined playbooks that you can launch in various operation modes. You can create custom playbooks.
Example of incident investigation with Kaspersky Next XDR Expert
This scenario represents a sample workflow of an incident investigation.
Incident investigation proceeds in stages:
- Assigning an alert to a user
You can assign an alert to yourself or to another user.
- Checking if the triggered correlation rule matches the data of the alert events
View the information about the alert and make sure that the alert event data matches the triggered correlation rule.
- Analyzing alert information
Analyze the information about the alert to determine what data is required for further analysis of the alert.
- Manual enrichment
Launch the available solutions for additional enrichment of an event (for example, Kaspersky TIP).
- False positive check
Make sure that the activity that triggered the correlation rule is abnormal for the organization IT infrastructure.
- Incident creation
If steps from 3 to 5 reveal that the alert requires investigation, you can create an incident or link the alert to an existing incident.
You can also merge incidents.
- Investigation
This step includes viewing information about the assets, user accounts, and alerts related to the incident. You can use the investigation graph and threat hunting tools to get additional information.
- Searching for related assets
You can view the alerts that occurred on the assets related to the incident.
- Searching for related events
You can expand your investigation scope by searching for events of related alerts.
- Recording the causes of the incident
You can record the information necessary for the investigation in the incident change log.
- Response
You can perform response actions manually.
- Closing the incident
After taking measures to clean up the traces of the attacker's presence from the organization's IT infrastructure, you can close the incident.
Deployment of Kaspersky Next XDR Expert
Following this scenario, you can prepare your infrastructure for the deployment of Open Single Management Platform and all the required components for Kaspersky Next XDR Expert, prepare the configuration file containing the installation parameters, and deploy the solution by using the Kaspersky Deployment Toolkit utility (hereinafter referred to as KDT).
Before you deploy Open Single Management Platform and Kaspersky Next XDR Expert components, we recommend reading the Hardening Guide.
The deployment scenario proceeds in stages:
- Selecting the option for deploying Kaspersky Next XDR Expert
Select the configuration of Kaspersky Next XDR Expert that best suits your organization. The multi-node and single-node deployment are available.
- Downloading the distribution package with the Kaspersky Next XDR Expert components
The distribution package contains the following components:
- Transport archive with the Kaspersky Next XDR Expert components and End User License Agreements for Kaspersky Next XDR Expert and KDT
- Archive with the KDT utility, and templates of the configuration file and KUMA inventory file
- Installing a database management system (DBMS)
For the multi-node deployment, manually install the DBMS on the separated server outside the Kubernetes cluster.
For the single-node deployment, manually install the DBMS on the target host before the Kaspersky Next XDR Expert deployment. In this case, the DBMS and Kaspersky Next XDR Expert components are installed on the same target host, but the DBMS is not included in the Kubernetes cluster.
If you perform the demonstration deployment and want to install the DBMS inside the cluster, skip this step. KDT will install the DBMS during the Kaspersky Next XDR Expert deployment.
- Preparing the administrator and target hosts
Based on the selected deployment scheme, define the number of target hosts on which you will deploy the Kubernetes cluster and the Kaspersky Next XDR Expert components included in this cluster. Prepare the selected administrator and target hosts for deployment of Kaspersky Next XDR Expert.
How-to instructions:
- Preparing the KUMA hosts
Prepare the KUMA target hosts for the installation of the KUMA services (collectors, correlators, and storages).
How-to instruction: Preparing the hosts for installation of the KUMA services
- Preparing the KUMA inventory file for installation of the KUMA services
Prepare the KUMA inventory file in the YAML format. The KUMA inventory file contains parameters for installation of the KUMA services.
How-to instruction: Preparing the KUMA inventory file
- Preparing the configuration file
Prepare the configuration file in the YAML format. The configuration file contains the list of target hosts for deployment and a set of installation parameters of the Kaspersky Next XDR Expert components.
If you deploy Kaspersky Next XDR Expert on a single-node, use the configuration file that contains the installation parameters specific for the single-node deployment.
How-to instructions:
- Multi-node deployment: Specifying the installation parameters
- Single-node deployment: Specifying the installation parameters
You can fill out the configuration file template manually; or use the Configuration wizard to specify the installation parameters that are required for the Kaspersky Next XDR Expert deployment, and then generate the configuration file.
How-to instruction: Specifying the installation parameters by using the Configuration wizard
- Deployment of Kaspersky Next XDR Expert
Deploy Kaspersky Next XDR Expert by using KDT. KDT automatically deploys the Kubernetes cluster within which the Kaspersky Next XDR Expert components and other infrastructure components are installed.
How-to instruction: Installing Kaspersky Next XDR Expert
- Installing the KUMA services
Install the KUMA services (collectors, correlators, and storages) on the prepared KUMA target hosts that are located outside the Kubernetes cluster.
How-to instruction: Installing KUMA services
- Configuring integration with Kaspersky Anti Targeted Attack Platform
Install Central Node to receive telemetry from Kaspersky Anti Targeted Attack Platform, and then configure integration between Kaspersky Next XDR Expert and KATA/KEDR to manage threat response actions on assets connected to Kaspersky Endpoint Detection and Response servers.
If necessary, you can install multiple Central Node components to use them independently of each other or to combine them for centralized management in the distributed solution mode. To combine multiple Central Node components, you have to organize the servers with the components into a hierarchy.
When configuring the Central Node servers, you have to specify the minimum possible value in the Storage field, to avoid duplication of data between the Kaspersky Next XDR Expert and KEDR databases.
Hardening Guide
The Hardening Guide is intended for professionals who deploy and administer Kaspersky Next XDR Expert, as well as for those who provide technical support to organizations that use Kaspersky Next XDR Expert.
The Hardening Guide describes recommendations and features of configuring Kaspersky Next XDR Expert and its components, aimed to reduce the risks of its compromise.
The Hardening Guide contains the following information:
- Preparing the infrastructure for the Kaspersky Next XDR Expert deployment
- Configuring a secure connection to Kaspersky Next XDR Expert
- Configuring accounts to access Kaspersky Next XDR Expert
- Managing protection of Kaspersky Next XDR Expert
- Managing protection of client devices
- Configuring protection for managed applications
- Transferring information to third-party applications
Before you start to deploy Kaspersky Next XDR Expert, we recommend reading the Hardening Guide.
Managing infrastructure of Kaspersky Next XDR Expert
This section describes the general principle of using the minimum required number of applications for the function of the operating system and Kaspersky Next XDR Expert. This section also describes the principle of least privilege, which boils down to the concept of Zero Trust.
Managing operating system accounts
To work with a Kubernetes cluster by using KDT, we recommend creating a separate user with minimal privileges. The optimal way is to implement management of user accounts of the operating system by using LDAP, with the ability to revoke user rights through LDAP. For the specific implementation of user revocation and blocking, see the user/administrator guide in your LDAP solution. We recommend using a password of at least 18 characters or a passphrase with any delimiters of at least 4 words to authenticate the user. You can also use a physical means of authentication (for example, token).
We also recommend protecting the user home directory and all nested directories in such a way that only the user has access to them. Other users and the user group must not have rights to the home directory.
We recommend not granting the execute permission for the .ssh, .kube, .config, and .kdt directories, and all the contained files in these directories in the user's home directory.
Package management of the operating system
We recommend using the minimum set of applications required for the function of KDT and Kaspersky Next XDR Expert. For example, you do not need to use a graphical user interface for working in the Kubernetes cluster, so we recommend not installing graphical packages. If packages are installed, we recommend removing these packages, including graphical servers such as Xorg or Wayland.
We recommend regularly installing security updates for the system software and the Linux kernel. We also recommend enabling automatic updates as follows:
- For operating systems with the atp package manager:
/etc/apt/apt.conf.d/50unattended-upgrades
Unattended-Upgrade::Allowed-Origins { "${distro_id}:${distro_codename}-security"; "${distro_id}ESMApps:${distro_codename}-apps-security"; "${distro_id}ESM:${distro_codename}-infra-security"; }; - For operating systems with the rp, dnf, and yum package managers:
/etc/dnf/automatic.conf
[commands] # What kind of upgrade to perform: # default = all available upgrades # security = only the security upgrades upgrade_type = default # Whether updates should be downloaded when they are available, by # dnf-automatic.timer. notifyonly.timer, download.timer and # install.timer override this setting. download_updates = yes # Whether updates should be applied when they are available, by # dnf-automatic.timer. notifyonly.timer, download.timer and # install.timer override this setting. apply_updates = no
Operating system security settings
The Linux kernel security settings can be enabled in the /etc/sysctl.conf file or by using the sysctl command. The recommended Linux kernel security settings are listed in the /etc/sysctl.conf file snippet:
/etc/sysctl.conf
We recommend restricting access to the PID. This will reduce the possibility of one user tracking the processes of another user. You can restrict access to the PID while mounting the /proc file system, for example, by adding the following line to the /etc/fstab file:
If the operating system processes are managed by using the systemd system, the systemd-logind service can still monitor the processes of other users. In order for user sessions to work correctly in the systemd system, you need to create the /etc/systemd/system/systemd-logind.service.d/hidepid.conf file, and then add the following lines to it:
Since some systems may not have the proc group, we recommend adding the proc group in advance.
We recommend turning off the ctrl+alt+del key combination, to prevent an unexpected reboot of the operating system by using the systemctl mask ctrl-alt-del.target command.
We recommend prohibiting authentication of privileged users (root users) to establish a remote user connection.
We recommend using a firewall to limit network activity. For more information about the ports and protocols used, refer to Ports used by Kaspersky Next XDR Expert.
We recommend enabling auditd, to simplify the investigation of security incidents. For more information about enabling telemetry redirection, refer to Setting up receiving Auditd events.
We recommend regularly backing up the following configurations and data directories:
- Administration host:
~/kdt - Target hosts:
/etc/k0s/,/var/lib/k0s
Also we recommend encrypting these backups.
Hardening guides for various operating systems and for DBMS
If you need to configure the security settings of your operating system and software, you can use the recommendations provided by Center for Internet Security (CIS).
If you use the Astra Linux operating system, refer to the security recommendations that can be applied to your Astra Linux version.
If you need to configure security settings of PostgreSQL, use the server administration recommendations from the official PostgreSQL documentation.
Page top
Connection safety
Strict TLS settings
We recommend using TLS protocol version 1.2 and later, and restricting or prohibiting insecure encryption algorithms.
You can configure encryption protocols (TLS) used by Administration Server. Please note that at the time of the release of a version of Kaspersky Next XDR Expert, the encryption protocol settings are configured by default to ensure secure data transfer.
Restricting access to the Kaspersky Next XDR Expert database
We recommend restricting access to the Kaspersky Next XDR Expert database. For example, grant access only from devices with Kaspersky Next XDR Expert deployed. This reduces the likelihood of the Kaspersky Next XDR Expert database being compromised due to known vulnerabilities.
You can configure the parameters according to the operating instructions of the used database, as well as provide closed ports on firewalls.
Page top
Accounts and authentication
Using two-step verification with Kaspersky Next XDR Expert
Kaspersky Next XDR Expert provides two-step verification for users, based on the RFC 6238 standard (TOTP: Time-Based One-Time Password algorithm).
When two-step verification is enabled for your own account, every time you log in to Kaspersky Next XDR Expert through a browser, you enter your user name, password, and an additional single-use security code. To receive a single-use security code, you must install an authenticator app on your computer or your mobile device.
There are both software and hardware authenticators (tokens) that support the RFC 6238 standard. For example, software authenticators include Google Authenticator, Microsoft Authenticator, FreeOTP.
We strongly do not recommend installing the authenticator app on the same device from which the connection to Kaspersky Next XDR Expert is established. You can install an authenticator app on your mobile device.
Using two-factor authentication for an operating system
We recommend using multi-factor authentication (MFA) on devices with Kaspersky Next XDR Expert deployed, by using a token, a smart card, or other method (if possible).
Prohibition on saving the administrator password
If you use Kaspersky Next XDR Expert through a browser, we do not recommend saving the administrator password in the browser installed on the user device.
Authentication of an internal user account
By default, the password of an internal user account of Kaspersky Next XDR Expert must comply with the following rules:
The password must be 8 to 16 characters long.
The password must contain characters from at least three of the groups listed below:
Uppercase letters (A-Z)
Lowercase letters (a-z)
Numbers (0-9)
Special characters (@ # $ % ^ & * - _ ! + = [ ] { } | : ' , . ? / \ ` ~ " ( ) ;)
The password must not contain any whitespaces, Unicode characters, or the combination of "." and "@", when "." is placed before "@".
By default, the maximum number of allowed attempts to enter a password is 10. You can change the number of allowed password entry attempts.
The user can enter an invalid password a limited number of times. After the limit is reached, the user account is blocked for one hour.
Restricting the assignment of the Main Administrator role
The user is assigned the Main Administrator role in the access control list (ACL) of Kaspersky Next XDR Expert. We do not recommend assigning the Main Administrator role to a large number of users.
Configuring access rights to application features
We recommend using flexible configuration of access rights to the features of Kaspersky Next XDR Expert for each user or group of users.
Role-based access control allows the creation of standard user roles with a predefined set of rights and the assignment of those roles to users depending on their scope of duties.
The main advantages of the role-based access control model:
- Ease of administration
- Role hierarchy
- Least privilege approach
- Segregation of duties
You can assign built-in roles to certain employees based on their positions, or create completely new roles.
While configuring roles, pay attention to the privileges associated with changing the protection state of the device with Kaspersky Next XDR Expert and remote installation of third-party software:
- Managing administration groups.
- Operations with Administration Server.
- Remote installation.
- Changing the parameters for storing events and sending notifications.
This privilege allows you to set notifications that run a script or an executable module on the device with OSMP when an event occurs.
Separate account for remote installation of applications
In addition to the basic differentiation of access rights, we recommend restricting the remote installation of applications for all accounts (except for the Main Administrator or another specialized account).
We recommend using a separate account for remote installation of applications. You can assign a role or permissions to the separate account.
Regular audit of all users
We recommend conducting a regular audit of all users on devices with Kaspersky Next XDR Expert deployed. This allows you to respond to certain types of security threats associated with the possible compromise of a device.
Page top
Managing protection of Kaspersky Next XDR Expert
Selecting protection software of Kaspersky Next XDR Expert
Depending on the type of the Kaspersky Next XDR Expert deployment and the general protection strategy, select the application to protect devices with Kaspersky Next XDR Expert deployed and the administrator host.
If you deploy Kaspersky Next XDR Expert on dedicated devices, we recommend selecting the Kaspersky Endpoint Security application to protect devices with Kaspersky Next XDR Expert deployed and the administrator host. This allows applying all available technologies to protect these devices, including behavioral analysis modules.
If Kaspersky Next XDR Expert is deployed on devices that exists in the infrastructure and has previously been used for other tasks, we recommend considering the following protection software:
- Kaspersky Industrial CyberSecurity for Nodes. We recommend installing this application on devices that are included in an industrial network. Kaspersky Industrial CyberSecurity for Nodes is an application that has certificates of compatibility with various manufacturers of industrial software.
- Recommended security applications. If Kaspersky Next XDR Expert is deployed on devices with other software, we recommend taking into account the recommendations from that software vendor on the compatibility of security applications (there may already be recommendations for selecting a security solution, and you may need to configure the trusted zone).
Protection modules
If there are no special recommendations from the vendor of the third-party software installed on the same devices as Kaspersky Next XDR Expert, we recommend activating and configuring all available protection modules (after checking the operation of these protection modules for a certain time).
Configuring the firewall of devices with Kaspersky Next XDR Expert
On devices with Kaspersky Next XDR Expert deployed, we recommend configuring the firewall to restrict the number of devices from which administrators can connect to Kaspersky Next XDR Expert through a browser.
By default,
Kaspersky Next XDR Expert uses port 443 to log in through a browser. We recommend restricting the number of devices from which Kaspersky Next XDR Expert can be managed by using this port.
Page top
Managing protection of client devices
Restricting of adding license keys to installation packages
Installation packages can be published through Web Server, which is included in Kaspersky Next XDR Expert. If you add a license key to the installation package that is published on Web Server, the license key will be available for all users to read.
To avoid compromising the license key, we do not recommend adding license keys to installation packages.
We recommend using automatic distribution of license keys to managed devices, deployment through the Add license key task for a managed application, and adding an activation code or a key file manually to the devices.
Automatic rules for moving devices between administration groups
We recommend restricting the use of automatic rules for moving devices between administration groups.
If you use automatic rules for moving devices, this may lead to propagation of policies that provide more privileges to the moved device than the device has before relocation.
Also, moving a client device to another administration group may lead to propagation of policy settings. These policy settings may be undesirable for distribution to guest and untrusted devices.
This recommendation does not apply for one-time initial allocation of devices to administration groups.
Security requirements for distribution points and connection gateways
Devices with Network Agent installed can act as a distribution point and perform the following functions:
- Distribute updates and installation packages received from Kaspersky Next XDR Expert to client devices within the group.
- Perform remote installation of third-party software and Kaspersky applications on client devices.
- Poll the network to detect new devices and update information about existing ones. The distribution point can use the same methods of device detection as Kaspersky Next XDR Expert.
Placing distribution points on the organization's network used for:
- Reducing the load on Kaspersky Next XDR Expert
- Traffic optimization
- Providing Kaspersky Next XDR Expert with access to devices in hard-to-reach parts of the network
Taking into account the available capabilities, we recommend protecting devices that act as distribution points from any type of unauthorized access (including physically).
Restricting automatic assignment of distribution points
To simplify administration and keep the network operability, we recommend using automatic assignment of distribution points. However, for industrial networks and small networks, we recommend that you avoid assigning distribution points automatically, since, for example, the private information of the accounts used for pushing remote installation tasks, can be transferred to distribution points by means of the operating system.
For industrial networks and small networks, you can manually assign devices to act as distribution points.
You can also view the Report on activity of distribution points.
Page top
Configuring protection for managed applications
Managed application policies
We recommend creating a policy for each type of the used applications and for all components of Kaspersky Next XDR Expert (Network Agent, Kaspersky Endpoint Security for Windows, Kaspersky Endpoint Agent, and others). This policy must be applied to all managed devices (the root administration group) or to a separate group to which new managed devices are automatically moved according to the configured movement rules.
Specifying the password for disabling protection and uninstalling the application
We strongly recommend enabling password protection to prevent intruders from disabling or uninstalling Kaspersky security applications. On platforms where password protection is supported, you can set the password, for example, for Kaspersky Endpoint Security, Network Agent, and other Kaspersky applications. After you enable password protection, we recommend locking the corresponding settings by closing the "lock."
Using Kaspersky Security Network
In all policies of managed applications and in the Kaspersky Next XDR Expert properties, we recommend enabling the use of Kaspersky Security Network (KSN) and accepting the KSN Statement. When you update Kaspersky Next XDR Expert, you can accept the updated KSN Statement. In some cases, when the use of cloud services is prohibited by law or other regulations, you can disable KSN.
Regular scan of managed devices
For all device groups, we recommend creating a task that periodically runs a full scan of devices.
Discovering new devices
We recommend properly configuring device discovery settings: set up integration with domain controllers and specify IP address ranges for discovering new devices.
For security purposes, you can use the default administration group that includes all new devices and the default policies affecting this group.
Page top
Event transfer to third-party systems
This section describes the specifics of transferring security issues found on client devices to third-party systems.
Monitoring and reporting
For timely response to security issues, we recommend configuring the monitoring and reporting features.
Export of events to SIEM systems
For fast detection of security issues before significant damage occurs, we recommend using event export in a SIEM system.
Email notifications of audit events
For timely response to emergencies, we recommend configuring Administration Server to send notifications about the audit events, critical events, failure events, and warnings that it publishes.
Since these events are intra-system events, a small number of them can be expected, which is quite applicable for mailing.
Page top
Deployment schemes
There are two options for deploying Kaspersky Next XDR Expert: on multiple nodes or on a single node of the Kubernetes cluster. Before you start, we recommend that you familiarize yourself with the available deployment schemes, and then choose the one that best meets your organization's requirements. You can use the sizing guide that describes the hardware requirements and the recommended deployment option in relation to the number of devices in the organization.
Depending on the deployment option you choose, you may need the following hosts for the function of Kaspersky Next XDR Expert:
- Administrator host
- Target hosts
- DBMS host (only for the multi-node deployment)
- KATA/KEDR host (optional)
Multi-node deployment
In the multi-node deployment, the Kaspersky Next XDR Expert components are installed on several worker nodes of the Kubernetes cluster and if one node fails, the cluster can restore the operation of components on another node.
In this configuration, you need at least seven hosts:
- 1 administrator host
- 4 target hosts for installing the Kubernetes cluster and the Kaspersky Next XDR Expert components
- 1 host for installing the DBMS
- 1 KUMA target host for installing the KUMA services
Single-node deployment
In the single-node deployment, all Kaspersky Next XDR Expert components are installed on a single node of the Kubernetes cluster. You can perform the single-node deployment of Kaspersky Next XDR Expert if you need a solution that requires fewer computing resources.
In this configuration, you need at least three hosts:
- 1 administrator host
- 1 target host for installing the Kubernetes cluster, the Kaspersky Next XDR Expert components, and the DBMS
- 1 KUMA target host for installing the KUMA services
In this configuration, the DBMS does not require a separate node but should be installed manually on the target host before the Kaspersky Next XDR Expert deployment.
Page top
Multi-node deployment scheme
The figure below shows the Kaspersky Next XDR Expert deployment scheme on multiple nodes.
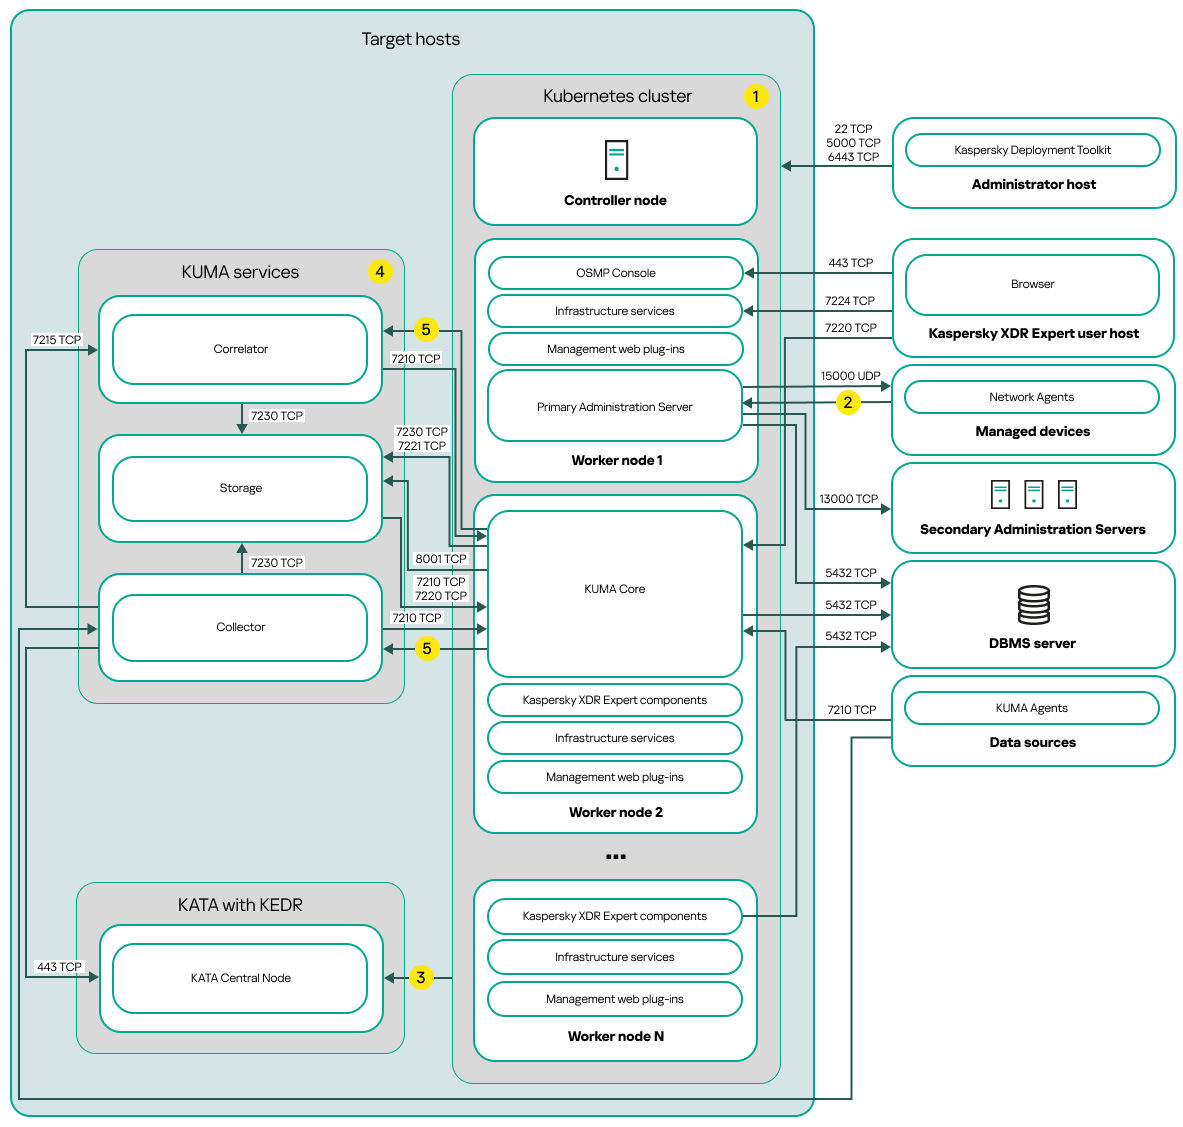
Multi-node deployment scheme of Kaspersky Next XDR Expert
The multi-node deployment scheme of Kaspersky Next XDR Expert contains the following main components:
- Administrator host. On this host, an administrator uses Kaspersky Deployment Toolkit to deploy and manage the Kubernetes cluster and Kaspersky Next XDR Expert. The administrator host is not included in the Kubernetes cluster.
- Kubernetes cluster. A Kubernetes cluster includes the controller node (also referred to as primary node during the deployment procedure) and, at a minimum, three worker nodes. The number of worker nodes may vary. On the scheme, the distribution of Kaspersky Next XDR Expert components among the worker nodes is shown as an example. Actual component distribution may vary.
- DBMS server. A server with an installed database management system is required for the proper function of Kaspersky Next XDR Expert components. An administrator installs the DBMS manually on the separated server outside the Kubernetes cluster.
- Hosts with KUMA services. The KUMA services (collectors, correlators, and storages) are installed on the hosts that are located outside the Kubernetes cluster. The number of target hosts for KUMA services may vary.
- KATA with KEDR. Kaspersky Anti Targeted Attack Platform with the Kaspersky Endpoint Detection and Response functional block. For details about KATA deployment scenarios, refer to the KATA documentation.
- Kaspersky Next XDR Expert user host. A user device that is used to sign in to OSMP Console or KUMA Console.
- Secondary Administration Servers (optional). Secondary Administration Servers are used to create a Server hierarchy.
- Managed devices. Client devices protected by Kaspersky Next XDR Expert. Each managed device has Network Agent installed.
Ports
The scheme does not provide all of the ports required for successful deployment. For the full list of ports, refer to the Ports used by Kaspersky Next XDR Expert section.
Scheme legend:
![]() On the scheme, the communication within the Kubernetes cluster between hosts and between Kaspersky Next XDR Expert components is not shown. For details, refer to the Ports used by Kaspersky Next XDR Expert section.
On the scheme, the communication within the Kubernetes cluster between hosts and between Kaspersky Next XDR Expert components is not shown. For details, refer to the Ports used by Kaspersky Next XDR Expert section.
![]() For the list of ports that must be opened on the managed devices, refer to the Ports used by Kaspersky Next XDR Expert section.
For the list of ports that must be opened on the managed devices, refer to the Ports used by Kaspersky Next XDR Expert section.
![]() For details about integration with KATA, including KEDR functional block, refer to the Integration with KATA/KEDR section.
For details about integration with KATA, including KEDR functional block, refer to the Integration with KATA/KEDR section.
![]() On the scheme, the KUMA services are deployed according to the multi-node deployment scheme. The number of target hosts for KUMA services may vary. The list of ports to be opened depends on the selected deployment scheme. For the full list of ports, refer to the Ports used by Kaspersky Next XDR Expert section.
On the scheme, the KUMA services are deployed according to the multi-node deployment scheme. The number of target hosts for KUMA services may vary. The list of ports to be opened depends on the selected deployment scheme. For the full list of ports, refer to the Ports used by Kaspersky Next XDR Expert section.
![]() Port TCP 7221 and other ports to install services. You specify these ports as a value for --api.point <port>.
Port TCP 7221 and other ports to install services. You specify these ports as a value for --api.point <port>.
Single-node deployment scheme
The figure below shows the Kaspersky Next XDR Expert deployment scheme on a single node.

Single-node deployment scheme of Kaspersky Next XDR Expert
The single-node deployment scheme of Kaspersky Next XDR Expert contains the following main components:
- Administrator host. On this host, an administrator uses Kaspersky Deployment Toolkit to deploy and manage the Kubernetes cluster and Kaspersky Next XDR Expert. The administrator host is not included in the Kubernetes cluster.
- Kubernetes cluster. A Kubernetes cluster includes the host that acts both as a controller node (also referred to as primary node during the deployment procedure) and a worker node.
- DBMS server. A server with an installed database management system is required for the proper function of Kaspersky Next XDR Expert components. The DBMS server is not included in the Kubernetes cluster. An administrator installs the DBMS manually on the target host that will act as a primary worker node before the Kaspersky Next XDR Expert deployment.
- Hosts with KUMA services. The KUMA services (collectors, correlators, and storages) are installed on the hosts that are located outside the Kubernetes cluster. The number of target hosts for KUMA services may vary.
- KATA with KEDR. Kaspersky Anti Targeted Attack Platform with the Kaspersky Endpoint Detection and Response functional block. For details about KATA deployment scenarios, refer to the KATA documentation.
- Kaspersky Next XDR Expert user host. A user device that is used to sign in to OSMP Console or KUMA Console.
- Secondary Administration Servers (optional). Secondary Administration Servers are used to create a Server hierarchy.
- Managed devices. Client devices protected by Kaspersky Next XDR Expert. Each managed device has Network Agent installed.
Ports
The scheme does not provide all of the ports required for successful deployment. For the full list of ports, refer to the Ports used by Kaspersky Next XDR Expert section.
Scheme legend:
![]() For the list of ports that must be opened on the managed devices, refer to the Ports used by Kaspersky Next XDR Expert section.
For the list of ports that must be opened on the managed devices, refer to the Ports used by Kaspersky Next XDR Expert section.
![]() For details about integration with KATA, including KEDR functional block, refer to the Integration with KATA/KEDR section.
For details about integration with KATA, including KEDR functional block, refer to the Integration with KATA/KEDR section.
![]() On the scheme, the KUMA services are deployed according to the multi-node deployment scheme. The number of target hosts for KUMA services may vary. The list of ports to be opened depends on the selected deployment scheme. For the full list of ports, refer to the Ports used by Kaspersky Next XDR Expert section.
On the scheme, the KUMA services are deployed according to the multi-node deployment scheme. The number of target hosts for KUMA services may vary. The list of ports to be opened depends on the selected deployment scheme. For the full list of ports, refer to the Ports used by Kaspersky Next XDR Expert section.
![]() Port TCP 7221 and other ports to install services. You specify these ports as a value for --api.point <port>.
Port TCP 7221 and other ports to install services. You specify these ports as a value for --api.point <port>.
Ports used by Kaspersky Next XDR Expert
For correct interaction between the administrator host and target hosts, you must provide connection access from the administrator host to the target hosts by the ports listed in the table below. These ports cannot be changed.
For interaction between the administrator host and hosts that are used for the installation of the KUMA services and are located outside the Kubernetes cluster, you must provide access only by TCP 22 port.
Ports used for interaction between the administrator host and target hosts
Port |
Protocol |
Port purpose |
|---|---|---|
22 |
TCP |
Providing the SSH connection from the administrator host to the target hosts. Providing the SSH connection from the administrator host to the hosts that are used for the installation of the external KUMA services. |
5000 |
TCP |
Connection to the Docker registry. |
6443 |
TCP |
Connection to the Kubernetes API. |
For properly work of the Kaspersky Next XDR Expert components, the target hosts must be located in the same broadcast domain.
The table below contains the ports that must be opened on the firewalls of all target hosts of the cluster. These ports cannot be changed.
If you use the firewalld or UFW firewall on your target hosts, KDT opens the required ports on the firewalls automatically. Otherwise, you can open the listed ports manually before you deploy Kaspersky Next XDR Expert.
Required ports used by the Kaspersky Next XDR Expert components
Port |
Protocol |
Port purpose |
|---|---|---|
80 |
TCP (HTTP) |
Receiving connections from browser. Redirecting to the 443 TCP (HTTPS) port. |
443 |
TCP (HTTPS) |
Receiving connections from browser. Receiving connections to the Administration Server over OpenAPI. Used to automate scenarios for working with the Administration Server. |
13000 |
TCP |
Receiving connections from Network Agents and secondary Administration Servers. |
13000 |
UDP |
Receiving information about devices that were turned off from Network Agents. |
14000 |
TCP |
Receiving connections from Network Agents. |
17000 |
TCP |
Receiving connections for application activation from managed devices (except for mobile devices). |
7210 |
TCP |
Receiving of the KUMA configuration from the KUMA Core server. |
7220 |
TCP |
Receiving connections from browser. |
7222 |
TCP |
Reversing proxy in the CyberTrace system. |
7224 |
TCP |
Callbacks for Identity and Access Manager (IAM). |
The table below contains the ports that are not opened by default on the firewalls during the Kaspersky Next XDR Expert deployment. These ports cannot be changed.
If you need to perform actions listed in the Port purpose column of the table below, you can open the corresponding ports on the firewalls of all target hosts manually.
Optional ports on the firewall used by the Kaspersky Next XDR Expert components
Port |
Protocol |
Port purpose |
|---|---|---|
8060 |
TCP |
Transmitting published installation packages to client devices. |
8061 |
TCP |
Transmitting published installation packages to client devices. |
13111 |
TCP |
Receiving requests from managed devices to KSN proxy server. |
15111 |
UDP |
Receiving requests from managed devices to KSN proxy server. |
17111 |
TCP |
Receiving requests from managed devices to KSN proxy server. |
5432 |
TCP |
Interaction with the DBMS (PostgreSQL). This port is used only if you perform the demonstration deployment and install the DBMS on the target host inside the Kubernetes cluster. |
The table below contains the ports that must be opened for functioning of the Kubernetes cluster and infrastructure components. These ports cannot be changed.
If you use the firewalld or UFW firewall on your target hosts, the KDT opens the required ports on the firewalls automatically. Otherwise, you can open the listed ports manually before you deploy Kaspersky Next XDR Expert.
Ports used by the Kubernetes cluster and infrastructure components
Port |
Protocol |
Node |
|---|---|---|
80 |
TCP |
Primary node |
443 |
TCP |
Primary node |
10250 |
TCP |
Primary node |
9443 |
TCP |
Primary node |
6443 |
TCP |
Primary node |
8132 |
TCP |
Primary node |
5000 |
TCP |
Primary node |
80 |
TCP |
Worker node |
443 |
TCP |
Worker node |
179 |
TCP |
Worker node |
10250 |
TCP |
Worker node |
10255 |
TCP |
Worker node |
9443 |
TCP |
Worker node |
6443 |
TCP |
Worker node |
9500 |
TCP |
Worker node |
9501 |
TCP |
Worker node |
9502 |
TCP |
Worker node |
9503 |
TCP |
Worker node |
8500 |
TCP |
Worker node |
8501 |
TCP |
Worker node |
3260 |
TCP |
Worker node |
8000 |
TCP |
Worker node |
8002 |
TCP |
Worker node |
2049 |
TCP |
Worker node |
3370 |
TCP |
Worker node |
179 |
UDP |
Worker node |
51820 |
UDP |
Worker node |
51821 |
UDP |
Worker node |
For correct work of the KUMA services that are not included in a Kubernetes cluster, you must open the ports listed in the table below. The table below shows the default network ports values. These ports automatically open during the KUMA installation.
Ports used for the interaction with the external KUMA services
Port |
Protocol |
Direction |
Destination of the connection |
|---|---|---|---|
8123 |
HTTPS |
From the storage service to the ClickHouse cluster node. |
Writing and receiving normalized events in the ClickHouse cluster. |
9009 |
HTTPS |
Between ClickHouse cluster replicas. |
Internal communication between ClickHouse cluster replicas for transferring data of the cluster. |
2181 |
TCP |
From ClickHouse cluster nodes to the ClickHouse keeper replication coordination service. |
Receiving and writing of replication metadata by replicas of ClickHouse servers. |
2182 |
TCP |
From one ClickHouse keeper replication coordination service to another. |
Internal communication between replication coordination services to reach a quorum. |
8001 |
TCP |
From Victoria Metrics to the ClickHouse server. |
Receiving ClickHouse server operation metrics. |
9000 |
TCP |
From the ClickHouse client to the ClickHouse cluster node. |
Writing and receiving data in the ClickHouse cluster. |
If you create an additional KUMA service (collector, correlator or storage) on a server, you need to manually open a port that corresponds to the created service on the server. You can use port TCP 7221 or other port used for service installation.
If the out of the box example services are used, the following ports automatically open during the Kaspersky Next XDR Expert deployment:
- 7230 TCP
- 7231 TCP
- 7232 TCP
- 7233 TCP
- 7234 TCP
- 7235 TCP
- 5140 TCP
- 5140 UDP
- 5141 TCP
- 5144 UDP
Preparation work and deployment
This section describes how to prepare the infrastructure for the Kaspersky Next XDR Expert deployment, set the installation parameters that are specific for the multi-node or single-node deployment, as well as how to use the Configuration wizard to generate the configuration file.
You will find out how to install Kaspersky Next XDR Expert according to the multi-node and single-node deployment schemes. Also, this section contains information on how to deploy multiple Kubernetes clusters with Kaspersky Next XDR Expert instances and switch between them by using KDT.
Multi-node deployment: Preparing the administrator and target hosts
Preparing for a multi-node deployment includes configuring the administrator and target hosts. After preparing hosts and specifying the configuration file, you will be able to deploy Kaspersky Next XDR Expert on target hosts by using KDT.
Preparing the administrator host
You first need to prepare a device that will act as the administrator host from which KDT will launch. This host can be either included in the Kubernetes cluster that is created by KDT during the deployment or not. If the administrator host is not included in the cluster, it will be used only to deploy and manage the Kubernetes cluster and Kaspersky Next XDR Expert. If the administrator host is included in the cluster, it will also act as a target host that is used for operation of Kaspersky Next XDR Expert components.
To prepare the administrator host:
- Make sure that the hardware and software on the administrator host meet the requirements for KDT.
- Allocate at least 10 GB of free space in the temporary files directory (/
tmp) for KDT. If you do not have enough free space in this directory, run the following command to specify the path to another directory:export TMPDIR=<new_directory>/tmp - Install the package for Docker version 23 or later, and then perform the post-installation steps to configure the administration host for proper functioning with Docker.
Do not install unofficial distributions of Docker packages from the operating system maintainer repositories.
- For the administrator host that will be included in the cluster, perform additional preparatory steps.
Preparing the target hosts
The target hosts are physical or virtual machines that are used to deploy Kaspersky Next XDR Expert and included in the Kubernetes cluster. Kaspersky Next XDR Expert components work on these hosts.
One of the target hosts can be used as administrator host. In this case, you must prepare this host as the administrator host, as described in the previous procedure, and then perform the preparing for the target host.
A minimum cluster configuration for the multi-node deployment includes four nodes:
- One primary node
The primary node is intended for managing the cluster, storing metadata, and distributing the workload.
- Three worker nodes
The worker nodes are intended for performing the workload of the Kaspersky Next XDR Expert components.
For optimal workload distribution between nodes, it is recommended to use nodes with approximately the same performance.
You can install the DBMS inside the Kubernetes cluster when you perform the demonstration deployment of Kaspersky Next XDR Expert. In this case, allocate the additional worker node for the DBMS installation. KDT will install the DBMS during the Kaspersky Next XDR Expert deployment.
For the multi-node deployment, we recommend installing a DBMS on a separate server outside the cluster. After you deploy Kaspersky Next XDR Expert, changing the DBMS installed inside the cluster to a DBMS installed on a separate server is not available. You have to remove all Kaspersky Next XDR Expert components, and then install Kaspersky Next XDR Expert again. In this case, the data will be lost.
To prepare the target hosts:
- Make sure that the hardware and software on the target hosts meet the requirements for the multi-node deployment, and the target hosts are located in the same broadcast domain.
For proper functioning of Kaspersky Next XDR Expert, the Linux kernel version must be 5.15.0.107 or later on the target hosts with the Ubuntu family operating systems.
Docker must not be installed on the target hosts, except the target host that will be used as the administrator host. KDT will install all necessary software and dependencies during the deployment.
- On each target host, install the sudo package, if this package is not already installed. For Debian family operating systems, install the UFW package on the target hosts.
- On each target host, configure the /etc/environment file. If your organization's infrastructure uses a proxy server to access the internet, connect the target hosts to the internet.
- On the primary node with the UFW configuration, allow IP forwarding. In the
/etc/default/ufwfile, setDEFAULT_FORWARD_POLICYtoACCEPT. - Provide access to the package repository. This repository stores the following packages required for Kaspersky Next XDR Expert:
- nfs-common
- tar
- iscsi-package
- wireguard
- wireguard-tools
KDT will try to install these packages during the deployment from the package repository. You can also install these packages manually.
- For the primary node, ensure that the curl package is installed.
- For the worker nodes, ensure that the libnfs package version 12 or later is installed.
The curl and libnfs packages are not installed during the deployment from the package repository by using KDT. You must install these packages manually, if they are not already installed.
- Reserve static IP addresses for the target hosts, for the Kubernetes cluster gateway, and for the DBMS host (if the DBMS is installed inside the cluster).
The Kubernetes cluster gateway is intended for connecting to the Kaspersky Next XDR Expert components installed inside the Kubernetes cluster. The gateway IP address is specified in the configuration file.
For standard usage of the solution, when you install the DBMS on a separate server, the gateway IP address is an IP address in CIDR notation that contains the subnet mask /32 (for example, 192.168.0.0/32).
For demonstration purposes, when you install the DBMS inside the Kubernetes cluster, the gateway IP address is an IP range (for example, 192.168.0.1—192.168.0.2).
Make sure that the target hosts, the Kubernetes cluster gateway, and the DBMS host are located in the same broadcast domain.
- On your DNS server, register the service FQDNs to connect to the Kaspersky Next XDR Expert services.
By default, the Kaspersky Next XDR Expert services are available at the following addresses:
- <console_host>.<smp_domain>—Access to the OSMP Console interface.
- <admsrv_host>.<smp_domain>—Interaction with Administration Server.
- <kuma_host>.<smp_domain>—Access to the KUMA Console interface.
- <api_host>.<smp_domain>—Access to the Kaspersky Next XDR Expert API.
- <psql_host>.<smp_domain>—Interaction with the DBMS (PostgreSQL).
Where <console_host>, <admsrv_host>, <kuma_host>, <api_host>, and <psql_host> are service host names, <smp_domain> is a service domain name. These parameters are parts of the service FQDNs, which you can specify in the configuration file. If you do not specify custom values of service host names, the default values are used:
console_host—"console",admsrv_host—"admsrv",kuma_host—"kuma",api_host—"api",psql_host—"psql".Register the <psql_host>.<smp_domain> service FQDN if you installed the DBMS inside the Kubernetes cluster on the DBMS node and you need to connect to the DBMS.
Depending on where you want to install the DBMS, the listed service FQDNs must be resolved to the IP address of the Kubernetes cluster as follows:
- DBMS on a separate server (standard usage)
In this case, the gateway IP address is the address of the Kaspersky Next XDR Expert services (excluding the DBMS IP address). For example, if the gateway IP address is 192.168.0.0/32, the service FQDNs must be resolved as follows:
- <console_host>.<smp_domain>—192.168.0.0/32
- <admsrv_host>.<smp_domain>—192.168.0.0/32
- <kuma_host>.<smp_domain>—192.168.0.0/32
- <api_host>.<smp_domain>—192.168.0.0/32
- DBMS inside the Kubernetes cluster (demonstration deployment)
In this case, the gateway IP address is an IP range. The first IP address of the range is the address of the Kaspersky Next XDR Expert services (excluding the DBMS IP address), and the second IP address of the range is the IP address of the DBMS. For example, if the gateway IP range is 192.168.0.1—192.168.0.2, the service FQDNs must be resolved as follows:
- <console_host>.<smp_domain>—192.168.0.1
- <admsrv_host>.<smp_domain>—192.168.0.1
- <kuma_host>.<smp_domain>—192.168.0.1
- <api_host>.<smp_domain>—192.168.0.1
- <psql_host>.<smp_domain>—192.168.0.2
- On the target hosts, create the accounts that will be used for the Kaspersky Next XDR Expert deployment.
These accounts are used for the SSH connection and must be able to elevate privileges (sudo) without entering a password. To do this, add the created user accounts to the
/etc/sudoersfile. - Configure the SSH connection between the administrator and target hosts:
- On the administrator host, generate SSH keys by using the ssh-keygen utility without a passphrase.
- Copy the public key to every target host (for example, to the
/home/<user_name>/.sshdirectory) by using the ssh-copy-id utility.If you use a target host as the administrator host, you must copy the public key to it, too.
- For proper function of the Kaspersky Next XDR Expert components, provide network access between the target hosts and open the required ports on the firewall of the administrator and target hosts, if necessary.
- Configure time synchronization over Network Time Protocol (NTP) on the administrator and target hosts.
- If necessary, prepare custom certificates for working with Kaspersky Next XDR Expert public services.
You can use one intermediate certificate that is issued off the organization's root certificate or leaf certificates for each of the services. The prepared custom certificates will be used instead of self-signed certificates.
Single node deployment: Preparing the administrator and target hosts
Preparing for a single-node deployment includes configuring the administrator and target hosts. In the single-node configuration, the Kubernetes cluster and Kaspersky Next XDR Expert components are installed on one target host. After preparing the target host and specifying the configuration file, you will be able to deploy Kaspersky Next XDR Expert on the target host by using KDT.
Preparing the administrator host
You first need to prepare a device that will act as the administrator host from which KDT will launch. This host can be either included in the Kubernetes cluster that is created by KDT during the deployment or not. If the administrator host is not included in the cluster, it will be used only to deploy and manage the Kubernetes cluster and Kaspersky Next XDR Expert. If the administrator host is included in the cluster, it will also act as a target host that is used for operation of Kaspersky Next XDR Expert components. In this case, only one host will be used for deployment and operation of the solution.
To prepare the administrator host:
- Make sure that the hardware and software on the administrator host meet the requirements for KDT.
- Allocate at least 10 GB of free space in the temporary files directory (/
tmp) for KDT. If you do not have enough free space in this directory, run the following command to specify the path to another directory:export TMPDIR=<new_directory>/tmp - Install the package for Docker version 23 or later, and then perform the post-installation steps to configure the administration host for proper functioning with Docker.
Do not install unofficial distributions of Docker packages from the operating system maintainer repositories.
- For the administrator host that will be included in the cluster, perform additional preparatory steps.
Preparing the target host
The target host is a physical or virtual machine that is used to deploy Kaspersky Next XDR Expert and included in the Kubernetes cluster. The target host manages the Kubernetes cluster, stores metadata, as well as the Kaspersky Next XDR Expert components work on this host. A minimum cluster configuration for the single-node deployment includes one target host, which acts as the primary and worker nodes. On this primary worker node, the Kubernetes cluster and Kaspersky Next XDR Expert components are installed.
For standard usage, you have to install the DBMS manually on the target host before the deployment. In this case, the DBMS will be installed on the target host, but not included in the Kubernetes cluster. For demonstration purposes, you can install the DBMS inside the cluster by using KDT during the deployment.
If you want to run the Kaspersky Next XDR Expert deployment from the target host, you must prepare this host as the administrator host, as described in the previous procedure, and then perform the preparing for the target host.
To prepare the target host:
- Make sure that the hardware and software on the target host meet the requirements for the single-node deployment.
For proper functioning of Kaspersky Next XDR Expert, the Linux kernel version must be 5.15.0.107 or later on the target host with the Ubuntu family operating systems
Do not install Docker on the target host unless the target host will be used as the administrator host. KDT will install all necessary software and dependencies during the deployment.
- Install the sudo package, if this package is not already installed. For Debian family operating systems, install the UFW package.
- Configure the /etc/environment file. If your organization's infrastructure uses a proxy server to access the internet, you also need to connect the target host to the internet.
- If the primary worker node has the UFW configuration, allow IP forwarding. In the
/etc/default/ufwfile, setDEFAULT_FORWARD_POLICYtoACCEPT. - Provide access to the package repository. This repository stores the following packages required for Kaspersky Next XDR Expert:
- nfs-common
- tar
- iscsi-package
- wireguard
- wireguard-tools
KDT will try to install these packages during the deployment from the package repository. You can also install these packages manually.
- Ensure that the curl and libnfs packages are installed on the primary worker node.
The curl and libnfs packages are not installed during the deployment from the package repository by using KDT. You must install these packages manually, if they are not already installed. The libnfs package version 12 and later is used.
- Reserve static IP addresses for the target host and for the Kubernetes cluster gateway.
The Kubernetes cluster gateway is intended for connecting to the Kaspersky Next XDR Expert components installed inside the Kubernetes cluster.
For standard usage of the solution, when you install the DBMS on the target host outside the cluster, the gateway IP address is an IP address in CIDR notation that contains the subnet mask /32 (for example, 192.168.0.0/32).
For demonstration purposes, when you install the DBMS inside the Kubernetes cluster, the gateway IP address is an IP range (for example, 192.168.0.1—192.168.0.2).
Make sure that the target host and the Kubernetes cluster gateway are located in the same broadcast domain.
- On your DNS server, register the service FQDNs to connect to the Kaspersky Next XDR Expert services.
By default, the Kaspersky Next XDR Expert services are available at the following addresses:
- <console_host>.<smp_domain>—Access to the OSMP Console interface.
- <admsrv_host>.<smp_domain>—Interaction with Administration Server.
- <kuma_host>.<smp_domain>—Access to the KUMA Console interface.
- <api_host>.<smp_domain>—Access to the Kaspersky Next XDR Expert API.
- <psql_host>.<smp_domain>—Interaction with the DBMS (PostgreSQL).
Where <console_host>, <admsrv_host>, <kuma_host>, <api_host>, and <psql_host> are service host names, <smp_domain> is a service domain name. These parameters are parts of the service FQDNs, which you can specify in the configuration file. If you do not specify custom values of service host names, the default values are used:
console_host—"console",admsrv_host—"admsrv",kuma_host—"kuma",api_host—"api",psql_host—"psql".Register the <psql_host>.<smp_domain> service FQDN if you installed the DBMS inside the Kubernetes cluster on the DBMS node and you need to connect to the DBMS.
Depending on where you want to install the DBMS, the listed service FQDNs must be resolved to the IP address of the Kubernetes cluster as follows:
- DBMS on the target host outside the Kubernetes cluster (standard usage)
In this case, the gateway IP address is the address of the Kaspersky Next XDR Expert services (excluding the DBMS IP address). For example, if the gateway IP address is 192.168.0.0/32, the service FQDNs must be resolved as follows:
- <console_host>.<smp_domain>—192.168.0.0/32
- <admsrv_host>.<smp_domain>—192.168.0.0/32
- <kuma_host>.<smp_domain>—192.168.0.0/32
- <api_host>.<smp_domain>—192.168.0.0/32
- DBMS inside the Kubernetes cluster (demonstration deployment)
In this case, the gateway IP address is an IP range. The first IP address of the range is the address of the Kaspersky Next XDR Expert services (excluding the DBMS IP address), and the second IP address of the range is the IP address of the DBMS. For example, if the gateway IP range is 192.168.0.1—192.168.0.2, the service FQDNs must be resolved as follows:
- <console_host>.<smp_domain>—192.168.0.1
- <admsrv_host>.<smp_domain>—192.168.0.1
- <kuma_host>.<smp_domain>—192.168.0.1
- <api_host>.<smp_domain>—192.168.0.1
- <psql_host>.<smp_domain>—192.168.0.2
- Create the user accounts that will be used for the Kaspersky Next XDR Expert deployment.
These accounts are used for the SSH connection and must be able to elevate privileges (sudo) without entering a password. To do this, add the created user accounts to the
/etc/sudoersfile. - Configure the SSH connection between the administrator and target hosts:
- On the administrator host, generate SSH keys by using the ssh-keygen utility without a passphrase.
- Copy the public key to the target host (for example, to the
/home/<user_name>/.sshdirectory) by using the ssh-copy-id utility.If you use the target host as the administrator host, you must copy the public key to it, too.
- For proper function of the Kaspersky Next XDR Expert components, open the required ports on the firewall of the administrator and target hosts, if necessary.
- Configure time synchronization over Network Time Protocol (NTP) on the administrator and target hosts.
- If necessary, prepare custom certificates for working with Kaspersky Next XDR Expert public services.
You can use one intermediate certificate that is issued off the organization's root certificate or leaf certificates for each of the services. The prepared custom certificates will be used instead of self-signed certificates.
Preparing the hosts for installation of the KUMA services
The KUMA services (collectors, correlators, and storages) are installed on the KUMA target hosts that are located outside the Kubernetes cluster.
Access to KUMA services is performed by using the KUMA target host FQDNs. The administrator host must be able to access the KUMA target hosts by its FQDNs.
To prepare the KUMA target hosts for installation of the KUMA services:
- Ensure that the hardware, software, and installation requirements are met.
- Specify the host names.
You must specify the FQDN, for example: kuma1.example.com.
We do not recommend changing the KUMA host name after installation. This will make it impossible to verify the authenticity of certificates and will disrupt the network communication between the application components.
- Run the following commands:
hostname -fhostnamectl statusCompare the output of the
hostname -fcommand and the value of theStatic hostnamefield in thehostnamectl statuscommand output. These values must match the FQDN of the device. - Configure the SSH connection between the administrator host and KUMA target hosts.
Use the SSH keys created for the target hosts. Copy the public key to the KUMA target hosts by using the ssh-copy-id utility.
- Register the KUMA target hosts in your organization's DNS zone, to allow host names to be translated to IP addresses.
- Ensure time synchronization over Network Time Protocol (NTP) is configured on all KUMA target hosts.
The hosts are ready for installation of the KUMA services.
Page top
Installing a database management system
Kaspersky Next XDR Expert supports PostgreSQL or Postgres Pro database management systems (DBMS). For the full list of supported DBMSs, refer to the Hardware and software requirements.
Each of the following Kaspersky Next XDR Expert components requires a database:
- Administration Server
- Automation Platform
- Incident Response Platform (IRP)
- Identity and Access Manager (IAM)
Each of the components must have a separate database within the same instance of DBMS. We recommend that you install the DBMS instance outside the Kubernetes cluster.
For the DBMS installation, KDT requires a privileged DBMS account that has permissions to create databases and other DBMS accounts. KDT uses this privileged DBMS account to create the databases and other DBMS accounts required for the Kaspersky Next XDR Expert components.
For information about how to install the selected DBMS, refer to its documentation.
After you install the DBMS, you need to configure the DBMS server parameters to optimize the DBMS work with Open Single Management Platform.
Page top
Configuring the PostgreSQL or Postgres Pro server for working with Open Single Management Platform
Kaspersky Next XDR Expert supports PostgreSQL or Postgres Pro database management systems (DBMS). For the full list of supported DBMSs, refer to the Hardware and software requirements. Consider configuring the DBMS server parameters to optimize the DBMS work with Administration Server.
The default path to the configuration file is: /etc/postgresql/<VERSION>/main/postgresql.conf
Recommended parameters for PostgreSQL and Postgres Pro DBMS for work with Administration Server:
shared_buffers =25% of the RAM value of the device where the DBMS is installedIf RAM is less than 1 GB, then leave the default value.
max_stack_depth =If the DBMS is installed on a Linux device: maximum stack size (execute the 'ulimit -s' command to obtain this value in KB) minus the 1 MB safety marginIf the DBMS is installed on a Windows device, then leave the default value 2 MB.
temp_buffers =24MBwork_mem =16MBmax_connections =220This is a minimum recommended value, you can specify a larger one.
max_parallel_workers_per_gather =0maintenance_work_mem =128MB
Reload configuration or restart the server after updating the postgresql.conf file. Refer to the PostgreSQL documentation for details.
If you use a cluster Postgres DBMS, specify the max_connections parameter for all DBMS servers as well as in the cluster configuration.
If you use Postgres Pro 15.7 or Postgres Pro 15.7.1, disable the enable_compound_index_stats parameter:
enable_compound_index_stats = off
For detailed information about PostgreSQL and Postgres Pro server parameters and on how to specify the parameters, refer to the corresponding DBMS documentation.
Preparing the KUMA inventory file
The KUMA inventory file is a file in the YAML format that contains installation parameters for deployment of the KUMA services that are not included in the Kubernetes cluster. The path to the KUMA inventory file is included in the configuration file that is used by Kaspersky Deployment Toolkit for the Kaspersky Next XDR Expert deployment.
The templates of the KUMA inventory file are located in the distribution package. If you want to install the KUMA services (storage, collector, and correlator) on one host, use the single.inventory.yaml file. To install the services on several hosts in the network infrastructure, use the distributed.inventory.yaml file.
We recommend backing up the KUMA inventory file that you used to install the KUMA services. You can use it to remove KUMA.
To prepare the KUMA inventory file,
Open the KUMA inventory file template located in the distribution package, and then edit the variables in the inventory file.
The KUMA inventory file contains the following blocks:
allblockThe
allblock contains the variables that are applied to all hosts specified in the inventory file. The variables are located in thevarssection.kumablockThe
kumablock contains the variables that are applied to hosts on which the KUMA services will be installed. These hosts are listed in thekumablock in thechildrensection. The variables are located in thevarssection.
The following table lists possible variables, their descriptions, possible values, and blocks of the KUMA inventory file where these variables can be located.
List of possible variables in the vars section
Variable |
Description |
Possible values |
Block |
Variables located in the |
|||
|
Method used to connect to the KUMA service hosts. |
To provide the correct installation of the KUMA services, in the In the |
|
|
User name used to connect to KUMA service hosts to install external KUMA services. |
If the root user is blocked on the target hosts, specify a user name that has the right to establish SSH connections and elevate privileges by using su or sudo. To provide the correct installation of the KUMA services, in the In the |
|
|
Variable used to indicate the creation of predefined services during installation. |
|
|
|
Variable used to indicate the need to increase the privileges of the user account that is used to install KUMA components. |
|
|
|
Method used for increasing the privileges of the user account that is used to install KUMA components. |
|
|
Variables located in the |
|||
|
Group of hosts used for storing the service files and utilities of KUMA. A host can be included in the During the Kaspersky Next XDR Expert deployment, on the hosts that are included in
|
The group of hosts contains the |
|
|
Group of KUMA collector hosts. This group can contain multiple hosts. |
The group of KUMA collector hosts contains the |
|
|
Group of KUMA correlator hosts. This group can contain multiple hosts. |
The group of KUMA correlator hosts contains the |
|
|
Group of KUMA storage hosts. This group can contain multiple hosts. |
The group of KUMA storage hosts contains the In this group, you can also specify the storage structure if you install the example services during the demonstration deployment ( |
|
Multi-node deployment: Specifying the installation parameters
The configuration file is a file in the YAML format and contains a set of installation parameters for the Kaspersky Next XDR Expert components.
The installation parameters listed in the tables below are required for the multi-node deployment of Kaspersky Next XDR Expert. To deploy Kaspersky Next XDR Expert on a single node, use the configuration file that contains the installation parameters specific for the single-node deployment.
The template of the configuration file (multinode.smp_param.yaml.template) is located in the distribution package in the archive with the KDT utility. You can fill out the configuration file template manually; or use the Configuration wizard to specify the installation parameters that are required for the Kaspersky Next XDR Expert deployment, and then generate the configuration file.
Not all of the parameters listed below are included in the configuration file template. This template contains only those parameters that must be specified before Kaspersky Next XDR Expert deployment. Remaining parameters are set to default values, and they are not included in the template. You can manually add these parameters to the configuration file to override its values.
For correct function of KDT with the configuration file, add an empty line at the end of the file.
The nodes section of the configuration file contains installation parameters for each target host of the Kubernetes cluster. These parameters are listed in the table below.
Nodes section
Parameter name |
Required |
Description |
|---|---|---|
|
Yes |
The name of the node. The node name must comply with the following rules:
|
|
Yes |
Possible parameter values:
|
|
Yes |
The IP address of the node. All nodes must be included in the same subnet. |
|
No |
The node type that specifies the Kaspersky Next XDR Expert component that will be installed on this node. Possible parameter values:
For Kaspersky Next XDR Expert to work correctly, we recommend that you select the node on which Administration Server will work. Also, you can select the node on which you want to install the DBMS. Specify the appropriate values of the |
|
Yes |
The user name of the account created on the target host and used for connection to the node by KDT. The user name must comply with the following rules:
|
|
Yes |
The path to the private part of the SSH key located on the administrator host and used for connection to the node by KDT. |
Other installation parameters are listed in the parameters section of the configuration file and are described in the table below.
Parameters section
Parameter name |
Required |
Description |
|---|---|---|
|
Yes |
The connection string for accessing the DBMS that is installed and configured on a separate server. Specify this parameter as follows:
The Symbols that must be replaced in the
Refer to the PostgreSQL connection string article for details. If the For standard usage of the solution, install a DBMS on a separate server outside the cluster. |
|
Yes |
The language of the OSMP Console interface specified by default. After installation, you can change the OSMP Console language. Possible parameter values:
|
|
Yes |
The reserved static IP address of the Kubernetes cluster gateway. The gateway must be included in the same subnet as all cluster nodes. For standard usage of the solution, when you install the DBMS on a separate server, specify the gateway IP address as an IP address in CIDR notation that contains the subnet mask /32. For demonstration purposes, when you install the DBMS inside the cluster, set the gateway IP address to an IP range in the format |
|
Yes |
The path to the private part of the SSH key located on the administrator host and used for connection to the cluster nodes and nodes with the KUMA services (collectors, correlators, and storages) by using KDT. |
|
Yes |
The The Main administrator role is assigned to this user account. The password must comply with the following rules:
When you specify the
Example: the user account password |
|
No |
The parameter indicating that Kaspersky Next XDR Expert is installed on the target host with limited computing resources. Set the Possible parameter values:
|
|
Yes |
The parameter that specifies the amount of disk space for the operation of KUMA Core. This parameter is used only if the |
|
Yes |
The path to the KUMA inventory file located on the administrator host. The inventory file contains the installation parameters for deployment of the KUMA services that are not included in the Kubernetes cluster. |
|
No |
The path to the additional KUMA inventory file located on the administrator host. This file contains the installation parameters used to partially add or remove hosts with the KUMA services. If you perform an initial deployment of Kaspersky Next XDR Expert or run a custom action that requires configuration file, leave the default parameter value ( |
|
Yes |
The path to the license key of KUMA Core. |
|
Yes |
The host name that is used in the FQDNs of the public Kaspersky Next XDR Expert services. The service host name and domain name (the Default values of the parameters:
|
|
Yes |
The domain name that is used in the FQDNs of the public Kaspersky Next XDR Expert services. The service host name and domain name are parts of the service FQDN. For example, if the value of the |
|
Yes |
The list of host names of the public Kaspersky Next XDR Expert services for which a self-signed or custom certificate is to be generated. |
|
No |
The parameter that indicates whether to use the custom intermediate certificate instead of the self-signed certificates for the public Kaspersky Next XDR Expert services. The default value is Possible parameter values:
|
|
No |
The path to the custom intermediate certificate used to work with public Kaspersky Next XDR Expert services. Specify this parameter if the |
|
No |
The paths to the custom leaf certificates used to work with the public Kaspersky Next XDR Expert services: If you want to specify the leaf custom certificates, set the |
|
Yes |
The names of the secret files that are stored in the Kubernetes cluster. These names contain the domain name, which must match the |
|
Yes |
The amount of free disk space allocated to store the Administration Server data (updates, installation packages, and other internal service data). Measured in gigabytes, specified as "<amount>Gi". The required amount of free disk space depends on the number of managed devices and other parameters, and can be calculated. The minimum recommended value is 10 GB. |
|
Yes |
The amount of free disk space allocated to store metrics. Measured in gigabytes, specified as "<amount>GB". The minimum recommended value is 5 GB. |
|
No |
The username of the account used to view OSMP metrics through the Grafana tool. |
|
No |
The password of the account used to view OSMP metrics through the Grafana tool. |
|
Yes |
The amount of free disk space allocated to store OSMP logs. Measured in gigabytes, specified as "<amount>Gi". The minimum recommended value is 20 GB. |
|
Yes |
The storage period of OSMP logs after which logs are automatically removed. The default value is 72 hours (set the parameter value in the configuration file as "<time in hours>h". For example, "72h"). |
|
No |
The amount of free disk space allocated to store data of the component for working with response actions. Measured in gigabytes, specified as "<amount>Gi". The minimum recommended value is 20 GB. |
|
No |
The parameter that indicates whether to encrypt the traffic between the Kaspersky Next XDR Expert components and the DBMS by using the TLS protocol. If the DBMS is installed outside the cluster, TLS encryption is disabled by default. If the DBMS is installed inside the cluster (not for standard usage of the solution, only for demonstration purposes), TLS encryption must be disabled. Possible parameter values:
|
|
No |
The path to the PEM file that can contain the TLS certificate of the DBMS server or a root certificate from which the TLS server certificate can be issued. Specify the |
|
No |
The path to the PEM file that contains a certificate and a private key of the Kaspersky Next XDR Expert component. This certificate is used to establish the TLS connection between the Kaspersky Next XDR Expert components and the DBMS. Specify the |
|
No |
The parameter that indicates whether to use the proxy server to connect the Kaspersky Next XDR Expert components to the internet. If the host on which Kaspersky Next XDR Expert is installed has internet access, you can also provide internet access for the operation of Kaspersky Next XDR Expert components (for example, Administration Server) and for specific integrations, both Kaspersky and third-party. To establish the proxy connection, you must also specify the proxy server parameters in the Administration Server properties. The default value is Possible parameter values:
|
|
No |
The IP address of the proxy server. If the proxy server uses multiple IP addresses, specify these addresses separated by a space (for example, " |
|
No |
The number of the port through which the proxy connection will be established. Specify this parameter if the |
|
No |
The verbosity level of logs of the KUMA Core and KUMA services deployment that is performed by KDT. Possible parameter values:
As the number of "v" letters in the flag increases, logs become more detailed. If this parameter is not specified in the configuration file, the standard component installation logs are saved. |
|
No |
The number of files that you can attach to the incident. The default value is |
|
No |
The total size of files attached to the incident. Measured in bytes. Specified without units of measurement. The default value is |
|
No |
The parameter indicating whether to check the hardware, software, and network configuration of the Kubernetes cluster nodes for compliance with the prerequisites for installing the solution before the deployment. The default value is Possible parameter values:
|
Sample of the configuration file for the multi-node deployment of Kaspersky Next XDR Expert
Page top
Single-node deployment: Specifying the installation parameters
The configuration file used to deploy Kaspersky Next XDR Expert on a single node contains the installation parameters that are required both for the multi-node and single-node deployment. Also, this configuration file contains parameters specific only for the single-node deployment (vault_replicas, vault_ha_mode, vault_standalone, and default_сlass_replica_count).
The template of the configuration file (singlenode.smp_param.yaml.template) is located in the distribution package in the archive with the KDT utility. You can fill out the configuration file template manually; or use the Configuration wizard to specify the installation parameters that are required for the Kaspersky Next XDR Expert deployment, and then generate the configuration file.
Not all of the parameters listed below are included in the configuration file template. This template contains only those parameters that must be specified before Kaspersky Next XDR Expert deployment. The remaining parameters are set to default values, and they are not included in the template. You can manually add these parameters to the configuration file to override its values.
For correct function of KDT with the configuration file, add an empty line at the end of the file.
The nodes section of the configuration file contains the target host parameters that are listed in the table below.
Nodes section
Parameter name |
Required |
Description |
|---|---|---|
|
Yes |
The name of the node. |
|
Yes |
For the target host, set the |
|
Yes |
The IP address of the node. All nodes must be included in the same subnet. |
|
No |
The node type that specifies the Kaspersky Next XDR Expert component that will be installed on this node. For the single-node deployment, leave this parameter empty, because all components will be installed on a single node. |
|
Yes |
The username of the user account created on the target host and used for connection to the node by KDT. |
|
Yes |
The path to the private part of the SSH key located on the administrator host and used for connection to the node by KDT. |
Other installation parameters are listed in the parameters section of the configuration file and are described in the table below.
Parameters section
Parameter name |
Required |
Description |
|---|---|---|
|
Yes |
The connection string for accessing the DBMS that is installed and configured outside the Kubernetes cluster. Specify this parameter as follows:
where:
The Symbols that must be replaced in the
Refer to the PostgreSQL connection string article for details. If the For standard usage of the solution, install a DBMS on the target host outside the cluster. |
|
Yes |
The language of the OSMP Console interface specified by default. After installation, you can change the OSMP Console language. Possible parameter values: |
|
Yes |
The reserved static IP address of the Kubernetes cluster gateway. The gateway must be included in the same subnet as all cluster nodes. For standard usage of the solution, when you install the DBMS on the target host outside the cluster, the gateway IP address must contain the subnet mask /32. For demonstration purposes, when you install the DBMS inside the cluster, set the gateway IP address to an IP range in the format |
|
Yes |
The path to the private part of the SSH key located on the administrator host and used for connection to the cluster nodes and nodes with the KUMA services (collectors, correlators, and storages) by using KDT. |
|
Yes |
The The Main administrator role is assigned to this user account. The password must comply with the following rules:
When you specify the
Example: the user account password |
|
Yes |
The parameter that indicates that Kaspersky Next XDR Expert is installed on the target host with limited computing resources. Possible parameter values:
For the single-node deployment, set the |
|
Yes |
The number of replicas of the secret storage in the Kubernetes cluster. For the single-node deployment, set the |
|
Yes |
The parameter that indicates whether to run the secret storage in the High Availability (HA) mode. Possible parameter values:
For the single-node deployment, set the |
|
Yes |
The parameter that indicates whether to run the secret storage in the standalone mode. Possible parameter values:
For the single-node deployment, set the |
|
Yes |
The number of disk volumes that are used to store the service data of Kaspersky Next XDR Expert components and KDT. The default value is For the single-node deployment, set the |
|
Yes |
The parameter that specifies the amount of disk space for the operation of KUMA Core. This parameter is used only if the |
|
Yes |
The path to the KUMA inventory file located on the administrator host. The inventory file contains installation parameters for deployment of the KUMA services that are not included in the Kubernetes cluster. |
|
No |
The path to the additional KUMA inventory file located on the administrator host. This file contains the installation parameters used to partially add or remove hosts with the KUMA services. If you perform an initial deployment of Kaspersky Next XDR Expert or run a custom action that requires a configuration file, leave the default parameter value ( |
|
Yes |
The path to the license key of KUMA Core. |
|
Yes |
The host name that is used in the FQDNs of the public Kaspersky Next XDR Expert services. The service host name and domain name (the Default values of the parameters:
|
|
Yes |
The domain name that is used in the FQDNs of the public Kaspersky Next XDR Expert services. The service host name and domain name are parts of the service FQDN. For example, if the value of the |
|
Yes |
The list of host names of the public Kaspersky Next XDR Expert services for which a self-signed or custom certificate is to be generated. |
|
No |
The parameter that indicates whether to use the custom intermediate certificate instead of the self-signed certificates for the public Kaspersky Next XDR Expert services. The default value is Possible parameter values:
|
|
No |
The path to the custom intermediate certificate used to work with public Kaspersky Next XDR Expert services. Specify this parameter if the |
|
No |
The paths to the custom leaf certificates used to work with the corresponding public Kaspersky Next XDR Expert services: If you want to specify the leaf custom certificates, set the |
|
Yes |
The names of the secret files that are stored in the Kubernetes cluster. These names contain the domain name, which must match the |
|
Yes |
The amount of free disk space allocated to store the Administration Server data (updates, installation packages, and other internal service data). Measured in gigabytes, specified as "<amount>Gi". The required amount of free disk space depends on the number of managed devices and other parameters, and can be calculated. The minimum recommended value is 10 GB. |
|
Yes |
The amount of free disk space allocated to store metrics. Measured in gigabytes, specified as "<amount>GB". The minimum recommended value is 5 GB. |
|
No |
The username of the account used to view OSMP metrics through the Grafana tool. |
|
No |
The password of the account used to view OSMP metrics through the Grafana tool. |
|
Yes |
The amount of free disk space allocated to store OSMP logs. Measured in gigabytes, specified as "<amount>Gi". The minimum recommended value is 20 GB. |
|
Yes |
The storage period of OSMP logs after which logs are automatically removed. The default value is 72 hours (set the parameter value in the configuration file as "<time in hours>h". For example, "72h"). |
|
No |
The amount of free disk space allocated to store data of the component for working with response actions. Measured in gigabytes, specified as "<amount>Gi". The minimum recommended value is 20 GB. |
|
No |
The parameter that indicates whether to encrypt the traffic between the Kaspersky Next XDR Expert components and the DBMS by using the TLS protocol. If the DBMS is installed outside the cluster, TLS encryption is disabled by default. If the DBMS is installed inside the cluster (not for standard usage of the solution, only for demonstration purposes), TLS encryption must be disabled. Possible parameter values:
|
|
No |
The path to the PEM file that can contain the TLS certificate of the DBMS server or a root certificate from which the TLS server certificate can be issued. Specify the |
|
No |
The path to the PEM file that contains a certificate and a private key of the Kaspersky Next XDR Expert component. This certificate is used to establish the TLS connection between the Kaspersky Next XDR Expert components and the DBMS. Specify the |
|
No |
The parameter that indicates whether to use the proxy server to connect the Kaspersky Next XDR Expert components to the internet. If the host on which Kaspersky Next XDR Expert is installed has internet access, you can also provide internet access for operation of Kaspersky Next XDR Expert components (for example, Administration Server) and for specific integrations, both Kaspersky and third-party. To establish the proxy connection, you must also specify the proxy server parameters in the Administration Server properties. The default value is Possible parameter values:
|
|
No |
The IP address of the proxy server. If the proxy server uses multiple IP addresses, specify these addresses separated by a space (for example, " |
|
No |
The number of the port through which the proxy connection will be established. Specify this parameter if the |
|
No |
The trace level. The default value is Possible parameter values: 0–5. |
|
No |
The verbosity level of logs of the KUMA Core and KUMA services deployment that is performed by KDT. Possible parameter values:
As the number of "v" letters in the flag increases, logs become more detailed. If this parameter is not specified in the configuration file, the standard component installation logs are saved. |
|
No |
The number of files that you can attach to the incident. The default value is |
|
No |
The total size of files attached to the incident. Measured in bytes. Specified without units of measurement. The default value is |
|
No |
The parameter indicating whether to check the hardware, software, and network configuration of the Kubernetes cluster nodes for compliance with the prerequisites for installing the solution before the deployment. The default value is Possible parameter values:
|
Sample of the configuration file for the single-node deployment of Kaspersky Next XDR Expert
Page top
Specifying the installation parameters by using the Configuration wizard
For the multi-node and single-node Kaspersky Next XDR Expert deployment, you have to prepare a configuration file that contains the installation parameters of the Kaspersky Next XDR Expert components. The Configuration wizard allows you to specify the installation parameters that are required to deploy Kaspersky Next XDR Expert, and then generate the resulting configuration file. Optional installation parameters have default values, and they are not to be specified in the Configuration wizard. You can manually add these parameters to the configuration file to override their default values.
Prerequisites
Before specifying the installation parameters by using the Configuration wizard, you must install a database management system on a separate server that is located outside the Kubernetes cluster, perform all preparatory steps necessary for the administrator, target hosts (depending on the multi-node or single-node deployment option), and KUMA hosts.
Process
To specify the installation parameters by using the Configuration wizard:
- On the administrator host where the KDT utility is located, run the Configuration wizard by using the following command:
./kdt wizard -k <path_to_transport_archive> -o <path_to_configuration_file>where:
<path_to_transport_archive>is the path to the transport archive.<path_to_configuration_file>is the path where you want to save the configuration file and the configuration file name.
The Configuration wizard prompts you to specify the installation parameters. The list of the installation parameters that are specific for the multi-node and single-node deployment differs.
If you do not have the Write permissions on the specified directory or a file with the same name is located in this directory, an error occurs and the wizard terminates.
- Enter the IPv4 address of a primary node (or a primary worker node, if you will perform the single-node deployment). This value corresponds to the
hostparameter of the configuration file. - Enter the username of the user account used for connection to the primary node by KDT (the
userparameter of the configuration file). - Enter the path to the private part of the SSH key located on the administrator host and that is used for connection to the primary node by KDT (the
keyparameter of the configuration file). - Enter the number of worker nodes.
Possible values:
- 0—Single-node deployment.
- 3 or more—Multi-node deployment.
This step defines the option of deploying Kaspersky Next XDR Expert. If you want to perform single-node deployment, the following parameters specific for this deployment option will take the default values:
type—primary-workerlow_resources—truevault_replicas—1vault_ha_mode—falsevault_standalone—truedefault_class_replica_count—1
- For each worker node, enter the IPv4 address (the
hostparameter of the configuration file).Note that the primary and worker nodes must be included in the same subnet.
For multi-node deployment, the
kindparameter of the first worker node is set toadmsrvby default. That means that Administration Server will be installed on the first worker node. For single-node deployment, thekindparameter is not specified for the primary worker node. - For each worker node, enter the username used for connection to the worker node by KDT (the
userparameter of the configuration file). - For each worker node, enter the path to the private part of the SSH key used for connection to the worker node by KDT (the
keyparameter of the configuration file). - Enter the connection string for accessing the DBMS that is installed and configured on a separate server (the
psql_dsnparameter of the configuration file).Specify this parameter as follows:
postgres://<dbms_username>:<password>@<fqdn>:<port>.The Configuration wizard specifies the installation parameters only for the deployment option with the DBMS installed on a separate server that is located outside the Kubernetes cluster.
- Enter the IP address of the Kubernetes cluster gateway (the
ip_addressparameter of the configuration file).The gateway must be included in the same subnet as all cluster nodes. The gateway IP address must contain the subnet mask /32.
- Enter the password of the Kaspersky Next XDR Expert user account that will be created by KDT during the installation (the
admin_passwordparameter of the configuration file).The default username of this account is "admin." The Main administrator role is assigned to this user account.
- Enter the path to the KUMA inventory file located on the administrator host (the
inventoryparameter of the configuration file).The KUMA inventory file contains the installation parameters for deployment of the KUMA services that are not included in the Kubernetes cluster.
- Enter the path to the LICENSE file of KUMA Core (the
licenseparameter of the configuration file). - Enter the domain name that is used in the FQDNs of the public Kaspersky Next XDR Expert services (the
smp_domainparameter of the configuration file). - Enter the path to the custom certificates used to work with the public Kaspersky Next XDR Expert services (the
intermediate_bundleparameter of the configuration file).If you want to use self-signed certificates, press Enter to skip this step.
- Skip the step to specify the
extended_incident_lifecycleparameter. This is a service parameter. By default, theextended_incident_lifecycleparameter is disabled, do not change it. - Check the specified parameters that are displayed in the numbered list.
To edit the parameter, enter the parameter number, and then specify a new parameter value. Otherwise, press Enter to continue.
- Press Y to save a new configuration file with the specified parameters or N to stop the Configuration wizard without saving.
The configuration file with the specified parameters is saved in the YAML format.
Other installation parameters are included in the configuration file, with default values. You can edit the configuration file manually before the deployment of Kaspersky Next XDR Expert.
Page top
Installing Kaspersky Next XDR Expert
Kaspersky Next XDR Expert is deployed by using KDT. KDT automatically deploys the Kubernetes cluster within which the Kaspersky Next XDR Expert components and other infrastructure components are installed. The steps of the Kaspersky Next XDR Expert installation process do not depend on the selected deployment option.
If you need to install multiple Kubernetes clusters with Kaspersky Next XDR Expert instances, you can use the required number of contexts.
To install Kaspersky Next XDR Expert:
- Unpack the downloaded distribution package with KDT on the administrator host.
- Read the End User License Agreement (EULA) of KDT located in the distribution package with the Kaspersky Next XDR Expert components.
When you start using KDT, you accept the terms of the EULA of KDT.
You can read the EULA of KDT after the deployment of Kaspersky Next XDR Expert. The file is located in the
/home/kdt/directory of the user who runs the deployment of Kaspersky Next XDR Expert. - During installation, KDT downloads missing packages from the OS repositories. Before installing Kaspersky Next XDR Expert, run the following command on the target hosts to make sure that the apt/yum cache is up-to-date.
apt update - On the administrator host, run the following commands to start deployment of Kaspersky Next XDR Expert by using KDT. Specify the path to the transport archive with the Kaspersky Next XDR Expert components and the path to the configuration file that you filled out earlier (installation parameter sets for the multi-node and single-node deployment differ).
chmod +x kdt./kdt apply -k <full_path_to_transport_archive> -i <full_path_to_configuration_file>You can install Kaspersky Next XDR Expert without prompting to read the terms of the EULA and the Privacy Policy of OSMP, if you use the
--accept-eulaflag. In this case, you must read the EULA and the Privacy Policy of OSMP before the deployment of Kaspersky Next XDR Expert. The files are located in the distribution package with the Kaspersky Next XDR Expert components.If you want to read and accept the terms of the EULA and the Privacy Policy during the deployment, do not use the
--accept-eulaflag. - If you do not use the
--accept-eulaflag in the previous step, read the EULA and the Privacy Policy of OSMP. The text is displayed in the command line window. Press the space bar to view the next text segment. Then, when prompted, enter the following values:- Enter
yif you understand and accept the terms of the EULA.Enter
nif you do not accept the terms of the EULA. - Enter
yif you understand and accept the terms of the Privacy Policy, and if you agree that your data will be handled and transmitted (including to third countries) as described in the Privacy Policy.Enter
nif you do not accept the terms of the Privacy Policy.To use Kaspersky Next XDR Expert, you must accept the terms of the EULA and the Privacy Policy.
After you start the deployment, KDT checks whether the hardware, software, and network configuration of the Kubernetes cluster nodes meet the prerequisites for installing the solution. If all the strict pre-checks are successfully completed, KDT deploys the Kaspersky Next XDR Expert components within the Kubernetes cluster on the target hosts. Otherwise, the deployment will be interrupted. You can skip the pre-checks before the deployment, if needed (set the
ignore_precheckinstallation parameter totrue).During the Kaspersky Next XDR Expert deployment, a new user is created on the primary Administration Server. To start configuring OSMP Console, this user is assigned the following roles: the XDR role of the Main administrator in the Root tenant and the Kaspersky Security Center role of the Main administrator.
- Enter
- View the installation logs of the Bootstrap component in the directory with the KDT utility and obtain diagnostic information about Kaspersky Next XDR Expert components, if needed.
- Sign in to OSMP Console and to KUMA Console.
The OSMP Console address is
https://<console_host>.<smp_domain>:443.The KUMA Console address is
https://<kuma_host>.<smp_domain>:443.Addresses consist of the
console_host,kuma_host, andsmp_domainparameter values specified in the configuration file.
Kaspersky Next XDR Expert is deployed on the target hosts. Install the KUMA services to get started with the solution.
Page top
Configuring internet access for the target hosts
If your organization's infrastructure uses the proxy server to access the internet, as well as you need to connect the target hosts to the internet, you must add the IP address of each target host to the no_proxy variable in the /etc/environment file before the Kaspersky Next XDR Expert deployment. This allows you to establish a direct connection of the target hosts to the internet and correctly deploy Kaspersky Next XDR Expert.
To configure internet access for the target hosts:
- On the target host, open the /etc/environment file by using a text editor. For example, the following command opens the file by using the GNU nano text editor:
sudo nano /etc/environment - In the /etc/environment file, add the IP address of the target host to the
no_proxyvariable separated by a comma without a space.For example, the
no_proxyvariable can be initially specified as follows:no_proxy=localhost,127.0.0.1You can add the IP address of the target host (192.168.0.1) to the
no_proxyvariable:no_proxy=localhost,127.0.0.1,192.168.0.1Alternatively, you can specify the subnet that includes the target hosts (in CIDR notation):
no_proxy=localhost,127.0.0.1,192.168.0.0/24 - Save the /etc/environment file.
After you add the IP addresses in the /etc/environment file to each target host, you can continue preparing of the target hosts and further Kaspersky Next XDR Expert deployment.
Page top
Synchronizing time on machines
To configure time synchronization on machines:
- Run the following command to install chrony:
sudo apt install chrony - Configure the system time to synchronize with the NTP server:
- Make sure the virtual machine has internet access.
If access is available, go to step b.
If internet access is not available, edit the
/etc/chrony.conffile. Replace2.pool.ntp.orgwith the name or IP address of your organization's internal NTP server. - Start the system time synchronization service by executing the following command:
sudo systemctl enable --now chronyd - Wait a few seconds, and then run the following command:
sudo timedatectl | grep 'System clock synchronized'If the system time is synchronized correctly, the output will contains the line
System clock synchronized: yes.
- Make sure the virtual machine has internet access.
Synchronization is configured.
Page top
Installing KUMA services
Services are the main components of the KUMA component, which helps the system to manage events. Services allow you to receive events from event sources and subsequently bring them to a common form that is convenient for finding correlation, as well as for storage and manual analysis.
Service types:
- Storages are used to save events.
- Collectors are used to receive events and convert them to the KUMA format.
- Correlators are used to analyze events and search for defined patterns.
- Agents are used to receive events on remote devices and forward them to the KUMA collectors.
You must install the KUMA services only after you deploy Kaspersky Next XDR Expert. During the Kaspersky Next XDR Expert deployment, the required infrastructure is prepared: the service directories are created on the prepared hosts, and the files that are required for the service installation are added to these directories. We recommend installing services in the following order: storage, collectors, correlators, and agents.
To install and configure the KUMA services:
- Sign in to KUMA Console.
You can use one of the following methods:
- In the main menu of OSMP Console, go to Settings → KUMA.
- In your browser, go to
https://<kuma_host>.<smp_domain>:443.KUMA Console addresses consists of the
kuma_hostandsmp_domainparameter values specified in the configuration file.
- In KUMA Console, create a resource set for each KUMA service (storages, collectors, and correlators) that you want to install on the prepared hosts in the network infrastructure.
- Create services for storages, collectors, and correlators in KUMA Console.
- Obtain the service identifiers to bind the created resource sets and the KUMA services:
- In the KUMA Console main menu, go to Resources → Active services.
- Select the required KUMA service, and then click the Copy ID button.
- On the prepared hosts in the network infrastructure, run the corresponding commands to install the KUMA services. Use the service identifiers that were obtained earlier:
- Installation command for the storage:
sudo /opt/kaspersky/kuma/kuma storage --core https://<KUMA Core server FQDN>:7210 --id <service ID copied from the KUMA Console> --install - Installation command for the collector:
sudo /opt/kaspersky/kuma/kuma collector --core https://<KUMA Core server FQDN>:7210 --id <service ID copied from the KUMA Console> --api.port <port used for communication with the collector> - Installation command for the correlator:
sudo /opt/kaspersky/kuma/kuma correlator --core https://<KUMA Core server FQDN>:7210 --id <service ID copied from the KUMA Console> --api.port <port used for communication with the correlator> --install
By default, the FQDN of KUMA Core is <
kuma_console>.<smp_domain>.The port that is used for connection to KUMA Core cannot be changed. By default, port 7210 is used.
Open ports that correspond to the installed collector and correlator on the server (TCP 7221 and other ports used for service installation as the
--api.port <port>parameter values). - Installation command for the storage:
- During the installation of the KUMA services, read the End User License Agreement (EULA) of KUMA. The text is displayed in the command line window. Press the space bar to view the next text segment. Then, when prompted, enter the following values:
- Enter
yif you understand and accept the terms of the EULA. - Enter
nif you do not accept the terms of the EULA. To use the KUMA services, you must accept the terms of the EULA.
You can read the EULA of KUMA after the installation of the KUMA services in one of the following ways:
- On hosts, it is included in the
kuma_utilsgroup in the KUMA inventory file: open the LICENSE file located in the/opt/kaspersky/kuma/utilsdirectory. - On hosts, it is included in other groups (
kuma_storage, kuma_collector, orkuma_correlator) in the KUMA inventory file: open the LICENSE file located in the/opt/kaspersky/kumadirectory. - Run the following command:
/opt/kaspersky/kuma/kuma license --show
After you accept the EULA, the KUMA services are installed on the prepared machines in the network infrastructure.
- Enter
- If necessary, verify that the collector and correlator are ready to receive events.
- If necessary, install agents in the KUMA network infrastructure.
The files required for the agent installation are located in the
/opt/kaspersky/kuma/utilsdirectory.
The KUMA services required for the function of Kaspersky Next XDR Expert are installed.
Page top
Deployment of multiple Kubernetes clusters and Kaspersky Next XDR Expert instances
KDT allows you to deploy multiple Kubernetes clusters with Kaspersky Next XDR Expert instances and switch between them by using contexts. Context is a set of access parameters that define the Kubernetes cluster that the user can select to interact with. The context also includes data for connecting to the cluster by using KDT.
Prerequisites
Before creating contexts and installing Kubernetes clusters with Kaspersky Next XDR Expert instances, you must do the following:
- Prepare the administrator and target hosts.
For the installation of multiple clusters and Kaspersky Next XDR Expert instances, you need to prepare one administration host for all clusters and separate sets of target hosts for each of the clusters. Kubernetes components should not be installed on the target hosts.
- Prepare the hosts for installation of the KUMA services.
For installation of the KUMA services, you need to prepare separate sets of hosts for each Kaspersky Next XDR Expert instance.
- Prepare the KUMA inventory file.
For installation of the KUMA services, you need to prepare separate inventory files for each Kaspersky Next XDR Expert instance.
- Prepare the configuration file.
For installation of multiple clusters and Kaspersky Next XDR Expert instances, you need to prepare configuration files for each Kaspersky Next XDR Expert instance. In these configuration files, specify the corresponding administration and target hosts, and other parameters specific to a particular cluster and Kaspersky Next XDR Expert instance.
Process
To create a context with the Kubernetes cluster and Kaspersky Next XDR Expert instance:
- On the administrator host where the KDT utility is located, run the following command and specify the context name:
./kdt ctx --create <context_name>The context with the specified name is created.
- Install the Kubernetes cluster and Kaspersky Next XDR Expert.
The cluster with the Kaspersky Next XDR Expert instance is deployed in the context. The creation of the context is finished. When you obtain log files of Kaspersky Next XDR Expert components, the log files contain your current context name.
You can repeat this procedure to create the required number of contexts with installed clusters and Kaspersky Next XDR Expert instances.
You must deploy the Kubernetes cluster and the Kaspersky Next XDR Expert instance after you create the context to finish the context creation. If you do not perform the deployment in the context, and then create another context, the first context will be removed.
To view the list of created contexts and the active context name,
On the administrator host where the KDT utility is located, run the following command:
./kdt ctx
To switch to the required context,
On the administrator host where the KDT utility is located, run the following command and specify the context name:
./kdt ctx <context_name>
After you select the context, KDT connects to the corresponding Kubernetes cluster. Now, you can work with this cluster and the Kaspersky Next XDR Expert instance. KDT commands are applied to the selected cluster.
When you remove the Kaspersky Next XDR Expert components installed in the Kubernetes cluster and the cluster itself by using KDT, the corresponding contexts are also removed. Other contexts and their clusters with Kaspersky Next XDR Expert instances are not removed.
Page top
Pre-check of infrastructure readiness for deployment
After you start the deployment of Kaspersky Next XDR Expert, KDT checks whether the hardware, software, and network configuration of the Kubernetes cluster nodes meet the prerequisites for installing the solution. A pre-check is performed for each node of the cluster.
All checks are divided into two groups:
- Strict checks
Checking the parameters that are critical for the operation of Kaspersky Next XDR Expert. If this check fails, the deployment is interrupted.
- Non-strict checks
Checking the parameters that are not critical for the operation of Kaspersky Next XDR Expert. If this check fails, the deployment continues.
The following pre-checks are performed:
- Hardware:
- Free space on disks is enough for deployment.
- CPU configuration meets the requirements.
- Free RAM space is enough for deployment.
- CPU supports the AVX, SSE2, and BMI instructions.
- Software:
- Operating system and its version meet the requirements.
- Kernel version meets the requirements.
- Systemctl is installed and available (strict check).
- Update of the package manager cache is available (strict check).
- Required packages of the correct version are installed on the node (strict check).
- Prohibited packages (docker and podman) are not installed on the node (strict check).
- Outdated k0s binaries are missing (strict check).
- Outdated k0s configuration files are missing (strict check).
- Network:
- All cluster nodes are located in the same broadcast domain.
- DNS name resolution on the node is available (strict check).
- Time synchronization on cluster nodes is configured (strict check).
- Required ports are available.
If all the strict pre-checks are successfully completed, KDT deploys the Kaspersky Next XDR Expert components within the Kubernetes cluster on the target hosts. The results of all passed and failed checks are saved on each node in the file /tmp/k0s_report.txt. You can skip the pre-checks before the deployment, if needed (set the ignore_precheck installation parameter to true).
Signing in to Kaspersky Next XDR Expert
To sign in to Kaspersky Next XDR Expert, you must know the web address of Open Single Management Platform Console. In your browser, JavaScript must be enabled.
To sign in to Open Single Management Platform Console:
- In your browser, go to
https://<console_host>.<smp_domain>:443.The Open Single Management Platform Console address consists of the
console_hostandsmp_domainparameter values specified in the configuration file.The sign-in page is displayed.
- Do one of the following:
- To sign in to Open Single Management Platform Console by using a domain user account, enter the user name and password of the domain user.
You can enter the user name of the domain user in one of the following formats:
Username@dns.domain- NTDOMAIN\
Username
Before you sign in with a domain user account, poll the domain controller to obtain the list of domain users.
- Enter the user name and password of the internal user.
- If one or more virtual Servers are created on the Server and you want to sign in to a virtual Server:
- Click Show virtual Server options.
- Type the virtual Server name that you specified while creating the virtual Server.
- Enter the user name and password of the internal or domain user who has rights on the virtual Server.
- To sign in to Open Single Management Platform Console by using a domain user account, enter the user name and password of the domain user.
- Click the Sign in button.
After sign-in, the dashboard is displayed, and it contains the language and theme that you used the last time you signed in.
Kaspersky Next XDR Expert allows you to work with Open Single Management Platform Console and KUMA Console interfaces.
If you sign in to one of the consoles, and then open the other console on a different tab of the same browser window, you are signed in to the other console without having to re-enter the credentials. In this case, when you sign out of one console, the session also ends for the other console.
If you use different browser windows or different devices to sign in to Open Single Management Platform Console and KUMA Console, you have to re-enter the credentials. In this case, when you sign out of one console on the browser window or device where it is open, the session continues on the window or device where the other console is open.
To sign out of Open Single Management Platform Console,
In the main menu, go to your account settings, and then select Sign out.
Open Single Management Platform Console is closed and the sign-in page is displayed.
Page top
Kaspersky Next XDR Expert maintenance
This section describes updating, removing, and reinstalling Kaspersky Next XDR Expert components by using KDT. Also, the section provides instructions on how to stop the Kubernetes cluster nodes, update custom certificates for public Kaspersky Next XDR Expert services, as well as obtain the current version of the configuration file, and perform other actions with Kaspersky Next XDR Expert components by using KDT.
Upgrading Kaspersky Next XDR Expert from version 1.1 to 1.2
You can upgrade Kaspersky Next XDR Expert from version 1.1 to 1.2 by using KDT. KDT updates the Kubernetes cluster, the Kaspersky Next XDR Expert components, and the KUMA services installed on the KUMA target hosts outside the cluster. When upgrading, you do not need to fill in the configuration file, because the installation parameters specified during deployment are used. The steps of the Kaspersky Next XDR Expert upgrade process do not depend on the selected deployment option.
To upgrade Kaspersky Next XDR Expert:
- Download and unpack the distribution package with Kaspersky Next XDR Expert version 1.2.
- On the administrator host, export the current configuration file.
- In the exported configuration file, update the installation parameters listed in the expanding block below.
Changed installation parameters
Old installation parameter (version 1.1)
New installation parameter (version 1.2)
Action
sshKey
Delete the deprecated parameters
pki_domaincoreIngressHostKUMAUIURLwebConsoleURLkdtStateSizeadminLoginpsql_nspsql_instancekumaUrlkumaLoginkscpasswordadmin_passwordRename and squash
adminPasswordiam-nwc_host("console.smp.local")iam-nwc_host("console")Change the value (exclude the
smp_domainvalue from the parameter value)flow_host("console.smp.local")flow_host("console")hydra_host("console.smp.local")hydra_host("console")login_host("console.smp.local")login_host("console")gateway_host("console.smp.local")gateway_host("console")admsrv_fqdn("admsrv.smp.local")admsrv_host("admsrv")Rename and change the value (exclude the
smp_domainvalue from the parameter value)console_fqdn("console.smp.local")console_host("console")api_fqdn("api.smp.local")api_host("api")kuma_fqdn("kuma.smp.local")kuma_host("kuma")psql_fqdn("psql.smp.local")psql_host("psql")monitoring_fqdn("monitoring.smp.local")monitoring_host("monitoring")pki_fqdn_list("admsrv.smp.local api.smp.local console.smp.local kuma.smp.local psql.smp.local monitoring.smp.local")pki_host_list("admsrv api console kuma psql monitoring")ipaddressip_addressRename
lowResourceslow_resourcescoreDiskRequestcore_disk_requesthostInventoryhost_inventory - Read the End User License Agreement (EULA) of KDT located in the distribution package with the Kaspersky Next XDR Expert components.
When you start using KDT, you accept the terms of the EULA of KDT.
You can read the EULA of KDT after upgrading Kaspersky Next XDR Expert. The file is located in the
/home/kdt/directory of the user who runs the upgrade of Kaspersky Next XDR Expert. - On the administrator host, run the following command to update the Bootstrap component. In the command, specify the full path to the transport archive with the Kaspersky Next XDR Expert components and the full path to the configuration file:
./kdt apply -k <full_path_to_XDR_updates_archive> -i <full_path_to_configuration_file> --force-bootstrap - Run the following command to upgrade Kaspersky Next XDR Expert:
./kdt apply -k <full_path_to_XDR_updates_archive> --forceTo start upgrading Kaspersky Next XDR Expert, accept the terms of the EULA and the Privacy Policy.
You can install Kaspersky Next XDR Expert without prompting to read the terms of the EULA and the Privacy Policy of OSMP, if you use the
--accept-eulaflag. In this case, you must read the EULA and the Privacy Policy of OSMP before upgrading Kaspersky Next XDR Expert. The files are located in the distribution package with the Kaspersky Next XDR Expert components. By using the--accept-eulaflag, you confirm that you have fully read, understand, and accept the terms of the EULA and the Privacy Policy.If you want to read and accept the terms of the EULA and the Privacy Policy during the upgrade, do not use the
--accept-eulaflag. - If you do not use the
--accept-eulaflag in the previous step, read the EULA and the Privacy Policy of OSMP. The text is displayed in the command line window. Press the space bar to view the next text segment. Then, when prompted, enter the following values:- Enter
yif you understand and accept the terms of the EULA.Enter
nif you do not accept the terms of the EULA. - Enter
yif you understand and accept the terms of the Privacy Policy, and if you agree that your data will be handled and transmitted (including to third countries) as described in the Privacy Policy.Enter
nif you do not accept the terms of the Privacy Policy.
If you do not accept the terms of the EULA and the Privacy Policy, Kaspersky Next XDR Expert will not be upgraded.
- Enter
Kaspersky Next XDR Expert is upgraded from version 1.1 to 1.2.
Page top
Updating Kaspersky Next XDR Expert components
KDT allows you to update the Kaspersky Next XDR Expert components (including management web plug-ins). New versions of the Kaspersky Next XDR Expert components are included in the distribution package.
Installing components of an earlier version is not supported.
To update the Kaspersky Next XDR Expert components:
- Download the distribution package with the new versions of the Kaspersky Next XDR Expert components.
- If necessary, on the administrator host, export the current version of the configuration file.
You do not need to export the configuration file if the installation parameters are not added or modified.
- Update the Kaspersky Next XDR Expert components:
- Run the following command for standard updating of the Kaspersky Next XDR Expert components:
./kdt apply -k <full_path_to_XDR_updates_archive> -i <full_path_to_configuration_file> - If the version of the installed Kaspersky Next XDR Expert component matches the component version in the distribution package, the update of this component is skipped. Run the following command to force an update of this component by using the
forceflag:./kdt apply --force -k <full_path_to_XDR_updates_archive> -i <full_path_to_configuration_file>
- Run the following command for standard updating of the Kaspersky Next XDR Expert components:
- If the distribution package contains a new version of the Bootstrap component, run the following command to update the Kubernetes cluster:
./kdt apply -k <full_path_to_XDR_updates_archive> -i <full_path_to_configuration_file> --force-bootstrapIn the commands described above, you need specify the path to the archive with updates of the components and the path to the current configuration file. You may not specify the path to the configuration file in the command if the installation parameters are not added or modified.
- Read the End User License Agreement (EULA) and the Privacy Policy of the Kaspersky Next XDR Expert component, if a new version of the EULA and the Privacy Policy appears. The text is displayed in the command line window. Press the space bar to view the next text segment. Then, when prompted, enter the following values:
- Enter
yif you understand and accept the terms of the EULA.Enter
nif you do not accept the terms of the EULA. To use the Kaspersky Next XDR Expert component, you must accept the terms of the EULA. - Enter
yif you understand and accept the terms of the Privacy Policy, and you agree that your data will be handled and transmitted (including to third countries) as described in the Privacy Policy.Enter
nif you do not accept the terms of the Privacy Policy.
To update the Kaspersky Next XDR Expert component, you must accept the terms of the EULA and the Privacy Policy.
- Enter
After you accept the EULA and the Privacy Policy, KDT updates the Kaspersky Next XDR Expert components.
You can read the EULA and the Privacy Policy of the Kaspersky Next XDR Expert component after the update. The files are located in the /home/kdt/ directory of the user who runs the deployment of Kaspersky Next XDR Expert.
Adding and deleting nodes of the Kubernetes cluster
If the workload on the Kaspersky Next XDR Expert components changes, you can add or delete target hosts included in the Kubernetes cluster (cluster nodes). KDT allows you to change the number of the nodes in the existing Kubernetes cluster.
You can add or delete nodes only if Kaspersky Next XDR Expert is deployed on multiple nodes.
To add new nodes to the Kubernetes cluster:
- Export the current configuration file.
The current version of the configuration file is saved to the specified directory with the specified name.
- In the
nodessection of the exported configuration file, add parameters of one or several new nodes (desc,type,host,kind,user, andkey), and then save the configuration file. - Copy the public key to each new node (for example, to the
/home/<user_name>/.sshdirectory) by using the ssh-copy-id utility. - On the administrator host, run the following command to apply the modified configuration file to the Kubernetes cluster. In the command, specify the full path to this configuration file:
./kdt apply -i <full_path_to_configuration_file> - Run the following command to update the Bootstrap component with added nodes. In the command, specify the full path to the transport archive with the Kaspersky Next XDR Expert components:
./kdt apply -k <full_path_to_transport_archive> --force-bootstrap
New nodes are added to the Kubernetes cluster.
To delete a node from the Kubernetes cluster:
- Ensure that the kubectl utility is installed on the administrator host.
- Move the configuration file, that is used for the deployment, to the
/root/.kubedirectory. - Rename the configuration file to
config.yaml. - Run the following command to display the list of all cluster nodes:
kubectl get nodes - Run the following command to transfer all the pods from the node that you want to delete. In the command, specify the name of the node that will be deleted. The pods will be distributed among the remaining nodes.
kubectl drain <node_name> --delete-emptydir-data --ignore-daemonsets - Run the following command to delete the node from the cluster:
kubectl delete node <node_name>
The specified node is deleted.
Page top
Versioning the configuration file
When working with Kaspersky Next XDR Expert, you may need to change the parameters that were specified in the configuration file before the Kaspersky Next XDR Expert deployment. For example, when changing the disk space used to store the Administration Server data, the ksc_state_size parameter is modified. The current version of the configuration file with the modified ksc_state_size parameter is updated in the Kubernetes cluster.
If you try to use the previous version of the configuration file in a KDT custom action that requires the configuration file, a conflict occurs. To avoid conflicts, you have to use only the current version on the configuration file exported from the Kubernetes cluster.
To export the current version of the configuration file,
On the administrator host where the KDT utility is located, run the following custom action, and then specify the path to the configuration file and its name:
./kdt ec -e <configuration_file_name_with_path>
The current version of the configuration file is saved to the specified directory with the specified name.
You can use the exported configuration file, for example, when updating Kaspersky Next XDR Expert components or adding management plug-ins for Kaspersky applications.
You need not export the configuration file if the installation parameters are not added or modified.
Page top
Uninstalling Kaspersky Next XDR Expert
KDT allows you to uninstall all Kaspersky Next XDR Expert components installed in the Kubernetes cluster, the cluster itself, the KUMA services installed outside the cluster, and other artifacts created during the deployment or operation of the solution.
To uninstall the Kaspersky Next XDR Expert components and related data:
On the administrator host, run the following command:
./kdt remove --allThis command removes the following objects and artifacts:
All Kaspersky Next XDR Expert components installed in the Kubernetes cluster and the cluster itself.
The Kaspersky Next XDR Expert user account that was created by KDT during the deployment.
The database located on a separate server or inside the cluster, DBMS schemes, and DBMS accounts created by KDT during the deployment.
The KUMA services installed outside the cluster on the hosts that were specified in the inventory file.
- The contents of the following directories on target hosts:
/var/spool/ksc/logs/var/spool/ksc/backup/var/spool/ksc//var/lib/k0s/run/k0s/etc/k0s//etc/containerd//var/lib/containerd//run/containerd/
Logs obtained during the installation and operation of the Kaspersky Next XDR Expert components.
- Data related to the Kaspersky Next XDR Expert components on the administrator host.
If the administrator host does not have network access to a target host, uninstalling the components is interrupted. You can restore network access and restart the uninstallation of Kaspersky Next XDR Expert. Alternatively, you can uninstall the Kaspersky Next XDR Expert components from the target hosts manually.
If you use multiple Kubernetes clusters managing by contexts, this command removes only the current Kubernetes context, the corresponding cluster, and the Kaspersky Next XDR Expert components installed in the cluster. Other contexts and their clusters with Kaspersky Next XDR Expert instances are not removed.
- Close the ports used by Kaspersky Next XDR Expert that were opened during the deployment, if needed. These ports are not closed automatically.
Remove the operating system packages that were automatically installed during the deployment, if needed. These packages are not removed automatically.
- Remove KDT and the contents of the
/home/<user>/kdtand/home/<user>/.kdtdirectories.
The Kaspersky Next XDR Expert components, database, and related data are removed, and the ports used by Kaspersky Next XDR Expert are closed.
Kaspersky applications installed on the managed devices are not removed by using the ./kdt remove command. For information on how to remove Kaspersky applications, refer to their documentation.
After uninstalling Kaspersky Next XDR Expert, target hosts are not restarted automatically. You can restart these hosts manually if necessary.
Page top
Manual uninstalling of Kaspersky Next XDR Expert components
If the administrator host does not have network access to a target host, uninstalling the Kaspersky Next XDR Expert components by using KDT is interrupted. You can restore network access and restart the removal of the solution. Alternatively, you can uninstall the Kaspersky Next XDR Expert components from the target hosts manually.
To uninstall the Kaspersky Next XDR Expert components from the target hosts manually:
On the target host, run the following command to stop the k0s service:
/usr/local/bin/k0s stop- Run the following command to reset cluster nodes to the initial state:
/usr/local/bin/k0s reset Remove the contents of the following directories:
Required directories:
/etc/k0s//var/lib/k0s//usr/libexec/k0s//usr/local/bin/(remove only thek0sfile)
Optional directories:
/var/lib/containerd//var/cache/k0s//var/cache/kubelet//var/cache/containerd/
You can remove the
/var/lib/containerd/and/var/cache/containerd/directories if the containerd service is used only for the function of Kaspersky Next XDR Expert. Otherwise, your data contained in the/var/lib/containerd/and/var/cache/containerd/directories may be lost.The contents of the
/var/cache/k0s/,/var/cache/kubelet/, and/var/cache/containerd/directories are automatically removed after you restart the target host. You do not have to clear these folders manually.
- Restart all target hosts.
The Kaspersky Next XDR Expert components are deleted from the target hosts.
Page top
Reinstalling Kaspersky Next XDR Expert components
During the installation of Kaspersky Next XDR Expert, on the administrator host, KDT displays an installation log that shows whether the Kaspersky Next XDR Expert components are installed correctly.
After installing Kaspersky Next XDR Expert, you can run the following command to view the list of all installed components:
./kdt status
The installed components list is displayed. Correctly installed components have the Success status. If the component installation failed, this component has the Failed status.
To view the full installation log of the incorrectly installed Kaspersky Next XDR Expert component, run the following command:
./kdt status -l <component_name>
You can also output all diagnostic information about Kaspersky Next XDR Expert components by using the following command:
./kdt logs get --to-archive
You can use the obtained logs to troubleshoot problems on your own or with the help of Kaspersky Technical Support.
To reinstall incorrectly installed Kaspersky Next XDR Expert components,
- If you did not modify the configuration file, run the following command, and then specify the same transport archive that was used for the Kaspersky Next XDR Expert installation:
./kdt apply -k <full_path_to_transport_archive> - If you need to change the installation parameters, export the configuration file, modify it, and then run the following command with the transport archive and the updated configuration file:
./kdt apply -k <full_path_to_transport_archive> -i <full_path_to_configuration_file>
KDT reinstalls only the incorrectly installed Kaspersky Next XDR Expert components.
Page top
Stopping the Kubernetes cluster nodes
You may need to stop the entire Kubernetes cluster or temporarily detach one of the nodes of the cluster for maintenance.
In a virtual environment, do not power off virtual machines that are hosting active Kubernetes cluster nodes.
To stop a multi-node Kubernetes cluster (multi-node deployment scheme):
- Log in to a worker node and initiate graceful shut down. Repeat this process for all worker nodes.
- Log in to the primary node and initiate graceful shut down.
To stop a single-node Kubernetes cluster (single-node deployment scheme):
Log in to the primary node and initiate graceful shut down.
Page top
Using certificates for public Kaspersky Next XDR Expert services
For working with public Kaspersky Next XDR Expert services, you can use self-signed or custom certificates. By default, Kaspersky Next XDR Expert uses self-signed certificates.
Certificates are required for the following Kaspersky Next XDR Expert public services:
- <console_host>.<smp_domain>—Access to the OSMP Console interface.
- <admsrv_host>.<smp_domain>—Interaction with Administration Server.
- <api_host>.<smp_domain>—Access to the Kaspersky Next XDR Expert API.
FQDNs of public Kaspersky Next XDR Expert services consist of the host names and domain name specified in the configuration file. The list of addresses of public Kaspersky Next XDR Expert services, for which self-signed or custom certificates are defined during the deployment, is specified in the pki_fqdn_list installation parameter.
A custom certificate must be specified as a file in the PEM format, and that contains the complete certificate chain (or only one certificate) and an unencrypted private key.
You can specify the intermediate certificate from your organization's private key infrastructure (PKI). Custom certificates for public Kaspersky Next XDR Expert services are issued from this custom intermediate certificate. Alternatively, you can specify leaf certificates for each of the public services. If leaf certificates are specified only for a part of the public services, then self-signed certificates are issued for the other public services.
For the <console_host>.<smp_domain> and <api_host>.<smp_domain> public services, you can specify custom certificates only before the deployment in the configuration file. Specify the intermediate_bundle and intermediate_enabled installation parameters to use the custom intermediate certificate.
If you want to use the leaf custom certificates to work with the public Kaspersky Next XDR Expert services, specify the corresponding console_bundle, admsrv_bundle, and api_bundle installation parameters. Set the intermediate_enabled parameter to false, and do not specify the intermediate_bundle parameter.
For the <admsrv_host>.<smp_domain> service, you can replace the issued Administration Server self-signed certificate with a custom certificate by using the klsetsrvcert utility.
Automatic rotation of certificates is not supported. Take into account the validity term of the certificate, and then update the certificate when it expires.
To update custom certificates:
- On the administrator host, export the current version of the configuration file.
- In the exported configuration file, specify the path to a new custom intermediate certificate in the
intermediate_bundleinstallation parameter. If you use the leaf custom certificates for each of the public services, specify theconsole_bundle,admsrv_bundle, andapi_bundleinstallation parameters. - Run the following command and specify the full path to the modified configuration file:
./kdt apply -i <full_path_to_configuration_file>
Custom certificates are updated.
Page top
Calculation and changing of disk space for storing Administration Server data
Administration Server data includes the following objects:
- Information about assets (devices).
- Information about events logged on the Administration Server for the selected client device.
- Information about the domain in which the assets are included.
- Data of the Application Control component.
- Updates. The shared folder additionally requires at least 4 GB to store updates.
- Installation packages. If some installation packages are stored on the Administration Server, the shared folder will require an additional amount of free disk space equal to the total size of all of the available installation packages to be installed.
- Remote installation tasks. If remote installation tasks are present on the Administration Server, an additional amount of free disk space equal to the total size of all installation packages to be installed will be required.
Calculation of the minimum disk space for storing Administration Server data
The minimum disk space required for storing the Administration Server data can be estimated approximately by using the formula:
(724 * C + 0.15 * E + 0.17 * A + U), KB
where:
- C is the number of assets (devices).
- E is the number of events to store.
- A is the total number of domain objects:
- Device accounts
- User accounts
- Accounts of security groups
- Organizational units
- U is the size of updates (at least 4 GB).
If domain polling is disabled, A is considered to equal zero.
The formula calculates the disk space required for storing typical data from managed devices and the typical size of updates. The formula does not include the amount of disk space occupied by data that is independent of the number of managed devices for the Application Control component, installation packages, and remote installation tasks.
Changing of the disk space for storing the Administration Server data
The amount of free disk space allocated to store the Administration Server data is specified in the configuration file before the deployment of Kaspersky Next XDR Expert (the ksc_state_size parameter). Take into account the minimum disk space calculated by using the formula.
To check the disk space used to store the Administration Server data after the deployment of Kaspersky Next XDR Expert,
On the administrator host where the KDT utility is located, run the following command:
./kdt invoke ksc --action getPvSize
The amount of the required free disk space in gigabytes is displayed.
To change the disk space used to store the Administration Server data after the deployment of Kaspersky Next XDR Expert,
On the administrator host where the KDT utility is located, run the following command and specify the required free disk space in gigabytes (for example, "50Gi"):
./kdt invoke ksc --action setPvSize --param ksc_state_size="<new_disk_space_amount>Gi"
The amount of free disk space allocated to store the Administration Server data is changed.
Page top
Rotation of secrets
KDT allows you to rotate the secrets that are used to connect to the Kubernetes cluster, to the infrastructure components of Kaspersky Next XDR Expert, and to the DBMS. The rotation period of these secrets can be specified in accordance with the information security requirements of your organization. Secrets are located on the administrator host.
Secrets that are used to connect to the Kubernetes cluster include a client certificate and a private key. Secrets for access to the Registry and DBMS include the corresponding DSNs.
To rotate the secrets for connection to the Kubernetes cluster manually,
On the administrator host where the KDT utility is located, run the following command:
./kdt invoke bootstrap --action RotateK0sConfig
New secrets for connection to the Kubernetes cluster are generated.
When updating Bootstrap, secrets for connection to the Kubernetes cluster are updated automatically.
To rotate the secrets for connection to the Registry manually,
On the administrator host where the KDT utility is located, run the following command:
./kdt invoke bootstrap --action RotateRegistryCreds
New secrets for connection to the Registry are generated.
Page top
Adding hosts for installing the additional KUMA services
If you need to expand the storage, or add new collectors and correlators for the increased flow of events, you can add additional hosts for installation of the KUMA services.
You must specify the parameters of the additional hosts in the expand.inventory.yml file. This file is located in the distribution package with the transport archive, KDT, the configuration file, and other files. In the expand.inventory.yml file, you can specify several additional hosts for collectors, correlators, and storages at once. Ensure that hardware, software, and installation requirements for the selected hosts are met.
To prepare the required infrastructure on the hosts specified in the expand.inventory.yml file, you need to create the service directories to which the files that are required for the service installation are added. To prepare the infrastructure, run the following command and specify the expand.inventory.yml file:
./kdt invoke kuma --action addHosts --param hostInventory=<path_to_inventory_file>
On the hosts specified in the expand.inventory.yml file, the service directories to which the files that are required for the service installation are added.
Adding an additional storage, collector, or correlator
You can add an additional storage cluster, collector, or correlator to your existing infrastructure. If you want to add several services, it is recommended to install them in the following order: storages, collectors, and correlators.
To add an additional storage cluster, collector, or correlator:
- Sign in to KUMA Console.
You can use one of the following methods:
- In the main menu of OSMP Console, go to Settings → KUMA.
- In your browser, go to
https://<kuma_host>.<smp_domain>:443.The KUMA Console address consists of the
kuma_hostandsmp_domainparameter values specified in the configuration file.
- In KUMA Console, create a resource set for each KUMA service (storages, collectors, and correlators) that you want to install on the prepared hosts.
- Create services for storages, collectors, and correlators in KUMA Console.
- Obtain the service identifiers to bind the created resource sets and the KUMA services:
- In the KUMA Console main menu, go to Resources → Active services.
- Select the required KUMA service, and then click the Copy ID button.
- Install the KUMA services on each prepared host listed in the kuma_storage, kuma_collector, and kuma_correlator sections of the expand.inventory.yml inventory file. On each machine, in the installation command, specify the service ID corresponding to the host. Run the corresponding commands to install the KUMA services:
- Installation command for the storage:
sudo /opt/kaspersky/kuma/kuma storage --core https://<KUMA Core server FQDN>:7210 --id <service ID copied from the KUMA Console> --install - Installation command for the collector:
sudo /opt/kaspersky/kuma/kuma collector --core https://<KUMA Core server FQDN>:7210 --id <service ID copied from the KUMA Console> --api.port <port used for communication with the installed component> - Installation command for the correlator:
sudo /opt/kaspersky/kuma/kuma correlator --core https://<KUMA Core server FQDN>:7210 --id <service ID copied from the KUMA Console> --api.port <port used for communication with the installed component> --installThe collector and correlator installation commands are automatically generated on the Setup validation tab of the Installation Wizard, and the port used for communication is added to the command automatically. Use the generated commands to install the collector and correlator on the hosts. This will allow you to make sure that the ports for communication with the services specified in the command are available.
The FQDN of KUMA Core is <
kuma_host>.<smp_domain>.The port that is used for connection to KUMA Core cannot be changed. By default, port 7210 is used.
- Installation command for the storage:
The additional KUMA services are installed.
Adding hosts to an existing storage
You can expand an existing storage (storage cluster) by adding hosts as new storage cluster nodes.
To add hosts to an existing storage:
- Sign in to KUMA Console.
You can use one of the following methods:
- In the main menu of OSMP Console, go to Settings → KUMA.
- In your browser, go to
https://<kuma_host>.<smp_domain>:443.The KUMA Console address consists of the
kuma_hostandsmp_domainparameter values specified in the configuration file.
- Add new nodes to the storage cluster. To do this, edit the settings of the existing storage cluster:
- In the Resources → Storages section, select an existing storage, and then open the storage for editing.
- In the ClickHouse cluster nodes section, click Add nodes, and then specify roles in the fields for the new node. Specify the corresponding host domain names from the kuma_storage section of the expand.inventory.yml file, and then specify the roles for the new nodes.
- Save changes.
You do not need to create a separate storage because you are adding servers to an existing storage cluster.
- Create storage services for each added storage cluster node in KUMA Console, and then bind the services to the storage cluster.
- Obtain the storage service identifiers for each prepared host to install the KUMA services:
- In the KUMA Console main menu, go to Resources → Active services.
- Select the required KUMA service, and then click the Copy ID button.
- Install the storage service on each prepared host listed in the kuma_storage section of the expand.inventory.yml inventory file. On each machine, in the installation command, specify the service ID corresponding to the host. Run the following command to install the storage service:
sudo /opt/kaspersky/kuma/kuma storage --core https://<KUMA Core server FQDN>:7210 --id <service ID copied from the KUMA Console> --installThe FQDN of the KUMA Core is <
kuma_host>.<smp_domain>.The port that is used for connection to KUMA Core cannot be changed. By default, port 7210 is used.
The additional hosts are added to the storage cluster.
Specify the added hosts in the distributed.inventory.yml inventory file so that it has up-to-date information in case of a KUMA components update.
Page top
Replacing a host that uses KUMA storage
To replace a host that uses KUMA storage with another one:
- Fill in the expand.inventory.yml file, specifying the parameters of the host you want to replace.
- Run the following command, specifying the expand.inventory.yml file to remove the host:
./kdt invoke kuma --action removeHosts --param hostInventory=<path_to_inventory_file> - Fill in the expand.inventory.yml file, specifying the parameters of the new host that you want to replace the previous host, and then run the following command:
./kdt invoke kuma --action addHosts --param hostInventory=<path_to_inventory_file> - Follow steps 2-6 of the instruction for adding new hosts for KUMA services to add a new host with the KUMA storage.
The host with the KUMA storage is replaced with another one.
If your storage configuration includes a shard containing two replicas, and you replaced the second replica host with a new one by using the steps described above, then you may receive an error when installing a new replica. In this case, the new replica will not work.
To fix an error when adding a new replica of a shard:
- On another host with a replica of the same shard that owns the incorrectly added replica, launch the ClickHouse client by using the command:
/opt/kaspersky/kuma/clickhouse/bin/client.shIf this host is unavailable, run the client on any other host with a replica included in the same storage cluster.
- Run the command to remove the data about the host you wanted to replace.
- If the host with a replica of the same shard that owns the incorrectly added replica is available, run the following command:
SYSTEM DROP REPLICA '<replica number of read-only node>' FROM TABLE kuma.events_local_v2 - If you are using another storage cluster host with a replica, run the following command:
SYSTEM DROP REPLICA '<replica number of read-only node>' FROM ZKPATH '/clickhouse/tables/kuma/<shard number of read-only node>/kuma/events_local_v2
- If the host with a replica of the same shard that owns the incorrectly added replica is available, run the following command:
- Run the following command to restore the operation of the added host with a replica:
SYSTEM RESTORE REPLICA kuma.events_local_v2
Operability of the added host with a replica is restored.
Page top
Migration to Kaspersky Next XDR Expert
This section describes the migration of data to Kaspersky Next XDR Expert from Kaspersky Security Center Windows.
About migration from Kaspersky Security Center Windows
Following this scenario, you can transfer the administration group structure, included managed devices and other group objects (policies, tasks, global tasks, tags, and device selections) from Kaspersky Security Center Windows under management of Kaspersky Next XDR Expert.
Limitations:
- Migration is only possible from Kaspersky Security Center 14.2 Windows to Kaspersky Next XDR Expert starting from version 1.0.
- You can perform this scenario only by using Kaspersky Security Center Web Console.
Stages
The migration scenario proceeds in stages:
- Choose a migration method
You migrate to Kaspersky Next XDR Expert through the Migration wizard. The Migration wizard steps depend on whether or not Administration Servers of Kaspersky Security Center Windows and Kaspersky Next XDR Expert are arranged into a hierarchy:
- Migration by using a hierarchy of Administration Servers
Choose this option if Administration Server of Kaspersky Security Center Windows acts as secondary to Administration Server of Kaspersky Next XDR Expert. You manage the migration process and switch between Servers within OSMP Console. If you prefer this option, you can arrange Administration Servers into a hierarchy to simplify the migration procedure. To do this, create the hierarchy before starting the migration.
- Migration by using an export file (ZIP archive)
Choose this option if Administration Servers of Kaspersky Security Center Windows and Kaspersky Next XDR Expert are not arranged into a hierarchy. You manage the migration process with two Consoles—an instance for Kaspersky Security Center Windows and OSMP Console. In this case, you will use the export file that you created and downloaded during the export from Kaspersky Security Center Windows and import this file to Kaspersky Next XDR Expert.
- Migration by using a hierarchy of Administration Servers
- Export data from Kaspersky Security Center Windows
Open Kaspersky Security Center Windows, and then run the Migration wizard.
- Import data to Kaspersky Next XDR Expert
Continue the Migration wizard to import the exported data to Kaspersky Next XDR Expert.
If the Servers are arranged into a hierarchy, the import starts automatically after a successful export within the same wizard. If the Servers are not arranged into a hierarchy, you continue the Migration wizard after switching to Kaspersky Next XDR Expert.
- Perform additional actions to transfer objects and settings from Kaspersky Security Center Windows to Kaspersky Next XDR Expert manually (optional step)
You might also want to transfer the objects and settings that cannot be transferred through the Migration wizard. For example, you could additionally do the following:
- Configure global tasks of Administration Server
- Configure Network Agent policy settings
- Create installation packages of applications
- Create virtual Servers
- Assign and configure distribution points
- Configure device moving rules
- Configure rules for auto-tagging devices
- Create application categories
- Move the imported managed devices under management of Kaspersky Next XDR Expert
To complete the migration, move the imported managed devices under management of Kaspersky Next XDR Expert. You can do it by one of the following methods:
- Through Kaspersky Security Center group task
Use the Change Administration Server task to change the Administration Server to a different one for specific client devices.
- Through the klmover utility
Use the klmover utility and specify the connection settings for the new Administration Server.
- Through installation or re-installation of Network Agent on the managed devices
Create a new Network Agent installation package and specify the connection settings for the new Administration Server in the installation package properties. Use the installation package to install Network Agent on the imported managed devices through a remote installation task.
You can also create and use a stand-alone installation package to install Network Agent locally.
- Through Kaspersky Security Center group task
- Update Network Agent to the latest version
We recommend that you upgrade the Network Agent to the same version as OSMP Console.
- Make sure the managed devices are visible on the new Administration Server
On Kaspersky Next XDR Expert Administration Server, open the managed devices list (Assets (Devices) → Managed devices), and check the values in the Visible, Network Agent is installed, and Last connected to Administration Server columns.
Other methods of data migration
Besides the Migration wizard, you can also transfer specific tasks and policies:
- Export the task from Kaspersky Security Center Windows, and then import the tasks to Kaspersky Next XDR Expert.
- Export the policies from Kaspersky Security Center Windows, and then import the policies to Kaspersky Next XDR Expert. The related policy profiles are exported and imported together with the selected policies.
Exporting group objects from Kaspersky Security Center Windows
Migration administration group structure, included managed devices and other group objects from Kaspersky Security Center Windows to Kaspersky Next XDR Expert requires that you first select data for exporting and create an export file. The export file contains information about all group objects that you want to migrate. The export file will be used for subsequent import to Kaspersky Next XDR Expert.
You can export the following objects:
- Tasks and policies of managed applications
- Global tasks
- Custom device selections
- Administration group structure and included devices
- Tags that have been assigned to migrating devices
Before you start exporting, read general information about migration to Kaspersky Next XDR Expert. Choose the migration method—by using or not using the hierarchy of Administration Servers of Kaspersky Security Center Windows and Kaspersky Next XDR Expert.
To export managed devices and related group objects through the Migration wizard:
- Depending on whether or not the Administration Servers of Kaspersky Security Center Windows and Kaspersky Next XDR Expert are arranged into a hierarchy, do one of the following:
- If the Servers are arranged into a hierarchy, open OSMP Console, and then switch to the Server of Kaspersky Security Center Windows.
- If the Servers are not arranged into a hierarchy, open Kaspersky Security Center Web Console connected to Kaspersky Security Center Windows.
- In the main menu, go to Operations → Migration.
- Select Migrate to Kaspersky Security Center Linux or Open Single Management Platform to start the wizard and follow its steps.
- Select the administration group or subgroup to export. Please make sure that the selected administration group or subgroup contains no more than 10,000 devices.
- Select the managed applications whose tasks and policies will be exported. Select only applications that are supported by Kaspersky Next XDR Expert. The objects of unsupported applications will still be exported, but they will not be operable.
- Use the links on the left to select the global tasks, device selections, and reports to export. The Group objects link allows you to exclude custom roles, internal users and security groups, and custom application categories from the export.
The export file (ZIP archive) is created. Depending on whether or not you perform migration with Administration Server hierarchy support, the export file is saved as follows:
- If the Servers are arranged into a hierarchy, the export file is saved to the temporary folder on OSMP Console Server.
- If the Servers are not arranged into a hierarchy, the export file is downloaded to your device.
For migration with Administration Server hierarchy support, the import starts automatically after a successful export. For migration without Administration Server hierarchy support, you can import the saved export file to Kaspersky Next XDR Expert manually.
Page top
Importing the export file to Kaspersky Next XDR Expert
To transfer information about managed devices, objects, and their settings that you exported from Kaspersky Security Center Windows, you must import it to Kaspersky Next XDR Expert.
To import managed devices and related group objects through the Migration wizard:
- Depending on whether or not the Administration Servers of Kaspersky Security Center Windows and Kaspersky Next XDR Expert are arranged into a hierarchy, do one of the following:
- If the Servers are arranged into a hierarchy, proceed to the next step of the Migration wizard after the export is completed. The import starts automatically after a successful export within this wizard (see step 2 of this instruction).
- If the Servers are not arranged into a hierarchy:
- Open OSMP Console.
- In the main menu, go to Operations → Migration.
- Select the export file (ZIP archive) that you created and downloaded during the export from Kaspersky Security Center Windows. The upload of the export file starts.
- After the export file is uploaded successfully, you can continue importing. If the Servers are not arranged into a hierarchy, you can specify another export file by clicking the Change link, and then selecting the required file.
- The entire hierarchy of administration groups of Kaspersky Next XDR Expert is displayed.
Select the check box next to the target administration group to which the objects of the exported administration group (managed devices, policies, tasks, and other group objects) must be restored.
- The import of group objects starts. You cannot minimize the Migration wizard and perform any concurrent operations during the import. Wait until the refresh icons (
 ) next to all items in the list of objects are replaced with green check marks (
 ) and the import finishes.
 - When the import completes, the exported structure of administration groups, including device details, appears under the target administration group that you selected. If the name of the object that you restore is identical to the name of an existing object, the restored object has an incremental suffix added.
If in a migrated task the details of the account under which the task is run are specified, you have to open the task and enter the password again after the import is completed.
If the import has completed with an error, you can do one of the following:
- For migration with Administration Server hierarchy support, you can start to import the export file again. In this case, you have to select the administration group as described at step 3.
- For migration without Administration Server hierarchy support, you can start the Migration wizard to select another export file, and then import it again.
You can check whether the group objects included in the export scope have been successfully imported to Kaspersky Next XDR Expert. To do this, go to the Assets (Devices) section and ensure whether the imported objects appear in the corresponding subsections.
Note that the imported managed devices are displayed in the Managed devices subsection, but they are invisible in the network and Network Agent is not installed and running on them (the No value in the Visible, Network Agent is installed, and Last connected to Administration Server columns).
To complete the migration, you need to switch the managed devices to be under management of Kaspersky Next XDR Expert as described at stage 5 in Migration to Kaspersky Next XDR Expert.
Page top
Switching managed devices to be under management of Kaspersky Next XDR Expert
After a successful import of information about managed devices, objects, and their settings to Kaspersky Next XDR Expert, you need to switch the managed devices to be under management of Kaspersky Next XDR Expert to complete the migration.
You can move the managed devices to be under Kaspersky Next XDR Expert by one of the following methods:
- Using the klmover utility.
- Using the Change Administration Server task.
- Installing Network Agent on the managed devices through a remote installation task.
To switch managed devices to be under management of Kaspersky Next XDR Expert by installing Network Agent:
- Remove Network Agent on the imported managed devices that will be switched under management of Kaspersky Next XDR Expert.
- Switch to Administration Server of Kaspersky Security Center Windows.
- Go to Discovery & deployment → Deployment & assignment → Installation packages, and then open the properties of an existing installation package of Network Agent.
If the installation package of Network Agent is absent in the package list, download a new one.
You can also create and use a stand-alone installation package to install Network Agent locally.
- On the Settings tab, select the Connection section. Specify the connection settings of Administration Server of Kaspersky Next XDR Expert.
- Create a remote installation task for imported managed devices, and then specify the reconfigured Network Agent installation package.
You can install Network Agent through Administration Server of Kaspersky Security Center Windows or through a Windows-based device that acts as a distribution point. If you use Administration Server, enable the Using operating system resources through Administration Server option. If you use a distribution point, enable the Using operating system resources through distribution points option.
- Run the remote installation task.
After the remote installation task finishes successfully, go to Administration Server of Kaspersky Next XDR Expert and ensure that managed devices are visible in the network, and that Network Agent is installed and running on them (the Yes value in the Visible, Network Agent is installed, and Network Agent is running columns).
Page top
About migration from KUMA
This section covers the migration from KUMA standalone to Kaspersky Next XDR Expert. Please note that the provided scenario refers to a situation, where you perform an initial Kaspersky Next XDR Expert installation along with the migration of existing KUMA standalone. If you already have a deployed instance of Kaspersky Next XDR Expert, you will not be able to migrate KUMA standalone with the respective data by following this scenario.
You must migrate data from KUMA 3.4. If you are using an earlier version, you have to update KUMA standalone up to 3.4, and then perform the migration to Kaspersky Next XDR Expert.
You can perform the migration for the following types of KUMA standalone deployment:
- Installation on a single server.
- Distributed installation.
- Distributed installation in a high availability configuration.
Migration implies two stages:
After you complete both stages, the transferred data and services are available. All services of KUMA standalone are configured for operating as a part of Kaspersky Next XDR Expert. Also, the transferred services are restarted.
What is transferred
- The /opt/kaspersky/kuma/core/data directory.
- The encryption key file /opt/kaspersky/kuma/core/encryption/key.
- The MongoDB base backup.
- Hierarchy of Kaspersky Security Center administration servers.
The administration servers that migrate to Kaspersky Next XDR Expert become bound to its root Administration Servers.
- Tenants.
The migrated tenants are registered in Kaspersky Next XDR Expert and become a child of the Root tenant. Each tenant belongs to an administration group in Kaspersky Next XDR Expert.
To migrate Kaspersky Security Center Administration Servers, domain users, and their roles, create a configuration file, and then set necessary parameters in this file.
- Binding of tenants to Kaspersky Security Center Administration Servers.
The secondary administration server of Kaspersky Security Center is registered in the corresponding service of the tenant settings of Kaspersky Security Center.
A link between a tenant and an Administration Server remains the same as it was in KUMA.
You can bind tenants only to physical Administration Servers. Binding tenants to virtual Administration servers is unavailable.
- Domain users.
For each domain with which the KUMA integration is configured, and which users have assigned roles in KUMA tenants, you must run domain controller polling by using Administration Server.
- Roles.
After domain controller polling is finished and the domain users are migrated, these users are assigned XDR roles in Kaspersky Next XDR Expert and the right to connect to Kaspersky Security Center.
If the migrated users had the assigned roles in secondary administration server of Kaspersky Security Center, you have to assign to these users the same roles in the administration group of its root Administration Server.
If you manually assigned XDR roles and/or Kaspersky Security Center roles to the users before running the migrator, after migration is finished, the users are assigned new XDR roles in the tenant specified in the configuration file and the manually assigned XDR roles are deleted. Kaspersky Security Center roles are not overwritten.
- Integration with Kaspersky Security Center.
- Integration with LDAP and third-party systems remain available.
- Events.
- Assets.
- Resources.
- Active services
What is not transferred
- Alerts and incidents are not be available in Kaspersky Next XDR Expert after migration. If you want to have original alerts and incidents at hand, we recommend that you restore KUMA backup on an individual host. This way, you will be able to perform a retrospective scanning.
- Dashboards are not transferred and remain available only in KUMA standalone in the read only mode, you will not be able to go over to the related alerts.
Integration with Active Directory (AD) and Active Directory Federation Services (ADFS).
Migrating KUMA standalone to Kaspersky Next XDR Expert
This article covers transferring data and services from KUMA standalone to Kaspersky Next XDR Expert.
After the migration is complete, all services of KUMA standalone are reconnected to KUMA Core under Kaspersky Next XDR Expert, and then the services are automatically restarted. KUMA standalone Core is not modified during migration, but if any services were installed on the same host as the KUMA standalone Core, the KUMA standalone Core may become unavailable, since the binary files are replaced during the course of the procedure.
To perform the migration from KUMA standalone to Kaspersky Next XDR Expert, complete the following stages:
- Preparing for migration.
- Creating a backup copy.
- Preparing the inventory file for migration.
- Migration.
Preparing for migration
Before you perform the migration, follow the steps:
- In KUMA standalone, generate a new token for a user who has rights to execute the
/api/v1/system/backuprequest, and keep the token in a safe place. Later, you specify the new token to create a backup copy for KUMA standalone. - Prepare the hosts for installation of Kaspersky Next XDR Expert:
- Verify that you opened the required ports.
- Verify that you have SSH root access to the target hosts of KUMA standalone and access from Kaspersky Next XDR Expert worker nodes to port TCP 7223 of the deployed KUMA standalone. If necessary, run the following command to grant SSH root access to the target hosts of KUMA standalone:
ssh-copy-id -i /home/xdr/.ssh/id_rsa.pub <user>@<ip_kuma>
The preparing for migration stage is complete.
Creating a backup copy for KUMA standalone
Create a backup for KUMA standalone and keep the backup in a safe place. You will be able to restore the instance of KUMA standalone and repeat the migration all over again. Otherwise, in case of a failure, KUMA Core may be corrupted and you will not be able to perform the migration.
Before you create a backup, verify that KUMA Core in Kaspersky Next XDR Expert has network access to API ports of KUMA standalone services.
Create the backup file for KUMA standalone and upload it on the target host:
curl -sS -k "https://<KUMA_standalone_core_FQDN>:7223/api/v1/system/backup" -H "Authorization: Bearer $(cat standalone_token)" --output kuma_standalone_backup.tar.gz
Where standalone_token is the token that you previously generated in KUMA standalone.. Also, you can specify the token instead of $(cat standalone_token).
Preparing the inventory file for migration
Prepare the inventory file. In the inventory file, list all hosts that you use for services in KUMA standalone. The hosts must match in both inventory files: the one you used for KUMA standalone deployment and the one you are going to use for migration. If necessary, you can get the required information regarding hosts in KUMA standalone, in Resources → Active services section.
If you want to expand the infrastructure and deploy KUMA services while performing the migration, make sure that you specify the additional hosts in the inventory file, and that the designation of hosts that you listed for migration in the inventory file remains unchanged.
Path to the inventory file that you prepared is specified in the multinode.smp_param.yaml or singlenode.smp_param.yaml file in the inventory parameter.
When preparing the inventory file, verify that you observe the following conditions:
- In the
kuma_utilsgroup of parameters, specify hosts with services. Also, in this group of parameters, if you want to expand the infrastructure along with the migration, you can specify new hosts where KUMA services are be deployed. - For all hosts, specify both FQDN and IP address.
- Skip the
kuma_coresection. - In the
allgroup of parameters, avoid changing theansible_connectionandansible_uservariables, since the variables correspond to the user and the type of connection used for invocation image. - In the
kumagroup of parameters, theansible_connectionandansible_uservariables must correspond to the user who performs the installation on the remote hosts. For details about inventory file, users, and rights, refer to KUMA help. - If DNS resolves all names, you can specify
falsefor thegenerate_etc_hostsparameter or skip thegenerate_etc_hostsparameter.
Sample of the inventory.yaml with KUMA standalone services installed on a single host
Sample of the inventory.yaml with KUMA standalone services installed on multiple hosts.
Migration
To perform the migration:
- Place the KUMA standalone backup copy on a target host, where you are going to install Kaspersky Next XDR Expert.
- On the administrator host, run the following command with the
kuma_backup_fileparameter. Specify the path to the transport archive with the Kaspersky Next XDR Expert components and the path to the prepared multinode.smp_param.yaml or singlenode.smp_param.yaml file, same as for initial installation../kdt apply -k <path_to_transport_archive> -i <path_to_configuration_file> --accept-eula -p --if kuma_backup_file=./<kuma_standalone_backup>.tar.gz
After migration is complete, all services connect to KUMA Core in Kaspersky Next XDR Expert and become available in KUMA Console under Resources → Active services.
If KUMA standalone Core was installed on an individual host, after you perform the migration, KUMA standalone Core maintains the option to address the services migrated to Kaspersky Next XDR Expert. In this case, service statuses are displayed and you are able to restart the services, change the services configuration, get the service log, and view the events. To avoid such case, use any of the following options:
- Before you perform the migration, disable KUMA standalone Core.
- After you perform the migration, in Kaspersky Next XDR Expert, go to KUMA Console Settings → Common and click Reissue internal CA certificates, and then run the following command and wait till KUMA Core and all services are restarted in Kaspersky Next XDR Expert:
./kdt invoke kuma --action resetServicesCert
Running the migrator to transfer data
After migration from KUMA standalone is complete, you have to run the migrator to transfer data.
You can obtain the migrator through Technical Support.
To transfer Kaspersky Security Center Administration Servers, domain users, and assigned roles:
- Run the installation of KUMA migrator in the command line.
kdt apply --force -k kuma-migrator_<version>.tar --accept-eula - Fetch the data for migration by running the following command:
kdt invoke kuma-migrator --action fetch - Copy the result of the data fetch, and then create a configuration file in the YAML format.
- Open the configuration file and insert the result of the data fetch.
If necessary, you can delete Kaspersky Security Center Administration Servers or users that you do not want to migrate.
- For Kaspersky Security Center Administration Servers, specify information in the following fields:
Login.Password.URL. You have to specify the full path by adding https://.Thumbprint_sha1_encoded. You have to specify the SHA1 thumbprint of the Kaspersky Security Center Server certificate.You can get the Administration Server certificate in OSMP Console. To do this, in the main menu, click the settings icon (
 ) next to the name of the required Administration Server, and then on the General tab click the View Administration Server certificate link to download the certificate.
Insecure_skip_verify.The
falsevalue is selected for this parameter by default. In this case, the Administration Server certificate is verified when performing the migration. If you want to disable certificate verification, you can specify thetruevalue in this field.We do not recommend that you disable certificate verification.
- Run the corresponding commands to migrate data.
If you want to migrate all data, run the following command:
kdt invoke kuma-migrator --action migrate-all --param migrationConfigFilePath=<configuration file name>.yamlIf you want to migrate only Kaspersky Security Center Administration Servers, run the following command:
kdt invoke kuma-migrator --action migrate-ksc-servers --param migrationConfigFilePath=<configuration file name>.yamlIf you want to migrate only users, run the following command:
kdt invoke kuma-migrator --action migrate-users --param migrationConfigFilePath=<configuration file name>.yaml
Integration with other solutions
Integration with other solutions allows you to enrich the functionality of Kaspersky Next XDR Expert.
Kaspersky Next XDR Expert supports integration with the following Kaspersky and third-party solutions:
- Kaspersky Automated Security Awareness Platform
- Kaspersky Threat Intelligence Portal
- Kaspersky Anti-Targeted Attack Platform / Kaspersky Endpoint Detection and Response
- Active Directory
- UserGate
- Ideco NGFW
- Ideco UTM
- Redmine
- Check Point NGFW
- Sophos Firewall
- Continent 4
- SKDPU NT
- FortiGate
Kaspersky Next XDR Expert also supports more than 100 event sources. For the full list of supported event sources, refer to the Supported event sources section.
Integration settings can be specified for a tenant of any level. Parent integration settings are copied to a child tenant. You can edit the copied child integration settings, since child and parent settings are not related and changes in child settings do not affect the settings in the parent tenant.
For the shared tenant, you do not need to configure the integration settings.
If you need to disable integration, you can do it manually in the Settings → Tenants.
Integration with a Kaspersky solution is removed automatically when the tenant for which the integration was specified is removed. The delay when removing data is up to 24 hours. Restoring integration settings is not available.
Integration with Kaspersky Automated Security Awareness Platform
Kaspersky Automated Security Awareness Platform (hereinafter also referred to as KASAP) is an online learning platform that allows users to learn the rules of information security and related threats in their daily work, as well as to practice with real examples.
After configuring integration, you can perform the following tasks in Kaspersky Next XDR Expert:
- Assign learning courses to users who are associated with alerts and incidents.
- Change user learning groups.
- View information about the courses taken by the users and the certificates they received.
KASAP is considered to be integrated with Kaspersky Next XDR Expert after the integration between KASAP and KUMA is configured.
Before configuring integration between KASAP and KUMA, you need to create an authorization token and obtain a URL for API requests in KASAP.
Creating a token in KASAP and getting a URL for API requests
Creating a token
To authorize API requests from KUMA to KASAP, the requests must be signed with a token created in KASAP.
Only the company's administrator can create a token.
To create a token:
- Sign in to the KASAP web interface.
- In the Dashboard section, select the Import and sync section, and then open the OpenAPI tab.
- Click the New token button.
- In the window that opens, select the token rights available during integration:
- GET /openapi/v1/groups
- POST /openapi/v1/report
- PATCH /openapi/v1/user/:userid
- Click the Generate token button.
The generated token is displayed on the screen.
- Copy the token and save it in any convenient way. This token is required to configure integration between KASAP and KUMA.
The token is not stored in the KASAP system in the open form. After you close the Create token window, the token is unavailable for viewing. If you close the window without copying the token, you will need to click the Reissue token button for the system to generate a new token.
The issued token is valid for 12 months.
Getting a URL for API requests
The URL is used for interacting with KASAP via OpenAPI. You have to specify this URL when configuring integration between KASAP and KUMA.
To get the URL used in KASAP for API requests:
- Sign in to the KASAP web interface.
- In the Dashboard section, select the Import and sync section, and then open the OpenAPI tab.
- In the OpenAPI URL field, copy the URL, and then save it in any convenient way.
Integration with Kaspersky Threat Intelligence Portal
You must configure integration with Kaspersky Threat Intelligence Portal (hereinafter also referred to as Kaspersky TIP) to obtain information about the reputation of the observable objects.
Before configuring the settings, you have to create an authorization token for API requests on Kaspersky TIP or Kaspersky OpenTIP.
To configure integration between Kaspersky Next XDR Expert and Kaspersky TIP:
- In the main menu, go to Settings → Tenants.
The list of tenants is displayed on the screen.
- Click the name of the required tenant.
The tenant's properties window opens.
- Go to the Settings tab, and then select the Kaspersky TIP section.
You can edit the Kaspersky TIP section if you are assigned one of the following XDR roles: Main administrator, Tenant administrator, or SOC administrator.
- If at step 2 you selected the Root tenant, you can turn on the Proxy toggle button to use a proxy server for interaction with Kaspersky TIP.
The proxy server is configured in the root Administration Server properties.
- In the Cache TTL field, specify the period of cache storage and the units: days or hours.
By default, 7 days is set. If you do not specify any value, the period of cache storage is unlimited.
You set the period of cache storage for all connections.
- Turn on the Integration toggle button for one of the following services:
- Kaspersky TIP (General access)
After you add an authorization token, you will be able to obtain information from Kaspersky TIP about the following types of observables listed at the Observables tab in the alert or incident details: domain, URL, IP, MD5, SHA256. The information is updated in the Enrichment column. Quota is consumed when you request data.
- Kaspersky TIP (Premium access)
After you add an authorization token, you will be able to do the following:
- Obtain information from Kaspersky TIP about the following types of observables listed at the Observables tab in the alert or incident details: domain, URL, IP, MD5, SHA256. The information is updated in the Enrichment column. Quota is consumed when you request data.
- Obtain information from Kaspersky TIP about the following types of observables listed at the Observables tab in the alert or incident details: domain, URL, IP, MD5, SHA256. The information is updated in the Status update column. Quota is not consumed when you request data.
- Kaspersky TIP (General access)
- Click the Add token button.
- In the window that opens, enter the authorization token, and then click the Add button.
For details about generating an authorization token for API requests, refer to the Kaspersky TIP or Kaspersky OpenTIP help.
After you add the token, you can change it by clicking the Replace button, and then entering a new token in the window that opens. This may be necessary if the token is expired.
- Click the Save button.
Integration with KATA/KEDR
Kaspersky Endpoint Detection and Response (hereinafter also referred to as KEDR) is a functional block of Kaspersky Anti Targeted Attack Platform (hereinafter also referred to as KATA) that protects assets in an enterprise LAN.
You can configure integration between Kaspersky Next XDR Expert and KATA/KEDR to manage threat response actions on assets connected to Kaspersky Endpoint Detection and Response servers. Commands to perform operations are received by the Kaspersky Endpoint Detection and Response server, which then relays those commands to Kaspersky Endpoint Agent installed on assets.
To configure integration between Kaspersky Next XDR Expert and KATA/KEDR:
- In the main menu, go to Settings → Tenants.
The list of tenants is displayed on the screen.
- Click the name of the required tenant.
The tenant's properties window opens.
- Go to the Settings tab, and then select the KATA/KEDR section.
You can edit the KATA/KEDR section, if you are assigned one of the following XDR roles: Main administrator, Tenant administrator or SOC administrator.
- Turn on the KATA integration toggle button.
- Click the Add connection button, and then in the window that opens do the following:
- In the IP address or host name field, enter one of the following:
- hostname
- IPv4
- IPv6
- In the Port field, set a port.
- Click the Save button.
The window is closed.
If the connection is not added, an error message is displayed.
If the connection is added successfully, an appropriate message is displayed on the screen. An XDR ID, certificate, and private key are generated and displayed in the corresponding fields. If necessary, you can generate the new certificate and private key by clicking the Generate button.
To ensure that the connection is established successfully, click the Check connection button. The result is displayed in the Connection status parameter.
- In the IP address or host name field, enter one of the following:
- Click the Save button to save the settings.
After you add the connection, you can edit or delete it by clicking the corresponding icons. You can also add another connection by performing steps 1–6.
If you want to receive information about Kaspersky Endpoint Detection and Response alerts, you need to configure integration between the KUMA component and KATA/KEDR.
Page top
Configuring custom integrations
You can respond to alerts and incidents via external systems by launching third-party scripts on remote client devices. To enable this option, you have to configure the environment and integration between Kaspersky Next XDR Expert and the script launch service.
To configure environment for launching third-party custom scripts, you must:
- Set a device on which the third-party custom script is launched.
- Configure integration between Kaspersky Next XDR Expert and the script launch service.
- Create a playbook that will be used to launch the script.
It is the customer who provides access to third-party custom scripts and updates the scripts.
To configure integration between Kaspersky Next XDR Expert and the script launch service:
- In the main menu, go to Settings → Tenants.
The list of tenants is displayed on the screen.
- Click the name of the required tenant.
The tenant's properties window opens.
- Go to the Settings tab, and then in the Custom integration section:
- Turn on the Custom integration toggle button.
- In the Remote host verification section, turn on the Verify the host before connecting toggle button, and then fill in the Public key field to enable verification of a client device in Kaspersky Next XDR Expert.
- In the Remote host connection section, do the following:
- Fill in the IP address or host name and Ports fields.
- Select an SSH authentication method that will be used to establish a secure connection with a remote device:
- User name and password. If you select this authentication method, at the next step you must enter the user name and password.
- SSH key. If you select this authentication method, at the next step you must enter the user name and SSH key.
- Click the Add data button.
- In the window that opens, enter the required data, and then click the Save button.
If you want to edit the data you saved, click the Replace button, enter new data in the window that opens, and then save the edits.
To ensure that the connection is established successfully, click the Check connection button. The result is displayed in the Connection status parameter.
- Click the Save button to save the settings.
Integration between Kaspersky Next XDR Expert and the script launch service is configured. You can perform response actions on remote devices by launching playbooks.
Page top
Threat detection
Open Single Management Platform uses alerts and incidents as work items that are to be processed by analysts.
The Alerts and Incidents sections are displayed in the main menu if the following conditions are met:
- You have a license key for Kaspersky Next XDR Expert.
- You are connected to the root Administration Server in OSMP Console.
- You have one of the following XDR roles: Main administrator, Tenant administrator, Junior analyst, Tier 1 analyst, Tier 2 analyst, SOC manager, Interaction with NCIRCC, Approver, Observer.
Working with alerts
This section contains general information about alerts, their properties, typical life cycle, and connection with incidents. The instructions that are provided will help you analyze the alert table, change alert properties according to the current state in the life cycle, and combine alerts into incidents by linking or unlinking the alerts.
The Alerts section is displayed in the main menu if the following conditions are met:
- You have a license key for Kaspersky Next XDR Expert.
- You are connected to the root Administration Server in OSMP Console.
- You have one of the following XDR roles: Main administrator, Tenant administrator, Junior analyst, Tier 1 analyst, Tier 2 analyst, SOC manager, Interaction with NCIRCC, Approver, Observer.
About alerts
An alert is an event in the organization's IT infrastructure that was marked by Open Single Management Platform as unusual or suspicious, and that may pose a threat to the security of the organization's IT infrastructure.
Open Single Management Platform generates an alert when an EPP application (for example, Kaspersky Endpoint Security for Windows) detects certain activity in the infrastructure that corresponds to conditions defined in the detection rules.
The alert is created within 30 seconds after the KUMA correlation event has occurred.
You can also create an alert manually from a set of events.
After detection, Open Single Management Platform adds alerts to the alert table as work items that are to be processed by analysts. You cannot delete alerts—you can only close them.
Alerts can be assigned only to analysts who have the access right to read and modify alerts and incidents.
You can manage alerts as work items by using the following alert properties:
You can combine and link alerts to bigger work items called incidents. You can link alerts to incidents manually, or enable the rules to create incidents and link alerts automatically. By using incidents, analysts can investigate multiple alerts as a single issue. When you link a currently unlinked alert to an incident, the alert loses its current status and gains the status In incident. You can link a currently linked alert to another incident. In this case, the In incident status of the alert is kept. You can link a maximum of 200 alerts to an incident.
Each alert has alert details that provide all of the information related to the alert. You can use this information to investigate the alert, track the events that preceded the alert, view detection artifacts, affected assets, or link the alert to an incident.
Alert data model
The structure of an alert is represented by fields that contain values (see the table below). Some fields are objects or arrays of objects with their own set of fields (for example, the Assignee and Assets fields).
Alert
Field |
Value type |
Is required |
Description |
|
String |
Yes |
Internal alert ID, in the UUID format. The field value may match the |
|
Integer |
Yes |
Short internal alert ID. |
|
String |
Yes |
ID of the tenant that the alert is associated with, in the UUID format. |
|
String |
Yes |
Date and time of the alert generation, in the RFC 3339 format. |
|
String |
Yes |
Date and time of the last alert change, in the RFC 3339 format. |
|
String |
No |
Date and time of the last alert status change, in the RFC 3339 format. |
|
String |
Yes |
Severity of the alert. Possible values:
|
|
String |
Yes |
ID of the Kaspersky application management plug-in that is integrated in OSMP. |
|
String |
Yes |
Version of the Kaspersky application management plug-in that is integrated in OSMP. |
|
String |
No |
Unique alert identifier in the integrated component. |
|
String |
No |
Date and time of the alert generation in the integrated component, in the RFC 3339 format. |
|
String |
Yes |
Date and time of the first telemetry event related to the alert, in the RFC 3339 format. |
|
String |
Yes |
Date and time of the last telemetry event related to the alert, in the RFC 3339 format. |
|
String |
No |
Component that detects and generates the alert. |
|
Array of strings |
No |
Triggered detection technology. |
|
String |
Yes |
Alert status. Possible values:
|
|
String |
No |
Resolution of the alert status. Possible values:
|
|
String |
No |
Internal ID of the incident associated with the alert. |
|
String |
No |
Way to add an alert to an incident. Possible values:
|
|
|
No |
Operator to whom the alert is assigned. |
|
Array of |
No |
MITRE tactics related to all triggered IOA rules in the alert. |
|
Array of |
No |
MITRE techniques related to all triggered IOA rules in the alert. |
|
Array of |
No |
Observables related to the alert. |
|
Array of |
No |
Assets affected by the alert. |
|
Array of |
No |
Triggered correlation rules, on the basis of which the alert is generated. |
|
Array of objects |
No |
Events, on the basis of which the alert is generated. |
|
String |
Yes |
Link to an entity in an external system (for example, a link to a Jira ticket). |
|
Object |
No |
Data related to the alert, in the JSON format. This data is obtained from managed Kaspersky applications when events are transformed into alerts. This field is not used in the interface. |
|
Object |
No |
Additional information about the alert, in the JSON format. This information can be filled in by a user or a playbook. |
|
String |
Yes |
Alert name. |
|
Array of |
No |
Attachments related to the incident. |
Assignee
Field |
Value type |
Is required |
Description |
|
String |
Yes |
User account ID of the operator to whom the alert is assigned. |
|
String |
Yes |
Name of the operator to whom the alert is assigned. |
MITRETactic
Field |
Value type |
Is required |
Description |
|
String |
Yes |
ID of the MITRE tactic related to all triggered IOA rules in the alert. |
|
String |
Yes |
Name of the MITRE tactic related to all triggered IOA rules in the alert. |
MITRETechnique
Field |
Value type |
Is required |
Description |
|
String |
Yes |
ID of the MITRE technique related to all triggered IOA rules in the alert. |
|
String |
Yes |
Name of the MITRE technique related to all triggered IOA rules in the alert. |
Observable
Field |
Value type |
Is required |
Description |
|
String |
Yes |
Type of the observable object. Possible values:
|
|
String |
Yes |
Value of the observable object. |
|
String |
No |
Additional information about the observable object. |
Rule
Field |
Value type |
Is required |
Description |
|
String |
Yes |
ID of the triggered rule. |
|
String |
No |
Name of the triggered rule. |
|
String |
No |
Severity of the triggered rule. Possible values:
|
|
String |
No |
Confidence level of the triggered rule. Possible values:
|
|
Boolean |
No |
Indicator that the alert is based on custom rules. |
Asset
Field |
Value type |
Is required |
Description |
|
String |
Yes |
Type of the affected asset (a device or an account). Possible values:
|
|
String |
Yes |
ID of the affected asset (a device or an account). |
|
String |
No |
The name of the affected device that the alert is associated with (if The user name of the affected user account associated with events, on the basis of which the alert is generated (if |
|
Boolean |
No |
Indicator that the affected asset (a device or an account) is an attacker. |
|
Boolean |
No |
Indicator that the affected asset (a device or an account) is a victim. |
UnkeyedAttachment
Field |
Value type |
Is required |
Description |
|
String |
Yes |
Attachment ID, in the UUID format. |
|
String |
Yes |
Attachment name. |
|
String |
Yes |
Date and time of the attachment creation, in the UTC format. |
|
String |
Yes |
Date and time of the last attachment change, in the UTC format. |
|
String |
Yes |
Indicator that the affected asset (a device or an account) is a victim. |
|
Integer |
Yes |
Attachment size, specified in bytes. |
|
String |
Yes |
Attachment status that indicates whether the attachment upload is in progress, completed, or aborted with an error. Possible values:
|
|
String |
No |
Attachment description. |
|
String |
No |
Text of the status that is displayed to a user (for example, an error message that is displayed when the attachment upload fails). |
Viewing the alert table
The alert table provides you with an overview of all alerts registered by Open Single Management Platform.
To view the alert table:
- In the main menu, go to Monitoring & reporting → Alerts.
- If necessary, apply the tenant filter. By default, the tenant filter is disabled and the alert table displays the alerts related to all of the tenants to which you have access rights. To apply the tenant filter:
- Click the link next to the Tenant filter setting.
The tenant filter opens.
- Select the check boxes next to the required tenants.
The alert table displays only the alerts detected on the selected tenants.
- Click the link next to the Tenant filter setting.
The alert table is displayed.
The alert table has the following columns:
- Alert ID. The unique identifier of an alert.
- Registered. The date and time when the alert was added to the alert table.
- Updated. The date and time of the last change from the alert history.
- Status. The current status of the alert.
- Analyst. The current assignee of the alert.
- Tenant. The name of the tenant in which the alert was detected.
- Technology. The technology that detected the alert.
- Rules. The IOC or IOA rules that were triggered to detect the alert.
- Affected assets. The devices and users that were affected by the alert.
- Observables. Detection artifacts, for example IP addresses or MD5 hashes of files.
- Incident link type. Way to add an alert to an incident.
- Severity. Severity of the alert.
- Status changed. The date and time of the last alert status change.
Viewing alert details
Alert details are a page in the interface that contains all of the information related to the alert, including the alert properties.
To view alert details:
- In the main menu, go to Monitoring & reporting → Alerts.
- In the alert table, click the ID of the required alert.
The alert details are displayed.
If necessary, you can refresh the information in the alert details by clicking the refresh () icon next to the alert name.
The toolbar in the upper part of the alert details allows you to perform the following actions:
- Edit the External reference field value
- Assign the alert to an analyst
- Change the alert status
- Link the alert to an incident
- Unlink the alert from the incident
- Select a playbook
- Create a new incident and link the alert to it
Alert details contain the following sections:
- Summary
- Details
- Assets
- Files
- Observables
- Similar closed alerts
In the Similar closed alerts section you can view the list of closed alerts that have the same affected artifacts as the current alert. The affected artifacts include observables and affected devices. The similar closed alerts can help you investigate the current alert.
By using the list, you can evaluate the degree of similarity of the current alert and other alerts. The similarity is calculated as follows:
Similarity = M / T * 100
Here, 'M' is a number of artifacts that matched in the current and a similar alert, and 'T' is total number of artifacts in the current alert.
If the similarity is 100%, the current alert has nothing new in comparison with the similar alert. If the similarity is 0%, the current and the similar alert are completely different. Alerts that have a similarity of 0% are not included in the list.
The calculated value is rounded off to the nearest whole number. If similarity is equal to a value between 0% and 1%, the application does not round such a value down to 0%. In this case, the value is displayed as less than 1%.
Clicking an alert ID opens the alert details.
Customizing the similar closed alerts list
You can customize the table by using the following options:
- Filter the alerts by selecting the term for which the alerts have been updated. By default, the list contains the alerts that have been updated for the last 30 days.
- Click the Columns settings icon (
 ), and then select which columns to display and in which order.
 - Click the Filter icon (
 ), and then select and configure the filters that you want to apply. If you select several filters, they are applied simultaneously by logical AND operator.
 - Click a column header, and then select the sorting options. You can sort the alerts in ascending or descending order.
- Similar incidents
In the Similar incidents section, you can view the list of incidents that have the same affected artifacts as the current alert. The affected artifacts include observables and affected devices. The similar incidents can help you decide if the current alert may be linked to an existing incident.
By using the list, you can evaluate the degree of similarity of the current alert and the incidents. The similarity is calculated as follows:
Similarity = M / T * 100
Here, 'M' is a number of artifacts that matched in the current alert and a similar incident, and 'T' is total number of artifacts in the current alert.
If the similarity is 100%, the current alert has nothing new in comparison with the similar incident. If the similarity is 0%, the current alert and the similar incident are completely different. Incidents that have similarity of 0% are not included in the list.
The calculated value is rounded off to the nearest whole number. If the similarity is equal to a value between 0% and 1%, the application does not round such a value down to 0%. In this case, the value is displayed as less than 1%.
Clicking an incident ID opens the incident details.
Customizing the similar incidents list
You can customize the table by using the following options:
- Filter the incidents by selecting the term for which the incidents have been updated. By default, the list contains the incidents that have been updated for the last 30 days.
- Click the Columns settings icon (), and then select which columns to display and in which order.
- Click the Filter icon (), and then select and configure the filters that you want to apply. If you select several filters, they are applied simultaneously by logical AND operator.
- Click a column header, and then select the sorting options. You can sort the incidents in ascending or descending order.
- Comments
- History
Assigning alerts to analysts
As a work item, an alert can be assigned to an SOC analyst for inspection and possible investigation. You can change the assignee of an active alert at any time. You cannot change an assignee of a closed alert.
Alerts can be assigned only to analysts who have the access right to read and modify alerts and incidents.
To assign one or several alerts to an analyst:
- In the main menu, go to Monitoring & reporting → Alerts.
- Select the check boxes next to the alerts that you want to assign to an analyst.
You must select only the alerts detected in the same tenant. Otherwise, the Assign to button will be disabled.
Alternatively, you can assign an alert to an analyst from the alert details. To open the alert details, click the link with the alert ID you need.
- Click the Assign to button.
- In the Assign to analyst window that opens, start typing the analyst's name or email address, and then select the analyst from the list.
You can also select the Not assigned option for all alerts, except alerts with the Closed status.
- Click the Assign button.
The alerts are assigned to the analyst.
You also can assign an alert to an analyst by using playbooks.
Changing an alert status
As a work item, an alert has a status that shows the current state of the alert in its life cycle.
You can change alert statuses for your own alerts or the alerts of other analysts only if you have the access right to read and modify alerts and incidents.
If the alert status is changed manually, playbooks will not launch automatically. You can launch a playbook for such an alert manually.
An alert can have one of the following statuses:
To change the status of one or several alerts:
- In the main menu, go to Monitoring & reporting → Alerts.
- Do one of the following:
- Select the check boxes next to the alerts whose status you want to change.
- Click the link with the ID of the alert whose status you want to change.
The Alert details window opens.
- Click the Change status button.
- In the Change status pane, select the status to set.
If you select the Closed status, you must select a resolution.
If you change the alert status to Closed and this alert contains uncompleted playbooks or response actions, all related playbooks and response actions will be terminated.
- Click the Save button.
The status of the selected alerts is changed.
If an alert is added to the investigation graph, you can also change the alert status through the graph.
You also can change the alert status by using playbooks.
Creating alerts manually
You can create an alert manually from a set of events. You can use this functionality to examine a hypothetical incident that has not been detected automatically.
If the alert is created manually, playbooks will not launch automatically. You can launch a playbook for such an alert manually.
To create an alert manually:
- In the main menu, go to Monitoring & reporting → Threat hunting.
- Select the events for which you want to create an alert. The events should belong to the same tenant.
- Click the Create alert button.
A window shows up that displays the created alert. The Severity field value corresponds to the maximum severity among the selected events.
Manually created alerts have a blank Rules value in the Monitoring & reporting → Alerts table.
Page top
Linking alerts to incidents
You can link one or multiple alerts to an incident for the following reasons:
- Multiple alerts may be interpreted as indicators of the same issue in an organization's IT infrastructure. If this is the case, the alerts in the incident can be investigated as a single issue. You can link up to 200 alerts to an incident.
- A single alert may be linked to an incident if the alert is defined as true positive.
You can link an alert to an incident if the alert has any status other than Closed. When linked to an incident, an alert loses its current status and gains the special status In incident. If you link alerts that are currently linked to other incidents, the alerts are unlinked from the current incidents, because an alert can be linked to only one incident.
Alerts can only be linked to an incident that belongs to the same tenant.
Alerts can be linked to an incident manually or automatically.
Linking alerts manually
To link alerts to an existing or new incident:
- In the main menu, go to Monitoring & reporting → Alerts.
- Select the check boxes next to the alerts that you want to link to an incident.
- If you want to link alerts to an existing incident:
- Click the Link to incident button.
- Select an incident to link the alerts to.
Alternatively, click an alert to display its details and click the Link to incident button in the toolbar at the top.
- If you want to link alerts to a new incident:
- Click the Create incident button.
- Fill in the properties of the new incident: name, assignee, priority, and description.
Alternatively, click an alert to display its details and click the Create incident button in the toolbar at the top.
- Click the Save button.
The selected alerts are linked to an existing or new incident.
Linking alerts automatically
If you want alerts to automatically link to an incident, you have to configure segmentation rules.
Unlinking alerts from incidents
You might need to unlink an alert from an incident, for example, if the alert analysis and investigation showed that the alert is not connected to other alerts in the incident. When you unlink an alert from an incident, Open Single Management Platform performs the following actions:
- Refreshes all of the data related to the incident, to reflect that the alert no longer belongs to the incident. For example, you can view the changes in the incident details.
- Resets the status of the unlinked alerts to New.
To unlink an alert from an incident:
- Open the alert details.
- Click the Unlink from incident button in the toolbar at the top.
The Unlink alerts window opens.
- If you want to change the assignee, select Assign the alerts to, and then specify the new assignee.
- If you want to add a comment, specify it in the Comment section. The comment you specify will be displayed in the Details column in the History section.
The selected alerts are unlinked from the incident.
Linking events to alerts
If during the investigation you found an event that is related to the alert being investigated, you can link this event to the alert manually.
You can link an event to an alert that has any status other than Closed.
To link an event to an alert:
- In the main menu, go to Monitoring & reporting → Alerts.
- In the list of alerts, click the link with the ID of the alert to which you want to link the event.
The Alert details window opens.
- Go to the Details section, and then click the Find in Threat hunting button.
The Threat hunting section opens. By default, the event table contains events related to the selected alert.
The event table contains only events related to tenants that you have access to.
- In the upper part of the window, open the first drop-down list, and then select Storage.
- Open the third drop-down list, and then specify the time range.
You can select predefined ranges relative to the current date and time, specify a custom range by using the Range start and Range end fields, or by selecting dates in the calendar.
- Click the Run query button.
- In the updated list of events, select an event that you want to link to the alert, and then click Link to alert.
The selected events are linked to the alert.
Page top
Unlinking events from alerts
You might need to unlink an event from an alert, for example, if the alert analysis and investigation showed that the event is not connected to the alert.
To unlink an event from an alert:
- In the main menu, go to Monitoring & reporting → Alerts.
- In the list of alerts, click the link with the ID of the alert from which you want to unlink the event.
The Alert details window opens.
- In the Details section, select the events that you want to unlink, and then click the Unlink from alert button.
The selected event are unlinked from the alert.
Page top
Editing alerts by using playbooks
Kaspersky Next XDR Expert allows you to edit incidents manually or by using playbooks. When creating a playbook, you can configure the playbook algorithm to edit the alert properties.
To edit an alert by using a playbook, you must have one of the following XDR roles: Main administrator, SOC administrator, Tier 1 analyst, Tier 2 analyst, or Tenant administrator.
You cannot edit alerts that have the Closed status.
You can edit the following alerts properties by using the playbook:
- Assignee
- Alert status
- Comment
- ExternalReference attribute
- Additional data attribute
Examples of the expressions that you can use in the playbook algorithm to edit the alert properties:
- Assigning an alert to a user
- Unassigning an alert from a user
- Changing the alert status
- Adding a comment to an alert
- Editing the ExternalReference attribute
- Editing the Additional data attribute
Working with alerts on the investigation graph
On the investigation graph, you can perform the following actions with alerts:
- Add an alert to the graph.
- Hide an alert from the graph.
- View an alert details by selecting the corresponding item from the context menu of the alert node.
- Change an alert status.
- View events related to an alert.
- View assets related to an alert.
- View observables related to an alert.
Adding alerts to the investigation graph
You can add an alert to the investigation graph in one of the of the following ways:
- From the general table of alerts that opens when you click the Add alert button on the investigation graph. You have to select the check boxes next to the alerts that you want to be displayed on the investigation graph, and then click the Show on graph button.
- From the table of similar alerts.
To add an alert to the investigation graph from the table of similar alerts:
- Do one of the following:
- If on the investigation graph you have an asset, observable, or segmentation rule, click its node, and then in the context menu, click Find similar alerts.
- If on the investigation graph you have an event, click its node, and then in the context menu, click View details. In the window that opens, click the Show on graph button.
- If on the investigation graph you have an alert, click its node, and in the context menu, click Events. In the table of events, click the event whose details you want to open. If the event details contain an observable, asset, or segmentation rule, click the link in the corresponding field, and then in the context menu, click Find similar alerts.
- On the investigation graph, click the Threat hunting button, and then in the general table of events, click the event whose details you want to open. If the event details contain an observable, asset, or segmentation rule, click the link in the corresponding field, and then in the context menu, click Find similar alerts.
The table of similar alerts is displayed.
- Select the check boxes next to the alerts that you want to be displayed on the investigation graph, and then click the Show on graph button.
The selected alerts are added to the investigation graph.
Hiding alerts from the investigation graph
You can hide an alert from the investigation graph in one of the following ways:
- By clicking the alert node and selecting Hide in the context menu.
- Through the table of alerts.
To hide an alert from the graph through the table of alerts:
- Do one of the following:
- In the toolbar at the top of the investigation graph, click the Add alert button.
- If you have observables, assets, or events nodes displayed on the graph, click the node for which you want to add an alert, and then in the context menu, select Find similar alerts.
The table of alerts is displayed.
- Select the check boxes next to the alerts that you want to hide from the investigation graph, and then click the Show on graph button.
The selected alerts and their links will be hidden from the investigation graph. The related nodes remain on the investigation graph.
Changing an alert status
To change an alert status:
- Click the alert node, and in the context menu, select Change status.
- In the Change status pane that opens, select the status, and then click Save.
If you select the Closed status, you must select a resolution.
The status of the selected alerts is changed.
Viewing the events related to an alert
To view events related to an alert, do one of the following:
- Click the digit next to the alert node for which you want to display the events. The digit shows the number of events related to the alert.
- Click the alert node for which you want to display the events, and then in the context menu, click Events.
If you want to add the events from the table to the investigation graph, select the check boxes next to the events, and then click the Show on graph button.
If you want to hide the events from the investigation graph, select the check boxes next to the events, and then click the Hide on graph button.
Viewing assets related to an alert
To view assets related to an alert, click the alert node.
In the context menu, the digits next to the Devices and Users items show the number of devices and users related to the alert.
If you want to add devices or users to the investigation graph, click the corresponding menu item.
Viewing observables related to an alert
To view observables related to an alert, click the alert node, and in the context menu, click Events.
In the menu that opens, the digits next to the items show the number of observables relate related to the alert.
If you want to add an observable (for example, Hash, Domain, IP address) to the investigation graph, click the corresponding menu item.
Page top
Aggregation rules
You can use aggregation rules to combine correlation events into alerts. We recommend that you use segmentation rules together with aggregation rules to define more precise rules for creating incidents.
The default Kaspersky Next XDR Expert behavior is to combine events that have the same rule identifier with the following limitations:
- By time, within 30 seconds
- By the number of events, 100
- By the number of assets, 100
- By the number of observables, 200
- By total size of events, 4 MB
You can use REST API to customize aggregation rules.
Aggregation rules. Example
The table below illustrates how to perform penetration testing with predetermined IP and user accounts.
Rule 1. Penetration testing by IP
Attribute |
Value |
Description |
Priority |
0 |
Highest priority. |
Trigger |
any(.Observables[]? | select(.Type == "ip") | .Value; . == "10.10.10.10" or . == "10.20.20.20") |
Triggers if an alert includes an IP observable with any of the following values:
|
Aggregation ID |
"Pentest" |
Specifies the identifier by which to combine events in an alert. |
Alert Name |
"[Pentest] " + ([.Rules[]?.Name] | join(",")) |
Adds the "[Pentest]" tag and the rule name to the alert name. The rule name is from the first aggregated alert, subsequent alerts do not affect the resulting alert name even if they were created by a different rule. |
Aggregation Interval |
30 seconds |
|
Rule 2. Penetration testing by user account
Attribute |
Value |
Description |
Priority |
1 |
|
Trigger |
any(.Observables[]? | select(.Type | ascii_downcase == "username") | .Value; . == "Pentester-1" or . == "Pentester-2") |
Triggers if an alert includes a username observable with any of the following values:
|
Aggregation ID |
"Pentest" |
Specifies the identifier by which to combine events in an alert. |
Alert Name |
"[Pentest] " + ([.Rules[]?.Name] | join(",")) |
Adds the "[Pentest]" tag and the rule name to the alert name. The rule name is from the first aggregated event, subsequently aggregated events do not affect the resulting alert name. |
Aggregation Interval |
30 seconds |
|
Rule 3. Aggregation rule
Attribute |
Value |
Description |
Priority |
2 |
|
Trigger |
.Rules | length > 0 |
Triggers if the rule list is not empty. |
Aggregation ID |
([.Rules[].ID // empty] | sort | join(";")) |
Combines rule identifiers. |
Alert Name |
([.Rules[]?.Name // empty] | sort | join(",")) + " " + (.SourceCreatedAt) |
Combines rule names and adds the alert creation date. |
Aggregation Interval |
30 seconds |
|
Aggregation and segmentation rules. Example
The table below illustrates how to combine alerts that have the same rule id in two incidents based on the user name prefix.
Aggregation rule
Attribute |
Value |
Description |
Trigger |
any(.Rules[]?; .ID == "123") |
Searches alerts with the rule id set to "123". |
Aggregation ID |
if any(.OriginalEvents[]?.BaseEvents[]?.DestinationUserName // empty; startswith("adm_")) then "rule123_DestinationUserName_adm" else "rule123_DestinationUserName_not_adm" end |
Searches for user names with the "adm_" prefix. |
Alert Name |
if any(.OriginalEvents[]?.BaseEvents[]?.DestinationUserName // empty; startswith("adm_")) then "Rule123 admin" else "Rule123 not admin" end |
Sets the alert name depending on the user name prefix. |
Segmentation rule
Attribute |
Value |
Trigger |
.AggregationID | startswith("rule123_DestinationUserName") |
Groups |
[.AggregationID] |
Incident Name |
.Name |
Working with incidents
This section contains general information about incidents, their properties, typical life cycle, and connection with alerts. This section also gives instructions on how to create incidents, analyze the incident table, change incident properties according to the current state in the life cycle, and merge incidents.
The Incidents section is displayed in the main menu if the following conditions are met:
- You have a license key for Kaspersky Next XDR Expert.
- You are connected to the root Administration Server in OSMP Console.
- You have one of the following XDR roles: Main administrator, Tenant administrator, Junior analyst, Tier 1 analyst, Tier 2 analyst, SOC manager, Interaction with NCIRCC, Approver, Observer.
About incidents
An incident is a container of alerts that normally indicates a true positive issue in the organization's IT infrastructure. An incident may contain a single or several alerts. By using incidents, analysts can investigate multiple alerts as a single issue.
You can create incidents manually or enable the rules for automatic creation of incidents. After an incident is created, you can link alerts to the incident. You can link no more than 200 alerts to an incident.
After creation, Open Single Management Platform adds incidents to the incident table as work items that are to be processed by analysts.
Incidents can be assigned only to analysts who have the access right to read and modify alerts and incidents.
You can manage incidents as work items by using the following incident properties:
Two or more incidents may be interpreted as indicators of the same issue in an organization's IT infrastructure. If this is the case, you can merge the incidents to investigate them as a single issue.
Each incident has incident details that provide all of the information related to the incident. You can use this information to investigate the incident or merge incidents.
For each incident, you can create child incidents. Child incidents allow you to investigate and respond to incidents across different tenants. You can also create a child incident of another child incident. A parent incident can have no more than 200 child incidents.
Incident data model
The structure of an incident is represented by fields that contain values (see the table below). Some fields are objects or arrays of objects with their own set of fields (for example, the Assignee and Alerts fields).
Incident
Field |
Value type |
Is required |
Description |
|
String |
Yes |
Internal incident ID, in the UUID format. |
|
Integer |
Yes |
Short internal incident ID. |
|
String |
Yes |
ID of the tenant that the incident is associated with, in the UUID format. |
|
|
Yes |
Incident type. |
|
String |
Yes |
Incident name. |
|
String |
Yes |
Name of the incident workflow. |
|
String |
Yes |
Unique identifier of the incident workflow, in the UUID format. |
|
String |
No |
Incident description. |
|
String |
Yes |
Date and time of the incident creation, in the RFC 3339 format. |
|
String |
Yes |
Date and time of the last incident change, in the RFC 3339 format. |
|
String |
No |
Date and time of the incident status change, in the RFC 3339 format. |
|
String |
No |
Severity of the incident. Possible values:
|
|
String |
Yes |
Priority of the incident. Possible values:
|
|
|
No |
Operator to whom the incident is assigned. |
|
String |
No |
Date and time of the first telemetry event of the alert related to the incident, in the RFC 3339 format. |
|
String |
No |
Date and time of the last telemetry event of the alert related to the incident, in the RFC 3339 format. |
|
String |
Yes |
Incident status. Possible values:
|
|
String |
Yes |
Incident status ID, in the UUID format. |
|
String |
No |
Resolution of the incident status. Possible values:
|
|
Array of strings |
No |
Components that detect and generate the incident. |
|
Array of strings |
No |
Triggered detection technology. |
|
No |
Alerts included in the incident. |
|
|
Object |
No |
Additional information about the alert, in the JSON format. This information can be filled in by a user or a playbook. |
|
String |
Yes |
Link to an entity in an external system (for example, a link to a Jira ticket). |
|
String |
Yes |
Method of creating an incident. |
|
Array of |
No |
Attachments related to the incident. |
IncidentType
Field |
Value type |
Is required |
Description |
|
String |
Yes |
Incident type ID, in the UUID format. |
|
String |
Yes |
Name of the incident type. |
|
String |
Yes |
Description of the incident type. |
Assignee
Field |
Value type |
Is required |
Description |
|
String |
Yes |
User account ID of the operator to whom the incident is assigned. |
|
String |
Yes |
Name of the operator to whom the incident is assigned. |
UnkeyedAttachment
Field |
Value type |
Is required |
Description |
|
String |
Yes |
Attachment ID, in the UUID format. |
|
String |
Yes |
Attachment name. |
|
String |
Yes |
Date and time of the attachment creation, in the UTC format. |
|
String |
Yes |
Date and time of the last attachment change, in the UTC format. |
|
String |
Yes |
Indicator that the affected asset (a device or an account) is a victim. |
|
Integer |
Yes |
Attachment size, specified in bytes. |
|
String |
Yes |
Attachment status that indicates whether the attachment upload is in progress, completed, or aborted with an error. Possible values:
|
|
String |
No |
Attachment description. |
|
String |
No |
Text of the status that is displayed to a user (for example, an error message that is displayed when the attachment upload fails). |
Creating incidents
You can create incidents manually or enable the rules for automatic creation of incidents. This topic describes how to create incidents manually.
To be able to create incidents, you must have the access right to read and modify alerts and incidents.
If the incident is created manually, playbooks will not launch automatically. You can launch a playbook for such an incident manually.
You can create incidents by using the incident table or the alert table.
Creating incidents by using the incident table
To create an incident:
- In the main menu, go to Monitoring & reporting → Incidents. Click the Create incident button.
- On the General settings step, specify the following settings:
- Incident name
- Tenant
- Assignee
- Priority
- Description
- Click OK.
The incident is created.
Creating incidents by using the alert table
You create an incident by selecting the alerts to link to the new incident. Refer to linking alerts to incidents.
Viewing the incident table
The incident table provides an overview of all created incidents.
To view the incident table:
- In the main menu, go to Monitoring & reporting → Incidents.
- If necessary, apply the tenant filter. By default, the tenant filter is disabled and the incident table displays the incidents related to all of the tenants to which you have access rights. To apply the tenant filter:
- Click the link next to the Tenant filter setting.
The tenant filter opens.
- Select the check boxes next to the required tenants.
The incident table displays only the incidents that were detected on the assets that belong to the selected tenants.
- Click the link next to the Tenant filter setting.
The incident table is displayed.
The incident table has the following columns:
- Created. Date and time when the incident was created.
- Threat duration. Time between the earliest and the most recent events among all of the alerts linked to the incident. By default, this column is hidden.
- Updated. Date and time of the last change, from the incident history. By default, this column is hidden.
- Incident ID. A unique identifier of an incident.
- Status. Current status of the incident.
- Status changed. The date and time when the incident status has been changed.
- Severity. Severity of the incident.
- Priority. Priority of the incident.
- Number of linked alerts. How many alerts are included in the incident. By default, this column is hidden.
- Name. A name of an incident.
- Rules. The rules that were triggered to create the incident.
- Affected assets. Devices and users that were affected by the incident. If the number of assets affected by or involved in the incident is greater than or equal to three, the number of affected devices is displayed. By default, this column is hidden.
- Tenant. The name of the tenant in which the incident was detected.
- Analyst. Current assignee of the incident.
- Technology. The technology that detected the incident. By default, this column is hidden.
- Creation method. How the incident was created—manually or automatically. By default, this column is hidden.
- Observables. Number of the detection artifacts, for example, IP addresses or MD5 hashes of files. If the number of observables is greater than or equal to three, the number of observables is displayed. By default, this column is hidden.
If necessary, you can export information about all incidents displayed in the incident table to a JSON file.
Exporting information about incidents
You can export information about all incidents displayed in the incident table to a JSON file. This may be required when you have to provide this information to third parties.
To export information about incidents, you must have one of the following XDR roles: Main administrator, Tenant administrator, Junior analyst, Tier 1 analyst, Tier 2 analyst, SOC manager, Interaction with NCIRCC, Approver, or Observer.
To export information about incidents:
- In the main menu, go to Monitoring & reporting → Incidents.
The incident table is displayed.
- If necessary, group and filter the data in the table as follows:
- Click the filter icon (
 ), and then specify and apply the filter criterion in the invoked menu.
 - Click the settings icon (), and then select the columns to be displayed in the table.
The filtered incident table is displayed.
- Click the filter icon (
- Click the Export button.
- In the window that opens, select the folder to save the JSON file, and then click the Save button.
If the operation is completed successfully, an appropriate message is displayed on the screen. Otherwise, an error message is displayed.
Page top
Viewing incident details
Incident details are a page in the interface that contains all of the information related to the incident, including the incident properties.
To view incident details:
- In the main menu, go to Monitoring & reporting → Incidents.
- In the incident table, click the ID of the required incident.
The window with incident details is displayed.
If necessary, you can refresh the information in the incident details by clicking the refresh () icon next to the incident name.
The toolbar in the upper part of the incident details allows you to perform the following actions:
- Edit the Name, Description and External reference field values
- View the incident on the investigation graph
- Change the incident status
- Change the incident priority
- Assign the incident to an analyst
- Select a playbook
- Link alerts to the incident
- Merge the incident with other incidents
Incident details contain the following sections:
- Summary
- Details
- Similar incidents
In the Similar incidents section, you can view the list of incidents that have the same affected artifacts as the current incident. The affected artifacts include both observables and affected devices of the alerts linked to an incident. The list contains incidents in any status.
By using the list, you can evaluate the degree of similarity of the current incident and other incidents. The similarity is calculated as follows:
Similarity = M / T * 100
Here, M is a number of artifacts that matched in the current and a similar incident, and T is total number of artifacts in the current incident.
If the similarity is 100%, the current incident has nothing new in comparison with the similar incident. If the similarity is 0%, the current and the similar incident are completely different. Incidents that have similarity of 0% are not included in the list.
The calculated value is rounded off to the nearest whole number. If similarity is equal to a value between 0% and 1%, the application does not round such value down to 0%. In this case, the value is displayed as less than 1%.
Clicking an incident ID opens the incident details.
Customizing the similar incidents list
You can customize the table by using the following options:
- Filter the incidents by selecting the term for which the incidents have been updated. By default, the list contains the incidents that have been updated for the last 30 days.
- Click the Columns settings icon (), and then select which columns to display and in which order.
- Click the Filter icon (), and then select and configure the filters that you want to apply. If you select several filters, they are applied simultaneously by logical AND operator.
- Click a column header, and then select the sorting options. You can sort the incidents in ascending or descending order.
- Alerts
- Assets
- Files
- Observables
- History
- Comments
Assigning incidents to analysts
As a work item, an incident must be assigned to an SOC analyst for inspection and possible investigation. You can change the assignee at any time.
Incidents can be assigned only to analysts who have the access right to read and modify alerts and incidents.
To assign one or several incidents to an analyst:
- In the main menu, go to Monitoring & reporting → Incidents.
- Select the check boxes next to the incidents that you want to assign to an analyst.
You must select only the incidents detected in the same tenant. Otherwise, the Assign to button will be disabled.
Alternatively, you can assign an incident to an analyst from the incident details. To open the incident details, click the link with the incident ID.
- Click the Assign to button.
- In the Assign to analyst window that opens, start typing the analyst's name or email address, and then select the analyst from the list.
You can also select the Not assigned option.
- Click the Assign button.
The incidents are assigned to the analyst.
You also can assign an incident to an analyst by using playbooks.
Changing an incident status
As a work item, an incident has a status that shows the current state of the incident in its life cycle.
You can change the status of your own incidents or the incidents of other analysts only if you have the access right to read and modify alerts and incidents.
If the incident status is changed manually, playbooks will not launch automatically. You can launch a playbook for such an incident manually.
An incident can have one of the following statuses:
To change status of one or several incidents:
- In the main menu, go to MONITORING & REPORTING → Incidents.
- Do one of the following:
- Select the check boxes next to the incidents whose status you want to change.
- Click the link with the ID of the incident whose status you want to change.
The Incident details window opens.
- Click the Change status button.
- In the Change status pane, select the status to set.
When you select the Closed status, you must select a resolution.
If you have selected the Allow users with certain permissions only to close this incident check box when editing the Closed status in the incident workflow, you must have either Main Administrator or Approver XDR role to close the incident.
If you change the incident status to Closed and this incident contains uncompleted playbooks or response actions, all related playbooks and response actions will be terminated.
- Click the Save button.
The status of the selected incidents is changed.
You also can change an incident status by using playbooks.
Changing an incident priority
As a work item, an incident has a priority that defines the order in which the incident must be investigated by analysts. You can change the incident priority manually.
You can change incident priorities of your own incidents or incidents of other analysts only if you have the access right to read and modify alerts and incidents.
An incident can have one of the following priorities:
- Low
- Medium (default value)
- High
- Critical
Incidents with the Critical priority are the most urgent ones and must be investigated first. The Low priority usually means that the incident is placed in the backlog. You can define your own criteria as to which priority should be set to which incident.
To change an incident priority:
- In the main menu, go to Monitoring & reporting → Incidents.
- Do one of the following:
- Select the check boxes next to the incidents whose priority you want to change.
- Click the incident ID to open the details of the incident whose priority you want to change.
- Click the Change priority button.
- In the Change priority window, select the priority to set.
- Click the Save button.
The priority of the selected incidents is changed.
You also can change an incident priority by using playbooks.
Merging incidents
Two or more incidents may be interpreted as indicators of the same issue in an organization's IT infrastructure. If this is the case, you can merge the incidents to investigate them as a single issue.
When you merge incidents, you need to select a target incident among them. After the incident consolidation, the issue is to be investigated within the target incident. The target incident must have a status other than Closed. Other incidents are merged into the target one and, after consolidation, gain the Closed status and the Merged resolution.
All of the alerts linked to the merged incidents are automatically linked to the target incident. Because an incident can have no more than 200 linked alerts, the application counts the alerts linked to the incidents that you want to merge. If the total number of linked alerts exceeds 200, the selected incidents cannot be merged.
You cannot merge child incidents or incidents that have child incidents.
To merge incidents from the incident table:
- In the main menu, go to Monitoring & reporting → Incidents.
- Select the check boxes next to the incidents that you want to merge into a target incident. You will select the target incident on the first step of the Wizard.
- Click the Merge incidents button.
The Merge incidents Wizard opens.
- Select the target incident.
- Click the OK button.
The incidents are merged.
To merge incidents by using incident details:
- In the main menu, go to Monitoring & reporting → Incidents.
- Click an incident ID to open the incident details. This incident will be merged into a target incident. You will select the target incident on the first step of the Wizard.
- Click the Merge incident button.
The Merge incidents Wizard opens.
- Select the target incident.
- Click the OK button.
The incidents are merged.
Editing incidents by using playbooks
Kaspersky Next XDR Expert allows you to edit incidents manually or by using playbooks. When creating a playbook, you can configure the playbook algorithm to edit the incident properties.
To edit an incident by using a playbook, you must have one of the following roles: Main administrator, SOC administrator, Tier 1 analyst, Tier 2 analyst, or Tenant administrator.
You cannot edit incidents that have the Closed status.
You can edit the following incident properties by using the playbook:
- Assignee
- Incident workflow status
- Incident type
- Comment
- Description
- Priority
- ExternalReference attribute
- Additional data attribute
Examples of the expressions that you can use in the playbook algorithm to edit the incident properties:
- Assigning an incident to a user
- Unassigning an incident from a user
- Changing a status of the incident workflow
- Changing the incident type
- Adding a comment to an incident
- Editing the incident description
- Changing the incident priority
- Editing the ExternalReference attribute
- Editing the Additional data attribute
Investigation graph
The investigation graph is a visual analysis tool that shows relationships between the following objects:
- Events
- Alerts
- Incidents
- Observables
- Assets (devices)
- Segmentation rules
The graph displays the details for an incident: the corresponding alerts and their common properties.
To open the investigation graph:
- In the main menu, go to Monitoring & reporting → Incidents.
- In the incident table, click the ID of the required incident.
The window with incident details is displayed.
- Click the View on graph button.
The Write permission in the Alerts and incidents functional area is required to view the graph. Refer to the following topic for details: Predefined user roles.
You can use the pan and zoom panel on the bottom right to navigate a complex graph.
Interacting with graph nodes
You can use the toolbar at the top to add alerts and observables.
You can click and drag graph nodes to rearrange them.
You can click a graph node to bring the context menu.
Common context menu items:
- View details
Opens a details window for the selected node.
- Copy
Copies the node value to clipboard.
- Hide
Removes the selected node from the graph.
Event-specific context menu items:
Process tree
Only available for specific event types. Generates a process tree for the event. The blue color indication for an event indicates that you can generate a process tree for this event.
Alert-specific context menu items:
- Change status
Invokes a Change status panel that allows you to change the alert status.
- Observables
A sub-menu that allows you to add common observables as graph nodes.
- Devices
A sub-menu that allows you to add common devices as graph nodes.
Observable-specific context menu items:
- Find similar events
Invokes a Threat Hunting panel that shows similar events.
- Find similar alerts
Invokes an Alerts panel that shows similar alerts.
- Request status from Kaspersky TIP
Allows you to obtain detailed information about the selected observable from Kaspersky Threat Intelligence Portal (Kaspersky TIP). Refer to the following topic for details: Integration with Kaspersky Threat Intelligence Portal.
- Enrich data from Kaspersky TIP
Use this button to obtain detailed information about the selected observable from Kaspersky TIP. Refer to the following topic for details: Integration with Kaspersky Threat Intelligence Portal.
Segmentation rule-specific context menu items:
- View details in KUMA
Opens the KUMA Console in a new browser tab that displays the rule details.
- Find similar alerts
Invokes an Alerts panel that shows similar alerts.
If you attempt to add an alert for a different tenant, the alert will not be shown on the investigation graph.
You can also add observables by clicking an alert or event. To do this, in the context menu that opens, you need to select Observables, and then click the observable. The observable will be added to the investigation graph. You can remove an observable from the investigation graph, if needed. To do this, you have to click the observable, and then click Hide in the context menu that opens.
Grouping graph elements
The investigation graph automatically groups alerts with common properties.
To ungroup an alert:
- Click a graph element corresponding to an alert group.
A table shows up that lists the alerts.
- Select an alert that you want to show on the graph.
- Click the Show on graph button in the table toolbar.
The alert is added as a graph node.
- Click the Hide on graph button, if you want to hide an alert.
Linking graph elements
The investigation graph automatically creates links for new items when applicable. Links can be added manually.
To manually add a link:
- Click the Link nodes button.
Link points appear around graph nodes.
- Click and drag from a link point of one node to a link point of another node.
Manually created links have a color indication.
Threat hunting
You can analyze events to search threats and vulnerabilities that have not been detected automatically. To do this, you need to click the Threat Hunting button in the toolbar at the top or invoke a graph node's context menu and click Events or Find similar events. The Threat Hunting panel opens. Refer to the following section for details: Threat Hunting.
Exporting the graph
You can save the graph in the SVG format. To do this, you need to click the Export button in the toolbar at the top.
Page top
Segmentation rules
Segmentation rules allow you to automatically split related alerts into different incidents based on the conditions that you specify when creating the rules.
Use segmentation rules to create different incidents based on related alerts. For example, you can combine several alerts with an important distinguishing feature into a separate incident.
Alerts can only be linked to an incident that belongs to the same tenant.
We recommend that you use segmentation rules together with aggregation rules to define more precise rules for creating incidents.
When you write a jq expression while creating a segmentation rule, an error about invalid expression may appear though the expression is valid. This error does not block the creation of the segmentation rule. This is a known issue.
To create a segmentation rule:
- In the main menu, go to Settings → Tenants.
- Click the tenant for which you want to create a segmentation rule.
- In the Settings tab, select Segmentation rules.
- Click Create.
A Segmentation rule window appears.
- Specify the segmentation rule settings:
- Status
Enable or disable the rule.
- Rule name
A unique name for the rule. Must contain 1 to 255 Unicode characters.
- Max alerts in incident
Maximum number of alerts in a single incident. If the number of alerts exceeds the specified value, another incident is created.
- Min alerts in incident
Minimum number of alerts in a single incident. If the number of alerts does not reach the specified value, an incident is not created.
- Incident name (template)
A jq expression that defines the template for naming the incidents created according to this segmentation rule.
Example:
"Malware Detected with MD5 \(.Observables[] | select(.Type == "md5") | .Value)" - Search interval
A time interval from which to select alerts and incidents.
- Description
Optional. Rule description.
- Trigger
A jq expression that defines the condition for including alerts in the incident.
Example:
any(.Rules[]?; .Name == "R077_02_KSC. Malware detected") - Groups
A jq expression that defines the array of string identifiers by which to assign alerts to incidents.
Example:
[.Observables[] | select(.Type == "md5") | .Value ]
- Status
- Click Save.
The segmentation rule is saved and displayed in the table of segmentation rules. If necessary, you can edit the rule setting by clicking its name in the table.
The rules are prioritized in the table in descending order.
When an alert is created, it is checked by all active segmentation rules in accordance with their priority. After the first rule is triggered, an array of string identifiers is formed for the alert, and the search starts for the incident to which the alert will be linked.
A rule is triggered if the jq expression that you have specified in Trigger returns true.
Alerts cannot be linked to incidents created manually.
An incident also has an array of string identifiers, which include the arrays of the alerts already linked to this incident. If the alert for which the segmentation rule was triggered has at least one element in its array that matches with any of those in the incident's array, the alert is linked to the incident. As a result, the array of this alert is added to the incident's array.
If there are several incidents meeting the condition, the alert is linked to the one with the most recent update. If there are no incidents with matching elements in arrays, a new incident is created.
When an incident is new, its array is empty. A new incident takes the array of string identifiers from an alert after the alert is linked.
Segmentation rule. Example
Configure the aggregation rules from the Aggregation rules. Example section in this topic.
The table below illustrates how to combine all penetration testing alerts in a single incident.
Segmentation rule
Attribute |
Value |
Trigger |
.AggregationID == "Pentest" |
Groups |
["Pentest"] |
Incident Name |
"Pentest incident" |
Aggregation and segmentation rules. Example
The table below illustrates how to combine alerts that have the same rule id in two incidents based on the user name prefix.
Aggregation rule
Attribute |
Value |
Description |
Trigger |
any(.Rules[]?; .ID == "123") |
Searches alerts with the rule id set to "123". |
Aggregation ID |
if any(.OriginalEvents[]?.BaseEvents[]?.DestinationUserName // empty; startswith("adm_")) then "rule123_DestinationUserName_adm" else "rule123_DestinationUserName_not_adm" end |
Searches for user names with the "adm_" prefix. |
Alert Name |
if any(.OriginalEvents[]?.BaseEvents[]?.DestinationUserName // empty; startswith("adm_")) then "Rule123 admin" else "Rule123 not admin" end |
Sets the alert name depending on the user name prefix. |
Segmentation rule
Attribute |
Value |
Trigger |
.AggregationID | startswith("rule123_DestinationUserName") |
Groups |
[.AggregationID] |
Incident Name |
.Name |
Copying segmentation rules to another tenant
You can copy an existing segmentation rule to another tenant.
When a child tenant is created, it automatically copies all segmentation rules from the parent tenant. Editing segmentation rules in the parent tenant does not affect already created child tenants.
To copy segmentation rules:
- In the main menu, go to Settings → Tenants.
- Click the tenant that has the segmentation rule that you want to copy.
- In the Settings tab, select Segmentation rules.
- Select segmentation rules you want to copy and click Copy to tenant.
- Select one or multiple target tenants and click Copy.
If the target tenant contains a segmentation rule with an identical name, an Overwrite or rename segmentation rules? window appears. Click Overwrite to delete the previously created rule for the target tenant and replace it with the rule that you want to copy. Click Copy and rename to preserve the previously created rule and copy the specified rule with
(copy)appended to its title.
Managing incident types
Kaspersky Next XDR Expert allows you to manage incidents and customize the incident handling process by using incident types.
An incident type is a set of attributes, for which you can configure different processes, for example, assign a workflow to the incident type, configure a trigger, or configure a playbook algorithm.
You can create an incident type or use predefined incident types that you can customize.
Incident types can be active or inactive. If the incident type is active, you can select this type in the incident details window.
The incident type marked as a default type is assigned to all new incidents automatically. You cannot switch a default incident type to inactive.
The Common incident type is set as default. You can edit this setting.
You can create only one default incident type in a tenant.
Page top
Viewing the incident types table
To view the incident types table:
- In the main menu, go to Settings → Tenants.
- Click the name of the required tenant.
The tenant's properties window opens.
- On the Settings tab, click Incident management.
The Types tab is displayed with the incident types table.
- If you want to configure the incident types table, do any of the following:
- Click the filter icon (), and then specify and apply the filter criterion in the invoked menu.
- To hide or display a column, click the settings icon (), and then select the necessary column.
- Click the filter icon (
The incident types table contains the following information:
- Name. Name of the custom or predefined incident type.
The table contains the following predefined incident types:
- Common
By default, this type has the Yes value in the Default column.
- Information gathering
- Compromise
- Unauthorized access
- Malware attack
- Phishing
- Availability
- Insider threat
- Data breaches
- Configuration error
- Supply chain attack
- Web application attack
- Vulnerability exploitation
- Common
- Active type. If the incident type is active, you will be able to select this type in the incident details window.
- Default. When you create an incident, the default type is automatically assigned to it. Possible values:
- True
- False
- Workflow. Incident workflow.
- Tenant. Name of the tenant to which the incident type belongs.
- Creation type. Way the incident type was created. Possible values:
- Custom
- Predefined
- ID. Unique identifier of the custom or predefined incident type. By default, this column is hidden.
- Description. Incident type description. By default, this column is hidden.
If necessary, you can create new incident types, as well as edit and delete predefined and custom incident types.
Page top
Creating incident types
To create an incident type:
- In the main menu, go to Settings → Tenants.
- Click the name of the required tenant.
The tenant's properties window opens.
- On the Settings tab, click Incident management, and then select the Types tab.
- Click the Create button.
The Create incident type window opens.
- If you want the new incident type to be active, switch on the Active type toggle button.
- In the Name field, enter the name of the new incident type.
- If you want all new incidents to be assigned this type by default, select the Set as default check box.
There can be only one default incident in a tenant. It means that if the tenant already has a default incident type, this type will no longer be default after you select this check box.
- In the Workflow field, select the incident workflow.
- If necessary, in the Description field, enter an incident type description or a comment.
- Click the Create button.
The new incident type is displayed in the incident types table.
Page top
Editing incident types
If necessary, you can edit incident types.
To edit an incident type:
- In the main menu, go to Settings → Tenants.
- Click the name of the required tenant.
The tenant's properties window opens.
- On the Settings tab, click Incident management.
The Types tab is displayed with the incident types table.
- Click the name of the incident type that you want to edit.
The Edit incident type window opens.
- Make your edits, and then click Save. For more details on the incident types properties that you can edit, refer to Creating incident types.
The incident type properties are edited and saved.
Page top
Deleting incident types
If you want to delete an incident type that is used in a playbook, you have to delete this incident type from the playbook trigger and/or algorithm to avoid errors.
You cannot delete an incident type in the following cases:
- An incident type is set as default in the tenant where this incident type was created.
When trying to delete this incident type, you are prompted to set a new default incident type. In the window that opens, you have to select the incident type from the list.
- An incident type is set as default in a child tenant.
- The current tenant or a child tenant contains an incident with the type that you want to delete.
Before deleting such a type, you have to assign another type to the incident.
To delete the incident type:
- In the main menu, go to Settings → Tenants.
- Click the name of the required tenant.
The tenant's properties window opens.
- On Settings, click Incident management.
The Types tab is displayed with the incident types table.
- Do one of the following:
- Select the incident type that you want to delete, and then click Delete.
- Click the name of the incident type that you want to delete, and then in the Edit incident type window, click Delete.
- In the confirmation dialog box, click Delete.
The incident type is deleted.
Page top
Managing incident workflows
Kaspersky Next XDR Expert allows you to configure a flexible incident workflow. Kaspersky Next XDR Expert also visualizes the workflow in the visual editor.
The incident workflow is a set of statuses and transitions that an incident goes through during its lifecycle. Status is a step in the incident handling process. Transition helps the incident to move between different statuses. A transition is a link that allows you to configure transitions from one incident status to another and back. If necessary, you can use a transition as a one-way link.
You can create an incident workflow or use a predefined workflow that you can customize.
You also can assign a workflow to the incident types. This will help you manage the incident lifecycle in the most convenient way.
Page top
Viewing incident workflows table
To view the incident workflows table:
- In the main menu, go to Settings → Tenants.
- Click the name of the required tenant.
The tenant's properties window opens.
- On the Settings tab, click Incident management, and then select the Workflows tab.
The incident workflows table is displayed.
To configure the incident workflows table, do any of the following:
- Click the filter icon () button, and then specify and apply the filter criterion in the invoked menu.
- To hide or display a column, click the settings icon (), and then select the necessary column.
The incident workflows table is configured and displays the data you need.
The incident workflows table contains the following information:
- Name. Name of the custom or predefined incident workflow.
- Linked types. Number of linked incident types.
- Tenant name. Name of the tenant to which the incident workflow belongs.
- Creation type. Way the incident workflow was created. Possible values:
- Custom.
- Predefined.
- Workflow ID. Unique identifier of the incident workflow. By default, this column is hidden.
- Description. Incident workflow description.By default, this column is hidden.
Predefined incident workflows
Kaspersky Next XDR Expert allows you to manage incidents by using the predefined incident workflow. In the incident workflows table, such workflow is named Standard. In the Creation type column, these workflows are marked as Predefined.
If necessary, you can edit the predefined workflow to customize it.
The table below shows the statuses of the predefined workflow, and the reasons why incidents switch to these statuses.
Status |
Reasons |
Initial |
|
In progress |
The user manually changed the incident status from Initial or On hold to In progress. |
On hold |
The user manually changed the incident status from In progress to On hold. |
Done |
|
Creating incident workflows
The incident workflow allows you to manage incident lifecycle.
To create an incident workflow:
- In the main menu, go to Settings → Tenants.
- Click the name of the required tenant.
The tenant's properties window opens.
- On the Settings tab, click Incident management, and then select the Workflows tab.
- Click the Create button.
The Create workflow window opens.
By default, each incident workflow contains predefined statuses Initial and Done. You cannot delete or edit these statuses.
- In the Name field, enter the name of the new workflow.
- If necessary, in the Description field, enter a workflow description or a comment.
- To add new statuses, in the Workflow section, click Add status.
- In the window that opens, specify the following settings:
- In the Status name field, enter the name of the new status.
- In the Category field, select one of the following status categories:
- Initial
- In progress
- Resolved
- Done
The category determines the color of the status icon.
- In the Incoming transition field, select one or several incoming statuses.
If you want to configure a transition from all statuses to the incoming statuses, select the Allow all statuses to transition to this one option.
- In the Outgoing transition field, select one or several outgoing statuses.
If you want to configure a transition from the outgoing statuses to all statuses, select the Allow this status to transition to all statuses option.
- Click Add.
The visualized workflow is displayed in the Create workflow window.
If necessary, repeat steps 7-8e to add new statuses.
- In the Create workflow window, click Save.
The new incident workflow is displayed in the table.
Page top
Editing incident workflows and statuses
You can edit workflow properties, as well as workflow' statuses and transitions.
To edit the incident workflow:
- In the main menu, go to Settings → Tenants.
- Click the name of the required tenant.
The tenant's properties window opens.
- On the Settings tab, click Incident management, and then select the Workflows tab.
- Click the name of the workflow that you want to edit.
The Edit workflow window opens.
- Edit the workflow properties. For more details on the workflow properties that you can edit, see Creating incident workflows.
The workflow's properties are modified and saved.
To edit statuses of the incident workflow:
- In the main menu, go to Settings → Tenants.
- Click the name of the required tenant.
The tenant's properties window opens.
- On the Settings tab, click Incident management, and then select the Workflows tab.
- Click the name of the workflow that you want to edit.
The Edit workflow window opens.
- Click the name of the status that you want to edit.
The Edit status window opens.
- Edit the status and transition settings. For more details on the status settings that you can edit, see Creating incident workflows.
If necessary, you can delete the status by clicking the Delete button.
You cannot edit the name and the category of the following predefined statuses: Initial and Done statuses. You also cannot delete these predefined statuses.
You cannot delete a status if it is assigned to an incident.
- Click the Save button.
The workflow statuses are modified and saved.
Page top
Deleting incident workflows
You cannot delete the incident workflow if there are linked incident types that belong to the parent or child tenant. In this case, you need to assign a different workflow to the linked incident types, and then try to delete incident workflow again.
If you want to delete a workflow that is used in a playbook, before deleting, edit the playbook's trigger and/or algorithm to avoid errors.
To delete an incident workflow:
- In the main menu, go to Settings → Tenants.
- Click the name of the required tenant.
The tenant's properties window opens.
- On the Settings tab, click Incident management, and then select the Workflows tab.
- In the list of workflows, select the workflow that you want to delete, and then click Delete.
- In the confirmation dialog box, click Delete.
The incident workflow is deleted.
Page top
Configuring the retention period of alerts and incidents
Kaspersky Next XDR Expert allows you to reduce or increase the retention periods of alerts and incidents, depending on your needs. By default, the retention period of alerts and incidents is 360 days.
The child tenant copies the retention period of alerts and incidents from the parent tenant. If necessary, you can edit the retention period for the child tenant.
To configure the alert or incident retention period:
- In the main menu, go to Settings → Tenants.
- Click the name of the required tenant.
The tenant's properties window opens.
- On the Settings tab, click Retention period.
- Specify the new retention period in one or both of the following fields:
- Alert retention period (days)
- Incident retention period (days)
The minimum value is
1. - Click Save.
The new retention period is configured.
Regardless of the configured retention period, if the expired alert is linked to an unexpired incident, the alert will be deleted only after the retention period of the linked incident expires. If the expired incident has unexpired linked alerts, the incident will be deleted only after the retention period of the linked alerts expires.
Page top
Viewing asset details
Asset details are a window that contains all information related to the asset.
You can view asset details in one of the following ways:
- From alert details
- From incident details
- From event details (if the event contains assets)
To view asset details:
- In the main menu, go to Monitoring & reporting, and then do one of the following:
- If you want to view asset details from alert details, click Alerts, and then in the ID column, click the ID of the alert that includes the asset whose details you want to view. In the window that opens, go to the Assets tab.
- If you want to view asset details from incident details, click Incidents, and then in theID column, click the ID of the incident that includes the asset whose details you want to view. In the window that opens, go to the Assets tab.
- If you want to view asset details from event details, click Threat hunting, and then click the event that contains the asset whose details you want to view.
- Click the name of the required asset, and then in the drop-down list, select View properties.
The asset details window is displayed.
The asset details window contains the following sections:
- Asset properties—Information about the asset, for example, asset name, ID, and tenant to which the asset belongs.
If the current license in KUMA includes the AI module, the AI score field is displayed and shows the asset score. This field shows the degree of atypical activity on the asset and may take the values in the range from 0 to1, where 0 is expected behavior, and 1 is completely unexpected behavior for the asset within the infrastructure.
- Categories—Information about the categories associated with the asset.
- Custom fields—Asset fields that you created in KUMA Console.
- Installed software—Information about software installed on the asset.
- KSC: vulnerabilities—Vulnerabilities of the asset, if provided. This information is available for assets imported from Kaspersky Security Center.
- Kaspersky applications—Information about the Kaspersky applications installed on the asset.
- Device protection status—Status of the asset; the following values are possible: OK, Critical, Warning. This information is available for assets imported from Kaspersky Security Center.
- KICS for Networks: asset properties—Information about the asset. This information is imported from KICS for Networks.
- KICS for Networks: vulnerabilities—Vulnerabilities of the asset, if provided. This information is available for assets imported from KICS for Networks.
You can expand the sections by clicking the chevron icons (![]() ) next to their names.
) next to their names.
Threat hunting
The Threat hunting page contains tools that help you analyze events to search threats and vulnerabilities that have not been detected automatically. To create an alert from a set of events, select the events, and then click the Create alert button.
You can open the Threat hunting page in any of the following ways:
- In the main menu, go to Monitoring & reporting → Threat hunting.
- In the Alert or Incident details, invoke the context menu for an attribute, and then select Search in Threat Hunting.
- In the Incident details, click the View on graph button. In the investigation graph that opens, click the Threat hunting button.
The Threat hunting page displays events. You can filter out events:
- By editing the SQL query
- By changing the time range
- By selecting the tenants to which the events belong
Working with events
The Threat hunting section contains tools that help you search threats and vulnerabilities by analyzing the events.
Granular access to events
In KUMA, users with different rights can have granular access to events. Access to events is controlled at the level of storage spaces.
You can assign spaces to users in the Spaces permissions section. After upgrading to the latest version, the 'All spaces' space set is assigned to all existing users, that is, access to all spaces is unrestricted. An event contains a tenant ID and a space ID, therefore the user needs rights to the corresponding tenant and space to have access to the event.
Keep in mind the following special considerations involved in displaying storages:
- If a storage is not listed in the Active services section, the storage and its spaces are not displayed in the list of spaces of the set.
- If the storage service was stopped using the
systemctl stop kuma-<storage ID>command, the storage and its spaces are not displayed in the list of spaces of the set. - If the storage was started and then deleted using the
uninstallcommand, the storage and its spaces remain in the list of spaces of the set.
In the list of events, you can add the SpaceID field to the table, which will display the name of the space. The space of audit events is displayed as KUMA Audit. KUMA Default is the space inside each storage, where all events go if the storage does not have configured spaces or if the event does not match the conditions of the existing spaces.
When you export the list of events to a TSV file, the space ID and name are displayed for spaces.
To differentiate access:
- Configure the space sets.
You can create, edit, or delete space sets. These actions result in audit events.
- Configure the access rights of the space set: you can grant or revoke access rights of selected users.
Use cases
Migrating to the latest KUMA version with differentiated access to events
Restricting access to spaces for all users
Allowing some users to view all events
Permitting some users to view events from a finite set of spaces
Supplementing an explicitly specified space set for a user
Page top
Viewing the events table
The events table provides you with an overview of all events received by KUMA Core from the data sources. The table displays the list of events filtered according to the executed SQL query.
To view the events table:
- In the main menu, go to Monitoring & reporting → Threat hunting.
- If necessary, apply the tenant filter. By default, the tenant filter is disabled and the events table displays the events related to all of the tenants to which you have the Read access right. To apply the tenant filter:
- Click the link next to the Tenant filter setting.
The tenant filter opens.
- Select the check boxes next to the required tenants.
The events table displays only the events related to the selected tenants.
- Click the link next to the Tenant filter setting.
The events table is displayed. For details about the table columns, relate to the normalized event data model.
Searching and filtering events
To search and filter events, modify an SQL query in the search field, and then click the Run Query button. You can enter the SQL query manually or generate it by using the query builder.
Data aggregation and grouping is supported in SQL queries.
You can add filter conditions to an already generated SQL query in the window for viewing statistics, the events table, and the event details area.
To change the filtering settings in the Statistics window
- Follow the steps to open the events table.
- Open Statistics details area by using one of the following methods:
- Click the
 button in the top right corner of the events table, and then select Statistics.
 - In the events table, click any value, and then select Statistics in the context menu that opens.
The Statistics details area appears in the right part of the web interface window.
- Click the
- Open the drop-down list of the relevant parameter and hover your mouse cursor over the necessary value.
- Change the filter settings by doing one of the following:
- To include only events with the selected value, click the
 button.
 - To exclude all events with the selected value, click the
 button.
- To include only events with the selected value, click the
To change the filtering settings in the events table
- Follow the steps to open the events table.
- Click an event parameter value in the events table.
- In the opened menu, select one of the following options:
- To show only events with the selected value, select Filter by this value.
- To exclude all events with the selected value from the table, select Exclude from filter.
To change the filter settings in the event details area
- Follow the steps to open the events table.
- Click a relevant event to invoke the event details panel.
- Change the filter settings by doing one of the following:
- To include only events with the selected value, click the button.
- To exclude all events with the selected value, click the button.
- To include only events with the selected value, click the
As a result, the filter settings and the events table are updated, and the new search query is displayed in the upper part of the screen.
When you switch to the query builder, the parameters of a query entered manually in the search field are not transferred to the builder, so you will need to create your query again. The query created in the builder does not overwrite the query that was entered into the search string until you click the Apply button in the builder window.
Click the  button to save the current filter.
Manually creating SQL queries
You can use the search string to manually create SQL queries of any complexity to filter events.
Executing an SQL query affects the displayed table columns.
If the SQL query contains the * value, columns specified in the query are added to the table if they were absent. Removing a displayed column from the subsequent queries does not hide the corresponding column.
If the SQL query does not contain the * value, the table only displays columns for the specified fields that conform the normalized event data model. Columns are displayed even if there is no data for them.
To manually generate an SQL query:
- Follow the steps to open the events table.
- Enter your SQL query into the input field.
- Click the Apply query button.
The table displays events that satisfy the criteria of your query. If necessary, you can filter events by period.
To display non-printable characters in the SQL query field, press either of the following key combinations:
- Ctrl+*/Command+*
- Ctrl+Shift+8/Command+Shift+8
If you enable the display of non-printable characters in the XDR component, other components (such as KUMA) do not automatically display non-printable characters until you reload the components' browser tabs.
Supported functions and operators
SELECT
Event fields that should be returned.
For SELECT fields, the program supports the following functions and operators:
Aggregation functions: count, avg, max, min, sum.
Arithmetic operators: +, -, *, /, <, >, =, !=, >=, <=.
You can combine these functions and operators.
If you are using aggregation functions in a query, you cannot customize the events table display, sort events in ascending or descending order, or receive statistics.
FROM
Data source.
WHERE
Conditions for filtering events.
- AND, OR, NOT, =, !=, >, >=, <, <=
- IN
- BETWEEN
- LIKE
- ILIKE
- inSubnet
- match (the re2 syntax of regular expressions is used in queries; special characters must be shielded with "\")
GROUP BY
Event fields or aliases to be used for grouping the returned data.
If you are using data grouping in a query, you cannot customize the events table display, sort events in ascending or descending order, receive statistics, or perform a retrospective scan.
ORDER BY
Columns used as the basis for sorting the returned data.
Possible values:
- DESC — descending order.
- ASC — ascending order.
OFFSET
Skip the indicated number of lines before printing the query results output.
LIMIT
Number of strings displayed in the table.
The default value is 250.
When switching to the query builder, the query parameters that were manually entered into the search string are not transferred to the builder, so you will need to create your query again. Also, the query created in the builder does not overwrite the query that was entered into the search string until you click the Apply button in the builder window.
Aliases must not contain spaces.
Example queries
- SELECT * FROM `events` WHERE Type IN ('Base', 'Audit') ORDER BY Timestamp DESC LIMIT 250
In the events table, all events with the Base and Audit type are sorted by the Timestamp column in descending order. The number of strings that can be displayed in the table is 250.
- SELECT * FROM `events` WHERE BytesIn BETWEEN 1000 AND 2000 ORDER BY Timestamp ASC LIMIT 250
All events of the events table for which the BytesIn field contains a value of received traffic in the range from 1,000 to 2,000 bytes are sorted by the Timestamp column in ascending order. The number of strings that can be displayed in the table is 250.
- SELECT * FROM `events` WHERE Message LIKE '%ssh:%' ORDER BY Timestamp DESC LIMIT 250
In the events table, all events whose Message field contains data corresponding to the defined %ssh:% template in lowercase are sorted by the Timestamp column in descending order. The number of strings that can be displayed in the table is 250.
- SELECT * FROM `events` WHERE inSubnet(DeviceAddress, '00.0.0.0/00') ORDER BY Timestamp DESC LIMIT 250
In the events table, all events for the hosts that are in the 00.0.0.0/00 subnet are sorted by the Timestamp column in descending order. The number of strings that can be displayed in the table is 250.
- SELECT * FROM `events` WHERE match(Message, 'ssh.*') ORDER BY Timestamp DESC LIMIT 250
In the events table, all events whose Message field contains text corresponding to the ssh.* template are sorted by the Timestamp column in descending order. The number of strings that can be displayed in the table is 250.
- SELECT max(BytesOut) / 1024 FROM `events`
Maximum amount of outbound traffic (KB) for the selected time period.
- SELECT count(ID) AS "Count", SourcePort AS "Port" FROM `events` GROUP BY SourcePort ORDER BY Port ASC LIMIT 250
Number of events and port number. Events are grouped by port number and sorted by the Port column in ascending order. The number of strings that can be displayed in the table is 250.
The ID column in the events table is named Count, and the SourcePort column is named Port.
- SELECT * FROM `events` WHERE match(Message, 'ssh:\'connection.*') ORDER BY Timestamp DESC LIMIT 250
If you want to use a special character in a query, you need to escape this character by placing a backslash (\) character in front of it.
In the events table, all events whose Message field contains text corresponding to the ssh: 'connection' template are sorted by the Timestamp column in descending order. The number of strings that can be displayed in the table is 250.
Generating an SQL query using a builder
You can use the query builder to generate an SQL query for filtering events.
Executing an SQL query affects the displayed table columns.
If the SQL query contains the * value, columns specified in the query are added to the table if they were absent. Removing a displayed column from the subsequent queries does not hide the corresponding column.
If the SQL query does not contain the * value, the table only displays columns for the specified fields that conform the normalized event data model. Columns are displayed even if there is no data for them.
To generate an SQL query using the builder:
- Follow the steps to open the events table.
- Click the
 button to open the query builder.
Generate a search query by providing data in the following parameter blocks:
- SELECT
Event fields that should be returned. The * value is selected by default, which means that all available event fields must be returned. To adjust the displayed fields, select the desired fields in the drop-down list. Note that Select * increases the duration of the request execution, but eliminates the need to specify the fields in the request.
When selecting an event field, you can use the field on the right of the drop-down list to specify an alias for the column of displayed data, and you can use the right-most drop-down list to select the operation to perform on the data: count, max, min, avg, sum.
- FROM
Data source. Select the events value.
- WHERE
Conditions for filtering events.
To add conditions and groups, click the Add condition and Add group buttons. The AND operator value is selected by default in a group of conditions. Click the operator value to change it. Available values: AND, OR, NOT.
To change the structure of conditions and condition groups, use the
 icon to drag and drop expressions.
To add filter conditions:
- In the drop-down list on the left, select the event field that you want to use for filtering.
- Select the necessary operator from the middle drop-down list. The available operators depend on the type of value of the selected event field.
- Enter the value of the condition. Depending on the selected type of field, you may have to manually enter the value, select it from the drop-down list, or select it on the calendar.
To delete filter conditions, click the X button. To delete group conditions, click the Delete group button.
- GROUP BY
Event fields or aliases to be used for grouping the returned data.
If you are using data grouping in a query, you cannot customize the events table display, sort events in ascending or descending order, receive statistics, or perform a retrospective scan.
- ORDER BY
Columns used as the basis for sorting the returned data. In the drop-down list on the right, you can select the necessary order: DESC — descending, ASC — ascending.
- LIMIT
Number of strings displayed in the table.
The default value is 250.
If you are filtering events by a user-defined period and the number of strings in the search results exceeds the defined value, you can click the Show next records button to display additional strings in the table. This button is not displayed when filtering events by the standard period.
- SELECT
- Click the Apply button.
The current SQL query will be overwritten. The generated SQL query is displayed in the search field.
To reset the builder settings, click the Default query button.
To close the builder without overwriting the existing query, click the
button. - Click the Apply query button to display the data in the table.
The table will display the search results based on the generated SQL query.
When switching to another section of the web interface, the query generated in the builder is not preserved. If you return to the Events section from another section, the builder will display the default query.
Page top
Viewing event details
To open the event details panel, select an event in the events table in the Threat hunting section or in an alert details page.
The Event details panel appears in the right part of the web interface window and contains a list of the event parameters with values. In this area you can:
- Include the selected field in the search or exclude it from the search by clicking or next to a parameter's value.
- Find similar events and add or delete a prevention rule by clicking the FileHash and DeviceCustomString values.
- When integrated with Kaspersky CyberTrace and Kaspersky Threat Intelligence Portal, you can add to Internal TI of CyberTrace and show info from Threat Lookup by clicking the FileHash and DeviceCustomString values.
- View the settings of the service that registered the event by clicking the Service value.
In the Event details panel, the name of the described object is shown instead of its ID in the values of the following settings. If you change the filter settings from the Event details panel, the object's ID, and not its name, is added to the SQL query:
- TenantID
- SeriviceID
- DeviceAssetID
- SourceAssetID
- DestinationAssetID
- SourceAccountID
- DestinationAccountID
Saving and selecting events filter configuration
You can save the current filter configuration, including the time-based filter, query builder, and the events table settings, for future use. Saved filter configurations are available to you and other users that have corresponding access rights.
To save the current settings of the filter, query, and period
- Follow the steps to open the events table.
- Click the icon next to the search query and select Save current filter.
- In the New filter window that opens, enter the name of the filter configuration in the Name field. The name must contain 128 Unicode characters or less.
- In the Tenant drop-down list, select the tenant for which to save the created filter.
- Click Save.
The filter configuration is now saved.
To select a previously saved filter configuration
- Follow the steps to open the events table.
- Click the icon next to the search query and select the desired filter.
To save the current settings of the filter, query, and the events table settings
- Follow the steps to open the events table.
- Click the gear icon in the panel above the events table.
- Click Save current preset.
- In the New preset window that opens, enter the name of the preset in the Name field. The name must contain 128 Unicode characters or less.
- In the Tenant drop-down list, select the tenant for which to save the created preset.
- Click Save.
The preset configuration is now saved.
To select a previously saved preset
- Follow the steps to open the events table.
- Click the gear icon in the panel above the events table. Select the Presets tab.
- Select the desired preset.
To delete a previously saved filter configuration for all users
- Follow the steps to open the events table.
- Click the icon next to the search query.
- Click the
 icon next to the configuration that you need to delete.
 - Click OK.
Filtering events by time range
You can specify the period to display events from.
To filter events by time range:
- Follow the steps to open the events table.
- Open the second drop-down list in the upper part of the window.
- Specify the time range. You can select predefined ranges relative to the current date and time or specify a custom range by using the Range start and Range end fields or by selecting dates in the calendar.
- Click the Apply button.
Exporting events
You can export information about events to a TSV file. The selection of events that will be exported to a TSV file depends on filter settings. The information is exported from the columns that are displayed in the events table. The columns in the exported file are populated with the available data even if they did not display in the events table in the Threat hunting section due to the special features of the SQL query.
To export information about events:
- Follow the steps to open the events table.
- Click the button in the top right corner of the events table and select Export TSV.
The new export TSV file task is created in the KUMA Task Manager section.
- Log in to the KUMA Console and find the task you created in the Task Manager section.
- Click the task type name and select Upload from the drop-down list.
The TSV file will be downloaded using your browser's settings. By default, the file name is event-export-<date>_<time>.tsv.
The file is saved based on your web browser's settings.
Page top
Retrospective scan
You can use retrospective scan to refine the correlation rule resources or analyze historical data.
You can also choose to create alerts based on a retrospective scan.
To use retrospective scan:
- In the main menu, go to Monitoring & reporting → Threat hunting.
- Click the button in the top right corner of the events table, and then select Retroscan.
The Retroscan panel opens.
- In the Correlator drop-down list, select the Correlator to feed selected events to.
- In the Correlation rules drop-down list, select the Correlation rules that must be used when processing events.
- To execute responses during event processing, turn on the Execute responses toggle switch.
- To generate alerts during event processing, turn on the Create alerts toggle switch.
- Click the Create task button.
The retrospective scan task is created in the KUMA Task Manager section.
Getting events table statistics
You can get statistics for the current events selection displayed in the events table. The selected events depend on the filter settings.
To obtain statistics:
- Follow the steps to open the events table.
- Do one of the following:
- In the upper-right corner of the events table, select Statistics from the drop-down list.
- In the events table, click on any value and select Statistics from the opened context menu.
- In the upper-right corner of the events table, select Statistics from the
The Statistics details area appears with the list of parameters from the current event selection. The numbers near each parameter indicate the number of events with that parameter in the selection. If a parameter is expanded, five most frequently occurring values are displayed. Type a parameter name in Search fields to filter displayed data.
The Statistics window allows you to modify the events filter.
When using SQL queries with data grouping and aggregation for filtering events, statistics are not available.
Page top
Threat response
To perform response actions, view the result of an enrichment that you performed from the playbook, and launch playbooks manually, you have to go to the Alerts or Incidents sections.
The Alerts and Incidents sections are displayed in the main menu if the following conditions are met:
- You have a license key for Kaspersky Next XDR Expert.
- You are connected to the root Administration Server in OSMP Console.
- You have one of the following XDR roles: Main administrator, Tenant administrator, Junior analyst, Tier 1 analyst, Tier 2 analyst, SOC manager, Interaction with NCIRCC, Approver, Observer.
After you perform a response action, you can view the response history.
Response actions
The response actions can be launched in one of the following ways:
- Manually, as described in this section.
- Within a playbook.
In this case, when creating or editing a playbook you can configure the response action to run automatically, or to request the user's manual approval before launching within the playbook. By default, manual approval of response actions is disabled.
Terminating processes
The Terminate process response action allows you to remotely terminate processes on devices. You can run the Terminate process response action for observables or assets.
You can run the Terminate process response action in one of the following ways:
- From alert or incident details
- From a device details
- From an investigation graph
You can also configure the response action to run automatically when creating or editing a playbook.
To run the Terminate process response action, you must have one of the following XDR roles: Main administrator, Junior analyst, Tier 1 analyst, Tier 2 analyst, Tenant administrator.
It might take up to 15 minutes to launch a response action due to the synchronization interval between the managed device and Administration Server.
Running the Terminate process for observables
To run the Terminate process for observables:
- Do one of the following:
- In the main menu, go to Monitoring & reporting → Alerts. In the ID column, click the link with the alert ID you need.
- In the main menu, go to Monitoring & reporting → Incidents. In the ID column, click the link with the incident ID you need.
- In the window that opens, go to the Observables tab.
- In the list of observables, select one or several observables for which you want to terminate the process. The observables may include:
- MD5
- SHA256
- Click the Terminate process button.
- In the Terminate process pane that opens, select assets for which you want to terminate the process.
- Click the Terminate button.
The process is terminated.
Running the Terminate process for assets
To run the Terminate process for assets:
- Do one of the following:
- In the main menu, go to Monitoring & reporting → Alerts. In the ID column, click the link with the alert ID you need.
- In the main menu, go to Monitoring & reporting → Incidents. In the ID column, click the link with the indent ID you need.
- In the window that opens, go to the Assets tab.
- In the list of assets, select one or several devices you need.
- Click the Select response action button, and then click Terminate process.
- In the Terminate process pane that opens, specify one of the following parameters:
- PID. ID of the process.
For the Terminate process by PID response action with fixed scope, if the assets of the response action belong to the same Administration Server, you can run this response action for only one asset at a time.
For the Terminate process by PID response action with modifiable scope, you cannot run this response action.
- Hash (MD5 or SHA256 hash algorithm) and Path to the process file.
- PID. ID of the process.
- Click the Terminate button.
The process is terminated.
Running the Terminate process from an investigation graph
The option is available if the investigation graph is built.
To run the Terminate process from an investigation graph:
- In the main menu, go to Monitoring & reporting → Incidents. In the ID column, click the link with the incident ID you need.
- In the Incident details window that opens, click the View on graph button.
The Investigation graph window opens.
- Click the name of the alert you need, and then click View details.
- In the window that opens, go to the Observables tab.
- In the list of observables, select one or several observables for which you want to terminate the process. The observables may include:
- MD5
- SHA256
- Click the Terminate process button.
- In the Terminate process pane that opens, select assets for which you want to terminate the process.
- Click the Terminate button.
The process is terminated.
Page top
Moving devices to another administration group
As a response action, you can move a device to another administration group of Open Single Management Platform. This may be required when the analysis of an alert or incident shows that the protection level of the device is low. When you move a device to another administration group, the group policies and tasks are applied to the device.
The administration group to which you move the device must belong to the same tenant as the device.
You can move a device to another administration group in one of the following ways:
- From the alert or incident details
- From the device details
- From an investigation graph
You can also configure the response action to run automatically when creating or editing a playbook.
To move a device to another administration group, you must have one of the following XDR roles: Main administrator, Tenant administrator, Junior analyst, Tier 1 analyst, Tier 2 analyst.
It might take up to 15 minutes to launch a response action due to the synchronization interval between the managed device and Administration Server.
Moving a device to another administration group from alert or incident details
To move a device to another administration group from alert or incident details:
- Do one of the following:
- In the main menu, go to Monitoring & reporting → Alerts. In the ID column, click the ID of the alert that includes the device to be moved.
- In the main menu, go to Monitoring & reporting → Incidents section. In the ID column, click the ID of the incident that includes the device to be moved.
- In the window that opens, go to the Assets tab.
- Select check box next to the device to be moved to another administration group.
You can select several devices, if the devices are managed by the same Administration Server: primary, secondary, or virtual.
- In the Select response actions drop-down list, select Move to group.
The Move to group window that opens on the right side of the screen displays the administration groups of the Administration Server that manages the selected device.
- Select the administration group to which you want to move the device, and then click the Move button.
The device will be moved to the selected administration group. An appropriate message is displayed on the screen.
Moving a device to another administration group from the device details
To move a device to another administration group from the device details:
- Do one of the following:
- In the main menu, go to Monitoring & reporting → Alerts. In the ID column, click the ID of the alert that includes the device to be moved.
- In the main menu, go to Monitoring & reporting → Incidents section. In the ID column, click the ID of the incident that includes the device to be moved.
- In the window that opens, go to the Assets tab.
- Click the name of the required device, and then in the drop-down list, select View properties.
- In the Select response actions drop-down list, select Move to group.
The Move to group window that opens on the right side of the screen displays the administration groups of the Administration Server that manages the selected device.
- Select the administration group to which you want to move the device, and then click the Move button.
The device will be moved to the selected administration group. An appropriate message is displayed on the screen.
Moving a device to another administration group from an investigation graph
This option is available if the investigation graph is built.
To move a device to another administration group from an investigation graph:
- In the main menu, go to Monitoring & reporting → Incidents section. In the ID column, click the ID of the incident that includes the device to be moved.
- Click the View on graph button.
- In the investigation graph that opens, click the device name to open the device details.
- In the Select response actions drop-down list, select Move to group.
The Move to group window that opens on the right side of the screen displays the administration groups of the Administration Server that manages the selected device.
- Select the administration group to which you want to move the device, and then click the Move button.
The device will be moved to the selected administration group. An appropriate message is displayed on the screen.
Page top
Running a malware scan
To prevent a threat distribution on an infected device, you can run a malware scan in one of the following ways:
- From the alert or incident details
- From the device details
- From an investigation graph
You can also configure the response action to run automatically when creating or editing a playbook.
To perform the Malware scan response action, you must have one of the following XDR roles: Main administrator, Tenant administrator, Junior analyst, Tier 1 analyst, Tier 2 analyst.
It might take up to 15 minutes to launch a response action due to the synchronization interval between the managed device and Administration Server.
Running a malware scan from the alert or incident details
To scan a device for malware from the alert or incident details:
- Do one of the following:
- In the main menu, go to Monitoring & reporting → Alerts. In the ID column, click the ID of the alert that includes the device to be scanned.
- In the main menu, go to Monitoring & reporting → Incidents section. In the ID column, click the ID of the incident that includes the device to be scanned.
- In the window that opens, go to the Assets tab.
- Select check box next to the device to be scanned.
You can select several devices, if necessary.
- In the Select response actions drop-down list, select Run virus scan.
The Virus scan window opens on the right side of the screen.
- Select the type of malware scan:
- Full scan
You can switch the Network drives toggle button to include network devices into the scan. By default, this option is disabled.
A full scan can slow down the device due to an increased load on its operation system.
- Critical areas scan
The kernel memory, running processes, and disk boot sectors are scanned if you select this type.
- Custom scan
In the Specify a path to the file field, specify a path to the file that you want to scan. If you want to set several paths, click the Add path button, and then specify the path.
- Full scan
- Click the Scan button.
The selected type of malware scan starts.
Running a malware scan from the device details
To scan a device for malware from the device details:
- Do one of the following:
- In the main menu, go to Monitoring & reporting → Alerts. In the ID column, click the ID of the alert that includes the device to be scanned.
- In the main menu, go to Monitoring & reporting → Incidents section. In the ID column, click the ID of the incident that includes the device to be scanned.
- In the window that opens, go to the Assets tab.
- Click the name of the required device, and then in the drop-down list, select View properties.
You can click the Edit in KUMA button to edit parameters of the device in KUMA Console, if necessary.
- In the Select response actions drop-down list, select Run virus scan.
The Virus scan window opens on the right side of the screen.
- Select the type of malware scan. The types are described at step 5 in Running a malware scan from the alert or incident details.
- Click the Scan button.
The selected type of malware scan starts.
Running a malware scan from an investigation graph
This option is available if the investigation graph is built.
To scan a device for malware from an investigation graph:
- In the main menu, go to Monitoring & reporting → Incidents section. In the ID column, click the ID of the incident that includes the device to be scanned.
- Click the View on graph button.
- In the investigation graph that opens, click the device name to open the device details.
- In the Select response actions drop-down list, select Run virus scan.
The Virus scan window opens on the right side of the screen.
- Select the type of malware scan. The types are described at step 5 in Running a malware scan from the alert or incident details.
- Click the Scan button.
The selected type of malware scan starts.
If the malware scan is completed successfully, an appropriate message is displayed on the screen, and the alert or incident is displayed in the alert table or incident table with the Success action status. Otherwise, an error message is displayed, and the alert or incident is displayed with the Error action status.
After the malware scan operation is finished, you can view the result.
Page top
Viewing the result of the malware scan
After the malware scan is finished, you can view its result in one of the following ways:
- From the alert or incident details
- From a response history
- From a playbook details
To view the result of the malware scan:
- In the main menu, go to the Monitoring & reporting section, and then do one of the following:
- If you want to view the result from alert or incident details, go to the Alerts or Incidents section, and then click the ID of the alert or incident for which malware scan was performed. In the window that opens, go to the History tab, and then select the Response history tab to display the list of events.
- If you want to view the result from a response history, go to the Response history section.
- If you want to view the result of the malware scan from a playbook, go to the Playbooks section, and then click the name of the playbook for which the malware scan was performed. In the window that opens, go to the History tab to display the list of events.
- In the Action status column, click the status of the event for which you want to view the results of the malware scan.
In the window that opens, a table of detections is displayed. In the Administration Server field, you can select the Administration Server for which a table of detections is displayed.
The table contains the following columns:
- Device. Device name or ID.
- Path. Path to the file.
- Hash. SHA256.
- Detection name. Name of the detection that occurred on the device.
- Action status. Threat processing result.
- User. Account of the user who is associated with the detection.
Updating databases
To detect threats quickly and keep the protection level of a client device up to date, you have to regularly update databases and application modules on the device.
You can update databases on a device in one of the following ways:
- From the alert or incident details
- From the device details
- From an investigation graph
You can also configure the response action to run automatically when creating or editing a playbook.
To update databases on a device, you must have one of the following XDR roles: Main administrator, Tenant administrator, Junior analyst, Tier 1 analyst, Tier 2 analyst.
It might take up to 15 minutes to launch a response action due to the synchronization interval between the managed device and Administration Server.
Updating databases from the alert or incident details
To update databases on a device from the alert or incident details:
- Do one of the following:
- In the main menu, go to Monitoring & reporting → Alerts. In the ID column, click the ID of the alert that includes the device on which databases are to be updated.
- In the main menu, go to Monitoring & reporting → Incidents section. In the ID column, click the ID of the incident that includes the device on which databases are to be updated.
- In the window that opens, go to the Assets tab.
- Select check box next to the devices on which databases are to be updated.
You can select several devices, if necessary.
- In the Select response actions drop-down list, select Update databases.
If the operation is completed successfully, an appropriate message is displayed on the screen. Otherwise, an error message is displayed.
Updating databases from the device details
To update databases on a device from the device details:
- Do one of the following:
- In the main menu, go to Monitoring & reporting → Alerts. In the ID column, click the ID of the alert that includes the device on which databases are to be updated.
- In the main menu, go to Monitoring & reporting → Incidents section. In the ID column, click the ID of the incident that includes the device on which databases are to be updated.
- In the window that opens, go to the Assets tab.
- Click the name of the required device, and then in the drop-down list, select View properties.
- In the Select response actions drop-down list, select Update databases.
If the operation is completed successfully, an appropriate message is displayed on the screen. Otherwise, an error message is displayed.
Updating databases from an investigation graph
This option is available if the investigation graph is built.
To update databases on a device from an investigation graph:
- In the main menu, go to Monitoring & reporting → Incidents section. In the ID column, click the ID of the incident that includes the device on which databases are to be update.
- Click the View on graph button.
- In the investigation graph that opens, click the device name to open the device details.
- In the Select response actions drop-down list, select Update databases.
If the operation is completed successfully, an appropriate message is displayed on the screen. Otherwise, an error message is displayed.
Page top
Moving files to quarantine
To prevent a threat distribution, you can move a device on which the file is located to quarantine in one of the following ways:
- From the alert or incident details
- From the device details
- From a telemetry event
- From an investigation graph
You can also configure the response action to run automatically when creating or editing a playbook.
To move a device on which the file is located to quarantine, you must have one of the following XDR roles: Main administrator, Tenant administrator, Junior analyst, Tier 1 analyst, Tier 2 analyst.
It might take up to 15 minutes to launch a response action due to the synchronization interval between the managed device and Administration Server.
Responding from the alert or incident details
To move a device to quarantine from the alert or incident details:
- Do one of the following:
- In the main menu, go to Monitoring & reporting → Alerts. In the ID column, click the ID of the alert that includes the device to be moved.
- In the main menu, go to Monitoring & reporting → Incidents section. In the ID column, click the ID of the incident that includes the device to be moved.
- In the window that opens, go to the Assets tab.
- Select check box next to the device which is to be moved to quarantine.
You can select several devices, if necessary.
- In the Select response actions drop-down list, select Move to quarantine.
- In the window that opens on the right side of the screen, specify the following information in the corresponding fields:
- File hash.
You can select either SHA256 or MD5.
- Path to the file.
- File hash.
- Click the Move button.
If the operation is completed successfully, an appropriate message is displayed on the screen. Otherwise, an error message is displayed.
Responding from the device details
To move a device to quarantine from the device details:
- Do one of the following:
- In the main menu, go to Monitoring & reporting → Alerts. In the ID column, click the ID of the alert that includes the device to be moved.
- In the main menu, go to Monitoring & reporting → Incidents section. In the ID column, click the ID of the incident that includes the device to be moved.
- In the window that opens, go to the Assets tab.
- Click the name of the required device, and then in the drop-down list, select View properties.
- In the Select response actions drop-down list, select Move to quarantine.
- In the window that opens on the right side of the screen, specify the following information on the corresponding fields:
- File hash.
You can select either SHA256 or MD5.
- Path to the file.
- File hash.
- Click the Move button.
If the operation is completed successfully, an appropriate message is displayed on the screen. Otherwise, an error message is displayed.
Responding from a telemetry event
To move a device to quarantine from a telemetry event:
- In the main menu, go to Monitoring & reporting → Alerts. In the ID column, click the ID of the alert that includes the device to be moved.
- In the window that opens, go to the Details tab, and do one of the following:
- Click the name of the required event and select the device.
- Click the Find in Threat hunting button to go to the Threat hunting section and select the required device.
You can also go to the Observables tab, select check box next to the file that you want to move to quarantine, and then click the Move to quarantine button.
- In the Select response actions drop-down list, select Move to quarantine.
- In the window that opens on the right side of the screen, specify the following information on the corresponding fields:
- File hash.
You can select either SHA256 or MD5.
- Path to the file.
- File hash.
- Click the Move button.
If the operation is completed successfully, an appropriate message is displayed on the screen. Otherwise, an error message is displayed.
Responding from an investigation graph
This option is available if the investigation graph is built.
To move a device to quarantine from an investigation graph:
- In the main menu, go to Monitoring & reporting → Incidents section. In the ID column, click the ID of the incident that includes the device to be moved.
- In the window that opens, click the View on graph button.
The investigation graph opens.
- Click the device name to open the device details.
- In the Select response actions drop-down list, select Move to quarantine.
- In the window that opens on the right side of the screen, specify the following information on the corresponding fields:
- File hash.
You can select either SHA256 or MD5.
- Path to the file.
- File hash.
- Click the Move button.
If the operation is completed successfully, an appropriate message is displayed on the screen. Otherwise, an error message is displayed.
Page top
Changing authorization status of devices
You can change an authorization status of a device when the analysis of an alert or incident shows that the protection level of the device is low or the device does harm to your infrastructure.
This response action is performed on devices with KICS for Networks installed.
You can change an authorization status of a device in one of the following ways:
- From the alert or incident details
- From the device details
- From a telemetry event
- From an investigation graph
You can also configure the response action to run automatically when creating or editing a playbook.
To change an authorization status of a device, you must have one of the following XDR roles: Main administrator, Tenant administrator, Junior analyst, Tier 1 analyst, Tier 2 analyst.
Changing authorization status of devices from alert or incident details
To change an authorization status of a device from the alert or incident details:
- Do one of the following:
- In the main menu, go to Monitoring & reporting → Alerts. In the ID column, click the ID of the alert that includes the device which authorization status is to be changed.
- In the main menu, go to Monitoring & reporting → Incidents section. In the ID column, click the lD of the incident that includes the device which authorization status is to be changed.
- In the window that opens, go to the Assets tab.
- Select check box next to the device which authorization status is to be changed.
You can select several devices, if necessary.
- In the Select response actions drop-down list, select Change authorization status.
- In the window that opens on the right side of the screen, select the new status of the device (authorized or unauthorized), and then click the Change button.
If the operation is completed successfully, an appropriate message is displayed on the screen. Otherwise, an error message is displayed.
Changing authorization status of devices from the device details
To change an authorization status of a device from the device details:
- Do one of the following:
- In the main menu, go to Monitoring & reporting → Alerts. In the ID column, click the ID of the alert that includes the device which authorization status is to be changed.
- In the main menu, go to Monitoring & reporting → Incidents section. In the ID column, click the ID of the incident that includes the device which authorization status is to be changed.
- In the window that opens, go to the Assets tab.
- Click the name of the required device, and then in the drop-down list, select View properties.
- In the Select response actions drop-down list, select Change authorization status.
- In the window that opens on the right side of the screen, select the new status of the device (authorized or unauthorized), and then click the Change button.
If the operation is completed successfully, an appropriate message is displayed on the screen. Otherwise, an error message is displayed.
Changing authorization status of devices from a telemetry event
To change an authorization status of a device from a telemetry event:
- In the main menu, go to Monitoring & reporting → Alerts. In the ID column, click the ID of the alert that includes the device which authorization status is to be changed.
- In the window that opens, go to the Details tab, and do one of the following:
- Click the name of the required event and select the device.
- Click the Find in Threat hunting button to go to the Threat hunting section and select the required device.
- In the Select response actions drop-down list, select Change authorization status.
- In the window that opens on the right side of the screen, select the new status of the device (authorized or unauthorized), and then click the Change button.
If the operation is completed successfully, an appropriate message is displayed on the screen. Otherwise, an error message is displayed.
Changing authorization status of devices from an investigation graph
This option is available if the investigation graph is built.
To change an authorization status of a device from an investigation graph:
- In the main menu, go to Monitoring & reporting → Incidents section. In the ID column, click the ID of the incident that includes the device which authorization status is to be changed.
- In the window that opens, click the View on graph button.
The investigation graph opens.
- Click the device name to open the device details.
- In the Select response actions drop-down list, select Change authorization status.
- In the window that opens on the right side of the screen, select the new status of the device (authorized or unauthorized), and then click the Change button.
If the operation is completed successfully, an appropriate message is displayed on the screen. Otherwise, an error message is displayed.
The selected authorization status of the device in displayed in the alert or incident card, on the Assets tab → Authorization status column.
Page top
Viewing information about KASAP users and changing learning groups
After configuring the integration between KASAP and KUMA, the following information from KASAP is available in OSMP Console when you view data about users associated with alerts or incidents:
- The learning group to which the user belongs.
- The learning courses completed by the user.
- The planned learning courses and their current progress.
You can view data about the KASAP user. To do this, you have to open a user details in one of the following ways:
- From the alert or incident details.
- From a telemetry event (if you open it from alert details).
- From an investigation graph.
This option is available if the investigation graph is built.
To open a user details:
- In the main menu, go to the Monitoring & reporting section, and then select the Alerts or Incidents section.
If you want to open a user details from a telemetry event, select the Alerts section.
If you want to open a user details from an investigation graph, select the Incidents section.
- Click the ID of the required alert or incident.
- In the window that opens, do one of the following:
- If you want to open a user details from a telemetry event, go to the Details tab, and either click the name of the required event, and select the user; or click the Find in Threat hunting button to go to the Threat Hunting section, and then select the required user.
- If you want to open a user details from alert or incident details, go to the Assets tab, and then click the name of the required user.
- If you want to open a user details from investigation graph, click the View on graph button. In the investigation graph that opens, click the name of the required user.
The Account details window opens on the right side of the screen.
- Select the Cybersecurity courses tab.
The window displays information about the KASAP user.
You can change the learning group of a KASAP user in one of the following ways:
- From the alert or incident details
- From a telemetry event (if you open it from alert details)
- From an investigation graph
This option is available if the investigation graph is built.
You can also configure the response action to run automatically when creating or editing a playbook. In this case, if you move a user to the group for which the learning is not started, the user is not able to start learning.
To perform the response action, you must have one of the following XDR roles: Main administrator, Tenant administrator, Junior analyst, Tier 1 analyst, Tier 2 analyst.
To change the KASAP user learning group:
- In the main menu, go to the Monitoring & reporting section, and then select the Alerts or Incidents section.
If you want to change the KASAP user learning group from a telemetry event, select the Alerts section.
If you want to change the KASAP user learning group from an investigation graph, select the Incidents section.
- Click the ID of the required alert or incident.
- In the window that opens, do one of the following:
- If you want to respond through a telemetry event, go to the Details tab, and either click the name of the required event, and then select the user; or click the Find in Threat hunting button to go to the Threat hunting section, and then select the required user.
- If you want to respond through a user details, go to the Assets tab, and then click the name of the user.
- If you want to respond through an investigation graph, click the View on graph button. In the investigation graph that opens, click the name of the user.
The Account details window opens on the right side of the screen.
- In the Assign KASAP group drop-down list, select the KASAP learning group to which you want to assign the user.
Recalculation of the KASAP user training plan may take up to 30 minutes. It is not advisable to change the KASAP learning group during this period.
The user is moved to the selected KASAP group. The KASAP company administrator receives a notification about the change in the learning group, and the study plan is recalculated for the selected learning group.
For details about learning groups and how to get started, refer to the KASAP documentation.
Page top
Responding through Active Directory
You can integrate Kaspersky Next XDR Expert with the Active Directory services that are used in your organization. Active Directory is considered to be integrated with Kaspersky Next XDR Expert after the integration between Active Directory and KUMA is configured.
The process of configuring integration between Kaspersky Next XDR Expert and Active Directory consists of configuring connections to LDAP. You must configure connections to LDAP separately for each tenant.
As a result, if an alert or an incident occurs, you will be able to perform response actions in relation to the associated users of that tenant.
You can perform a response action through Active Directory in one of the following ways:
- From the alert or incident details
- From a telemetry event (if you open it from alert details)
- From an investigation graph
This option is available if the investigation graph is built.
You can also configure a response action to run automatically when creating or editing a playbook.
To perform a response action through Active Directory, you must have one of the following XDR roles: Main administrator, Tenant administrator, Junior analyst, Tier 1 analyst, Tier 2 analyst.
To perform a response action through Active Directory:
- In the main menu, go to the Monitoring & reporting section, and then select the Alerts or Incidents section.
If you want to respond from the telemetry event, select the Alerts section.
If you respond from an investigation graph, select the Incidents section.
- Click the ID of the required alert or incident.
- In the window that opens, do one of the following:
- If you want to respond through the alert or incident details, go to the Assets tab, and then click the name of the user.
- If you want to respond through a telemetry event, go to the Details tab, and either click the name of the required event, and then select the user; or click the Find in Threat hunting button to go to the Threat Hunting section, and then select the required user.
- If you want to respond through an investigation graph, click the View on graph button. In the investigation graph that opens, click the name of the user.
The Account details window opens on the right side of the screen.
- In the Response through Active Directory drop-down list, select an action that you want to perform:
- Lock account
If the user account is locked in response to the related alert or incident, an appropriate message is displayed on the screen. Otherwise, an error message is displayed.
- Reset password
If the user account password is reset in response to the related alert or incident, an appropriate message is displayed on the screen. Otherwise, an error message is displayed.
- Add user to security group
In the window that opens, in the mandatory field Security group DN, specify a full path to the security group to which you want to add the user. For example, CN = HQ Team, OU = Groups, OU = ExchangeObjects, DC = avp, DC = ru. Then click the Add button. Only one group can be specified within one operation.
If the user is added to the security group in response to the related alert or incident, an appropriate message is displayed on the screen. Otherwise, an error message is displayed.
- Delete user from security group
In the window that opens, in the mandatory field Security group DN, specify a full path to the security group from which you want to delete the user. For example, CN = HQ Team, OU = Groups, OU = ExchangeObjects, DC = avp, DC = ru. Then click the Delete button. Only one group can be specified within one operation.
If the user is deleted from the security group in response to the related alert or incident, an appropriate message is displayed on the screen. Otherwise, an error message is displayed.
- Lock account
Responding through KATA/KEDR
After you configure integration between Kaspersky Next XDR Expert and Kaspersky Anti Targeted Attack Platform, you can perform response actions on a device or with a file hash in one of the following ways:
- From the alert or incident details
- From the device details
- From the event details
This option is available for the Add prevention rule response action.
- From an investigation graph
You can also configure the response action to run automatically when creating or editing a playbook.
To perform response actions through Kaspersky Anti Targeted Attack Platform, you must have one of the following XDR roles: Main administrator, Tenant administrator, Junior analyst, Tier 1 analyst, Tier 2 analyst.
Performing response actions from alert or incident details
To perform a response action from the alert or incident details:
- Do one of the following:
- In the main menu, go to Monitoring & reporting → Alerts. In the ID column, click the ID of the alert that includes the required device.
- In the main menu, go to Monitoring & reporting → Incidents section. In the ID column, click the ID of the incident that includes the required device.
- In the window that opens, go to the Assets tab.
- Select the select check box next to the required device.
You can select several devices, if necessary.
- In the Select response actions drop-down list, select the response action that you want to perform:
- Enable network isolation
If you select this response action for a device on which network isolation is already enabled, the parameters are overwritten with new values.
After you select this response action, you must configure the necessary settings in the window that opens on the right side of the screen.
- Disable network isolation
You can select this response action for devices on which network isolation is enabled.
- Run executable file
The executable file is always run on behalf of the system and must be available on the device before you start the response action.
After you select this response action, you must configure the necessary settings in the window that opens on the right side of the screen.
- Add prevention rule
After you select this response action, you must configure the necessary settings in the window that opens on the right side of the screen.
- Delete prevention rule
You can select this response action for devices on which the prevention rule was applied.
All of the listed response actions are available on devices that use Kaspersky Endpoint Agent for Windows or Kaspersky Endpoint Security for Windows in the role of the Endpoint Agent component. On devices with Kaspersky Endpoint Agent for Linux and Kaspersky Endpoint Security for Linux, the only available response action is Run executable file.
- Enable network isolation
- In the window that opens, set the necessary parameters for the response action you selected at step 4:
If the response action is completed successfully, an appropriate message is displayed on the screen. Otherwise, an error message is displayed.
Performing response actions from the device details
To perform a response action from the device details:
- Do one of the following:
- In the main menu, go to Monitoring & reporting → Alerts. In the ID column, click the ID of the alert that includes the required device.
- In the main menu, go to Monitoring & reporting → Incidents section. In the ID column, click the ID of the incident that includes the required device.
- In the window that opens, go to the Assets tab.
- Click the name of the required device, and then in the drop-down list, select View properties.
- Perform the same actions as described at steps 4-5 in Performing response actions from the device details.
If the response action is completed successfully, an appropriate message is displayed on the screen. Otherwise, an error message is displayed.
Performing a response action from the event details
This option is available for the Add prevention rule response action.
To perform a response action from the event details:
- In the main menu, go to Monitoring & reporting → Alerts. In the ID column, click the ID of the alert that includes the required device.
- In the window that opens, go to the Details tab, and select the required file hash.
- Click the Add prevention rule button, and then select the device for which you want to add the prevention rule.
You can also go to the Observables tab, select check box next to the file hash that you want to block, and then click the Add prevention rule button.
- Perform the same actions as described at steps 4-5 in Performing response actions from the device details.
If the response action is completed successfully, an appropriate message is displayed on the screen. Otherwise, an error message is displayed.
Performing response actions from an investigation graph
This option is available if the investigation graph is built.
To perform a response action from an investigation graph:
- In the main menu, go to Monitoring & reporting → Incidents section. In the ID column, click the ID of the incident that includes the required device.
- In the window that opens, click the View on graph button.
The investigation graph opens.
- Click the device name to open the device details.
- Perform the same actions as described at steps 4-5 in Performing response actions from the device details.
If the response action is completed successfully, an appropriate message is displayed on the screen. Otherwise, an error message is displayed.
If you encounter a failure when running the response actions, you have to make sure that the device name in Kaspersky Next XDR Expert is the same as in Kaspersky Anti Targeted Attack Platform.
Page top
Responding through UserGate
UserGate includes features of unified threat management solutions and provides the following means of protection for your local network:
- Firewall
- Intrusion and attack protection
- Anti-virus traffic scanning
- Application control
UserGate UTM API 7 version is supported.
You can respond to alerts and incidents through UserGate if you previously configured integration between Kaspersky Next XDR Expert and script launch service, as well as created a playbook that will launch a script for responding. You can download the scripts by clicking this link.
The login and password to access UserGate are stored in the ug.py script. You can change the endpoint, login, and password values in this script.
Python 3.10 is required to run the scripts.
To perform a response action through UserGate, you must have one of the following XDR roles: Main administrator, Tenant administrator, Junior analyst, Tier 1 analyst, Tier 2 analyst.
You can create playbooks that will perform the following response actions through UserGate:
- Block IP addresses, URL and domain names.
UserGate will block IP addresses, URL and domain names as a result of the playbook launch.
- Log out the users.
All users that are logged in to UserGate will be logged out as a result of the playbook launch.
To launch a script for responding through UserGate:
- In the main menu, go to the Monitoring & reporting section, and then in Alerts or Incidents section, click the ID of the required alert or incident.
- Click the Select playbook button, and then in the window that opens, select the playbook that you created for responding through UserGate.
- Click the Launch button.
The selected playbook launches the script for responding through UserGate.
If the operation is completed successfully, an appropriate message is displayed on the screen. Otherwise, an error message is displayed.
The result of the playbook launch is available in the alert or incident details, on the History tab.
Page top
Responding through Ideco NGFW
Ideco NGFW is a solution that acts as a filter for the internet traffic in corporate and private networks. It allows you to block IP addresses and URLs detected by Kaspersky Next XDR Expert, if you previously configured integration between Kaspersky Next XDR Expert and the script launch service.
Ideco NGFW version 16.0 or later is supported.
The login and password to access Ideco NGFW are stored in the script for integration with Ideco NGFW. You can download the script by clicking the following link:
To use the script:
- Install the script in one of the following ways:
- Via pip, for example:
pip install -r requirements.txt - From the WHL file, for example:
pip install ./dist/kaspersky_xdr_ideco_integration-<version>-py3-none-any.whl - Offline installation.
If you do not have internet access, you must install the script offline. In this case, do the following:
- Download the dependencies on a computer that has internet access, by running the following command:
pip download -r requirements.txt - Move the downloaded dependencies to the device on which you will run the script.
- Install the dependencies by using the command:
pip install --no-index --find-links <folder_path_to_downloaded_dependencies> -r requirements.txt
- Download the dependencies on a computer that has internet access, by running the following command:
- Via pip, for example:
- Configure the script in one of the following ways:
- Via the ENV file, for example:
cp .env.sample .envnano .env - In the body of the script (ideco.py), edit the parameters in the following strings:
BASE_URL: str = getenv("BASE_URL", "https://your-ip:your-port")LOGIN: str = getenv("LOGIN", "your-login")PASSWORD: str = getenv("PASSWORD", "your-password")IP_DENY_LIMIT: int = int(getenv("IP_DENY_LIMIT", 1000))
- Via the ENV file, for example:
- Add deny rules for the IP addresses detected by Kaspersky Next XDR Expert and for malicious URLs.
To add a firewall rule that will block IP addresses:
- Run the script by using the add_firewall_rule command.
- Specify the IP addresses that you want to block.
By default, the maximum number of IP addresses is 1000. You can edit this value, as described at step 2 Configure the script.
You must add valid IPv4 addresses, separated with commas and without spaces, for example:
python ideco.py add_firewall_rule --ip_address "12.12.12.12, 13.13.13.13"
The deny rule for the selected IPv4 addresses is added, for example:

To add a filtering rule that will block malicious URLs:
- Run the script by using the add_content_filter_file command.
- Specify the URLs that you want to block.
The URLs must be separated with commas, and have http:// or https:// prefixes, for example:
python ideco.py add_content_filter_rule --url "https://url_1.com, http://url_2.com.uk, http://qwerty.nl, http://zxc.xc"
The deny rule for the specified URLs is added, for example:

Responding through Ideco UTM
Ideco UTM is a solution providing the following means of protection for your corporate network:
- Firewall—Filtering network traffic, to protect the network from unauthorized access.
- Intrusion and attack protection—Identifying and blocking suspicious actions, to ensure system integrity.
- Anti-virus traffic scanning—Protecting against malware and malicious activities.
- Application control—Blocking or restricting execution of unauthorized applications.
- Web filtering—Restricting user access to websites that you consider unwanted.
Ideco UTM 15.7.35 version is supported.
You can respond to alerts and incidents by using Ideco UTM if you previously configured integration between Kaspersky Next XDR Expert and a script launch service, as well as created a playbook that will launch a script for responding. As a result of the playbook launch, Ideco UTM will block IP addresses, IP ranges, or URLs, depending on the action that you specify when creating a playbook.
To unblock the IP addresses, IP ranges, or URLs that have been blocked, you have to create and launch another playbook.
You can download the script by clicking this link:
The login and password to access Ideco UTM are stored in the env.sample configuration file. You have to copy the information from this file to a new ENV file that you create, and then specify the necessary parameters in the new file.
Python 3.10 is required to run the script.
To perform a response action through Ideco UTM, you must have one of the following XDR roles: Main administrator, Tenant administrator, Junior analyst, Tier 1 analyst, or Tier 2 analyst.
To launch a script for responding through Ideco UTM:
- In the main menu, go to the Monitoring & reporting section, and then in the Alerts or Incidents sections, click the ID of the required alert or incident.
- Click the Select playbook button, and then in the window that opens, select the playbook that you created for responding through Ideco UTM.
- Click the Launch button.
The selected playbook launches the script for responding through Ideco UTM.
If the operation is completed successfully, an appropriate message is displayed on the screen. Otherwise, an error message is displayed.
The result of the playbook launch is available in the alert or incident details, on the History tab.
Page top
Responding through Redmine
Redmine is a web application for project management and issue tracking. It allows you to automate the scenario of working with issues in Redmine projects by using the script if you previously configured integration between Kaspersky Next XDR Expert and the script launch service.
Download the script by clicking this link:
To use the script:
- Install the script in one of the following ways:
- Via pip, for example:
pip install -r requirements.txt - From the WHL file, for example:
pip install ./dist/kaspersky_xdr_redmine_integration-1.0-py3-none-any.whl - Offline installation.
If you do not have internet access, you have to install the script offline. In this case, do the following:
- Download the dependencies on a computer that has internet access, by using the following command:
pip download -r requirements.txt - Move the downloaded dependencies to the device on which you will run the script.
- Install the dependencies by using the following command:
pip install --no-index --find-links <folder_path_to_downloaded_dependencies> -r requirements.txt
- Download the dependencies on a computer that has internet access, by using the following command:
- Via pip, for example:
- Configure the script in one of the following ways:
- Via the ENV file, for example:
cp .env.sample .envnano .env - In the body of the script (redmine.py), edit the parameters in the following strings:
REDMINE_URL: str = getenv("REDMINE_URL", "http://<ip_or_hostname>")REDMINE_PORT: str = getenv("REDMINE_PORT", "8080")REDMINE_API_KEY: str = str(getenv("REDMINE_API_KEY", "<redmine_api_key>"))
- Via the ENV file, for example:
You can use the script to work with issues in Redmine.
- If you want to create a new issue, run the following command:
python redmine.py create_issue "project-identifier" "Issue subject" --description "Issue description text" --priority_id <id: int>Result:
{"issue_id": 57} - If you want to update an issue, run the following command:
python redmine.py update_issue <issue_id: int> --subject "Subject text to be updated" --description "Description text to be updated" --priority_id <id: int>Result:
{"status": "issue_updated"} - If you want to get an issue, run the following command:
python redmine.py get_issue <issue id: int>Result:
{"subject": "86","description": "18","project_name": "Test project","author_name": "Redmine Admin","status_name": "backlog","priority_name": "high","start_date": "24.07.2023","due_date": null,"created_on": "24.07.2023 10:56:15","updated_on": "24.07.2023 17:18:38"}
Responding through Check Point NGFW
Check Point NGFW is a solution that acts as a filter for internet traffic in corporate networks. Integration with Check Point NGFW allows you to block IP addresses and URLs detected by Kaspersky Next XDR Expert.
Check Point NGFW includes features of unified threat management solutions and provides the following means of protection for corporate networks:
- Firewall—Filtering network traffic, to protect the network from unauthorized access.
- Intrusion and attack protection—Identifying and blocking suspicious actions, to ensure system integrity.
- Anti-virus traffic scanning—Protecting against malware and malicious activities.
- Application control—Blocking or restricting execution of unauthorized applications.
- Web filtering—Restricting user access to websites that you consider unwanted.
Check Point NGFW version R81.20 or later is supported.
You can respond to alerts and incidents through Check Point NGFW if you previously configured integration between Kaspersky Next XDR Expert and the script launch service, as well as created a playbook that will launch a script for responding. To unblock the IP addresses or URLs that have been blocked, you have to create and launch another playbook.
Python 3.10 is required to run the scripts.
To perform a response action through Check Point NGFW, you must have one of the following XDR roles: Main administrator, Tenant administrator, Junior analyst, Tier 1 analyst, or Tier 2 analyst.
You can download the scripts for responding by clicking the following link:
The login and password to access Check Point NGFW are stored in the file .envSample.
To use the script:
- Install the script in one of the following ways:
- Via pip, for example:
pip install -r requirements.txt - Offline installation.
If you do not have internet access, you must install the script offline. In this case, do the following:
- Download the dependencies on a computer that has internet access, by running the following command:
pip download -r requirements.txt - Move the downloaded dependencies to the device on which you will run the script.
- Install the dependencies by using the command:
pip install --no-index --find-links <folder_path_to_downloaded_dependencies> -r requirements.txt
- Download the dependencies on a computer that has internet access, by running the following command:
- Via pip, for example:
- Configure the script in one of the following ways:
- Via the ENV file, for example:
cp .env.sample .envnano .env - In the body of the script (main.py), edit the parameters in the following strings:
BASE_IP: str = getenv("BASE_IP", "your-ip")BASE_PORT: str = getenv("BASE_PORT", "your-port")LOGIN: str = getenv("LOGIN", "your-login")PASSWORD: str = getenv("PASSWORD", "your-password")
- Via the ENV file, for example:
- Add deny rules for the IP addresses detected by Kaspersky Next XDR Expert and for malicious URLs.
To add a firewall rule that will block IP addresses:
- Run the script by using the add_firewall_rule command.
- Specify the IP addresses that you want to block.
By default, the maximum number of IP addresses is 1000. You can edit this value, as described in the previous procedure at step 2 Configure the script.
You must add valid IPv4 addresses, separated with commas and without spaces, for example:
python main.py add_firewall_rule --ip_address "12.12.12.12, 13.13.13.13"
The deny rule for the selected IPv4 addresses is added, for example:

To delete a firewall rule that blocks IP addresses:
- Run the script by using the delete_firewall_rule command.
- Specify the IP addresses that you want to block.
By default, the maximum number of IP addresses is 1000. You can edit this value, as described in the previous procedure at step 2 Configure the script.
You must add valid IPv4 addresses, separated with commas and without spaces, for example:
python main.py delete_firewall_rule --ip_address "12.12.12.12, 13.13.13.13"
The deny rule for the selected IPv4 addresses is deleted.
To add a filtering rule that will block malicious URLs:
- Run the script by using the add_content_filter_file command.
- Specify the URLs that you want to block.
The URLs must be separated with commas, and have an http:// or https:// prefix, for example:
python main.py add_content_filter_rule --url "https://url_1.com, http://url_2.com.uk, http://qwerty.nl, http://zxc.xc"
The deny rule for the specified URLs is added, for example:

To delete a filtering rule that blocks malicious URLs:
- Run the script by using the delete_content_filter_file command.
- Specify the URLs that you want to block.
The URLs must be separated with commas, and have an http:// or https:// prefix, for example:
python main.py delete_content_filter_rule --url "https://url_1.com, http://url_2.com.uk, http://qwerty.nl, http://zxc.xc"
The deny rule for the specified URLs is deleted.
To launch a script for responding through Check Point NGFW:
- In the main menu, go to the Monitoring & reporting section, and then in the Alerts or Incidents sections, click the ID of the required alert or incident.
- Click the Select playbook button, and then in the window that opens, select the playbook that you created for responding through Check Point NGFW.
- Click the Launch button.
The selected playbook launches the script for responding through Check Point NGFW.
If the operation is completed successfully, an appropriate message is displayed on the screen. Otherwise, an error message is displayed.
The result of the playbook launch is available in the alert or incident details, on the History tab.
Page top
Responding through Sophos Firewall
Sophos Firewall is a solution providing the following means of protection for your corporate network:
- Firewall—Filtering network traffic, to protect the network from unauthorized access.
- Intrusion and attack protection—Identifying and blocking suspicious actions, to ensure system integrity.
- Anti-virus traffic scanning—Protecting against malware and malicious activities.
- Application control—Blocking or restricting execution of unauthorized applications.
- Web filtering—Restricting user access to websites that you consider unwanted.
Sophos Firewall 19.5 version is supported.
You can respond to alerts and incidents by using Sophos Firewall if you previously configured integration between Kaspersky Next XDR Expert and a script launch service, as well as created a playbook that will launch a script for responding. As a result of the playbook launch, Sophos Firewall will block IP addresses, IP ranges, or URLs, depending on the action that you specify when creating a playbook.
To unblock the IP addresses, IP ranges, or URLs that have been blocked, you have to create and launch another playbook.
You can download the script by clicking this link:
The login and password to access Sophos Firewall are stored in the env.sample configuration file. You have to copy the information from this file to a new ENV file that you create, and then specify the necessary parameters in the new file.
Python 3.10 is required to run the script.
To perform a response action through Sophos Firewall, you must have one of the following XDR roles: Main administrator, Tenant administrator, Junior analyst, Tier 1 analyst, or Tier 2 analyst.
To launch a script for responding through Sophos Firewall:
- In the main menu, go to the Monitoring & reporting section, and then in the Alerts or Incidents sections, click the ID of the required alert or incident.
- Click the Select playbook button, and then in the window that opens, select the playbook that you created for responding through Sophos Firewall.
- Click the Launch button.
The selected playbook launches the script for responding through Sophos Firewall.
If the operation is completed successfully, an appropriate message is displayed on the screen. Otherwise, an error message is displayed.
The result of the playbook launch is available in the alert or incident details, on the History tab.
Page top
Responding through Continent 4
Continent 4 is a solution providing the following means of protection for your corporate network:
- Firewall—Filtering network traffic, to protect the network from unauthorized access.
- Intrusion and attack protection—Identifying and blocking suspicious actions, to ensure system integrity.
- VPN gateway—Creating secure tunnels for data transmission between your organization's networks.
- Access control—Managing user access to internal and external network resources, based on security rules and policies.
- Data encryption—Using cryptographic algorithms to protect the transmitted data.
Continent 4 version 4.1.7 is supported.
You can respond to alerts and incidents through Continent 4 if you previously configured integration between Kaspersky Next XDR Expert and a script launch service, as well as created a playbook that will launch a script for responding.
You can create playbooks that will perform the following response actions through Continent 4:
- Block IP addresses and URLs.
Continent 4 will block IP addresses and URLs. To unblock the IP addresses or URLs that have been blocked, you have to create and launch another playbook.
- Blocking the Indicators of Compromise (hereinafter also referred to as IoCs).
Continent 4 will block the observables that you specified in the playbook trigger.
You can download the script by clicking this link:
The login and password to access Continent 4 are stored in the env.sample configuration file. You have to copy the information from this file to a new ENV file that you create, and then specify the necessary parameters in the new file.
Python 3.10 is required to run the script.
To perform a response action through Continent 4, you must have one of the following XDR roles: Main administrator, Tenant administrator, Junior analyst, Tier 1 analyst, or Tier 2 analyst.
To launch a script for responding through Continent 4:
- In the main menu, go to the Monitoring & reporting section, and then in the Alerts or Incidents sections, click the ID of the required alert or incident.
- Click the Select playbook button, and then in the window that opens, select the playbook that you created for responding through Continent 4.
- Click the Launch button.
The selected playbook launches the script for responding through Continent 4.
If the operation is completed successfully, an appropriate message is displayed on the screen. Otherwise, an error message is displayed.
The result of the playbook launch is available in the alert or incident details, on the History tab.
Page top
Responding through SKDPU NT
SKDPU NT is a solution for privileged accounts management.
SKDPU NT version 7.0.4 is supported.
You can respond to alerts and incidents through SKDPU NT if you previously configured integration between Kaspersky Next XDR Expert and a script launch service, as well as created a playbook that will launch a script for responding.
You can create playbooks that will perform the following response actions through SKDPU NT:
- Termination of the user session. The playbook will terminate all sessions of the user when suspicious activities are detected or security rules are broken.
- Blocking the user account. The playbook will block the user account and limit the user's access to the system.
- Revoking the user rights. The user will be removed from the privileged user group, and the user's rights will be revoked.
You can download the script by clicking this link:
The login and password to access SKDPU NT are stored in the env.sample configuration file. You have to copy the information from this file to a new ENV file that you create, and then specify the necessary parameters in the new file.
Python 3.10 is required to run the script.
To perform a response action through SKDPU NT, you must have one of the following XDR roles: Main administrator, Tenant administrator, Junior analyst, Tier 1 analyst, or Tier 2 analyst.
To launch a script for responding through SKDPU NT:
- In the main menu, go to the Monitoring & reporting section, and then in the Alerts or Incidents sections, click the ID of the required alert or incident.
- Click the Select playbook button, and then in the window that opens, select the playbook that you created for responding through SKDPU NT.
- Click the Launch button.
The selected playbook launches the script for responding through SKDPU NT.
If the operation is completed successfully, an appropriate message is displayed on the screen. Otherwise, an error message is displayed.
The result of the playbook launch is available in the alert or incident details, on the History tab.
Page top
Responding through FortiGate
FortiGate is a solution providing the following means of protection for your corporate network:
- Firewall—Filters network traffic and prevents unauthorized access.
- Intrusion and attack protection—Identifies and blocks suspicious actions.
- Web filtering—Restricts user access to websites that you consider unwanted.
- Malware protection—Prevents malware infections.
- Email filtering—Blocks spam messages and suspicious emails.
FortiGate 7.6.0 version is supported.
You can respond to alerts and incidents by using FortiGate if you previously configured integration between Kaspersky Next XDR Expert and a script launch service, as well as created a playbook that will launch a script for responding. As a result of the playbook launch, FortiGate will block IP addresses, URLs, or domain names, depending on the action that you specify when creating a playbook.
To unblock IP addresses, URLs, or domain names that have been blocked, you have to create and launch another playbook.
You can download the script by clicking the following link:
The login, password, and API key to access FortiGate are stored in the env.sample configuration file. You have to copy the information from this file to a new ENV file that you create, and then specify the necessary parameters in the new file.
Python 3.10 is required to run the script.
To perform a response action through FortiGate, you must have one of the following XDR roles: Main administrator, Tenant administrator, Junior analyst, Tier 1 analyst, or Tier 2 analyst.
To launch a script for responding through FortiGate:
- In the main menu, go to the Monitoring & reporting section, and then in the Alerts or Incidents sections, click the ID of the required alert or incident.
- Click the Select playbook button, and then in the window that opens, select the playbook that you created for responding through FortiGate.
- Click the Launch button.
The selected playbook launches the script for responding through FortiGate.
If the operation is completed successfully, an appropriate message is displayed on the screen. Otherwise, an error message is displayed.
The result of the playbook launch is available in the alert or incident details, on the History tab.
Page top
Viewing response history from alert or incident details
After you perform a response action, you can view the response history in one of the following ways:
- From the alert or incident details.
- From the Response history section.
- From a playbook details.
To view the response action history from the alert or incident details:
- In the main menu, go to the Monitoring & reporting section.
- Open the Alerts or Incidents section, and then click the ID of the alert or incident for which the response action was performed.
- In the window that opens, go to the History tab, and then select the Response history tab.
The table of events is displayed and contains the following columns:
- Time. The time when the event occurred.
- Launched by. Name of the user who launched the response action.
- Events. Description of the event.
- Response parameters. Response action parameters that are specified in the response action.
- Asset. Number of the assets for which the response action was launched. You can click the link with the number of the assets to view the asset details.
- Action status. Execution status of the response action. The following values can be shown in this column:
- Awaiting approval—Response action awaiting approval for launch.
- In progress—Response action is in progress.
- Success—Response action is completed without errors or warnings.
- Warning—Response action is completed with warnings.
- Error—Response action is completed with errors.
- Terminated—Response action is completed because the user interrupted the execution.
- Approval time expired—Response action is completed because the approval time for the launch has expired.
- Rejected—Response action is completed because the user rejected the launch.
- Playbook. Name of the playbook in which the response action was launched. You can click the link to view the playbook details.
- Response action. Name of the response action that was performed.
- Asset type. Type of asset for which the response action was launched. Possible values: Device or User.
- Asset tenant. The tenant that is the owner of the asset for which the response action was launched.
- If necessary, click the settings icon (
 ), and then select the columns to be displayed in the table.
 - If necessary, click the filter icon (), and then in the window that opens, specify and apply the filter criterion:
- Add a new filter by clicking the Add filter button.
- Edit a filter by selecting necessary values in the following fields:
- Property
- Condition
- Value
- Delete a filter.
- Delete all filters by clicking the Reset all button.
Playbooks
Open Single Management Platform uses playbooks that allow you to automate workflows and reduce the time it takes to process alerts and incidents.
Playbooks respond to alerts or incidents according to the specified algorithm. Playbook launches an algorithm that includes a sequence of response actions that help analyze and handle alerts or incidents. You can launch the playbook manually or configure the automatic launch of the playbook you need.
The automatic launch of playbooks is performed according to the trigger that you configure when creating a playbook. A trigger defines the conditions that an alert or incident must meet to launch this playbook automatically.
One playbook scope is limited to only alerts or only incidents.
Note that the playbook can only belong to one tenant and it is automatically inherited by all child tenants of the parent tenant, including child tenants that will be added after the playbook is created. You can disable playbook inheritance by child tenants when creating or editing a playbook.
In Open Single Management Platform, there are two types of playbooks:
- Predefined playbooks
Predefined playbooks are created by Kaspersky experts. These playbooks are marked with the [KL] prefix in the name and cannot be edited or deleted.
By default, predefined playbooks operate in the Training operation mode. For more information, refer to the Predefined playbooks section.
- Custom playbooks
You can create and configure playbooks yourself. When creating a custom playbook, you need to specify a playbook scope (alert or incident), a trigger for launching the playbook automatically, and an algorithm for responding to threats. For details about creating a playbook, see Creating playbooks.
Operation modes
You can configure both automatic and manual launch of playbooks. The way to launch the playbook depends on the selected operation mode.
These are the following types of operation modes:
- Auto. A playbook in this operation mode automatically launches when corresponding alerts or incidents are detected.
- Training. When corresponding alerts or incidents are detected, a playbook in this operation mode requests the user's approval to launch.
- Manual. A playbook in this operation mode can only be launched manually.
User roles
You grant user rights to manage playbooks by assigning user roles to the users.
The table below shows access rights for managing playbooks and performing the user actions.
User role |
User right |
||||
|---|---|---|---|---|---|
Read |
Write |
Delete |
Execute |
Response confirmation |
|
Main administrator |
|
|
|
|
|
SOC administrator |
|
|
|
|
|
Junior analyst |
|
|
|
|
|
Tier 1 analyst |
|
|
|
|
|
Tier 2 analyst |
|
|
|
|
|
SOC manager |
|
|
|
|
|
Approver |
|
|
|
|
|
Observer |
|
|
|
|
|
Tenant administrator |
|
|
|
|
|
Viewing the playbooks table
The playbooks table is displayed in the Monitoring & reporting → Playbooks section. By default, the table displays the playbooks related to all of the tenants to which you have access rights.
The playbooks table displays all existing playbooks, except for playbooks with the Deleted operation mode.
To configure the playbooks table, do any of the following:
- Apply tenant filter:
- Click the link next to the Tenant filter setting.
- The tenant filter opens.
- Select the check boxes next to the required tenants.
- Filter the data of the playbooks table:
- Click the Filter button.
- On the Filters tab, specify and apply the filter criterion in the invoked menu.
- If you want to hide or display a column, click the settings icon (), and then select the necessary column.
The playbooks table is configured and displays the data you need.
The playbooks table contains the following information:
- Name. Name of the custom or predefined playbooks.
The predefined playbooks are marked with the [KL] prefix in the name and cannot be edited or deleted.
- Operation mode. Playbook operation mode that defines the way to launch the playbook. For more details on operation modes, see the Playbooks section.
- Tags. Tags that are assigned to a playbook. You can filter playbooks by using the assigned tags.
- Response actions. Actions that are launched within playbooks.
- Launches. Total number of playbook launches.
- Modified. Date and time of the last edit of the playbook.
- Created. Date and time the playbook was created.
- Availability. Playbook launch availability. Possible values:
- Available. All response actions within the playbook are available to the user.
- Unavailable. There are response actions that cannot be launched by the user.
- Parent tenant. Name of the tenant to which the playbook belongs.
- Description. Playbook description or a comment. By default, this column is hidden.
- Scope. Playbook scope. Possible values: Alert or Incident. By default, this column is hidden.
- Created by. Name of the playbook's creator. By default, this column is hidden.
- Updated by. Name of the user who edited the playbook. By default, this column is hidden.
Creating playbooks
You can create a playbook to automate threat analysis and threat response.
To create a playbook, you must have one of the following roles: Main administrator, SOC administrator, Tier 1 analyst, Tier 2 analyst, Tenant administrator.
Kaspersky Next XDR Expert also allows you to create a new playbook that will meet your needs, based on an existing one. For details, refer to Customizing playbooks.
To create a new playbook:
- In the main menu, go to Monitoring & reporting → Playbooks.
- Click the Create playbook button.
The Create playbook window opens.
- In the Tenant field, select a parent tenant and child tenants for which the playbook should be launched.
All child tenants of the selected parent tenant will automatically inherit this playbook. To disable the playbook inheritance, clear the check box next to any child tenants. The playbook inheritance will be disabled for all child tenants.
If you select a child tenant, all parent tenants will be selected automatically.
- In the Name field, enter the playbook name.
Note that the playbook name must be unique and cannot be more than 255 characters long.
The playbook name must not contain the following special characters: < > ".
- If necessary, in the Tags field, specify up to 30 tags. You can filter playbooks by using the assigned tags.
Note that the maximum tag length is 50 characters.
- If necessary, in the Description field, enter a playbook description or a comment.
- In the Scope list, select one of the following options:
- Alert. The playbook will be launched only for alerts.
- Incident. The playbook will be launched only for incidents.
- In the Operation mode list, select one of the following options:
- Auto. A playbook in this operation mode automatically launches when corresponding alerts or incidents are detected.
- Training. When corresponding alerts or incidents are detected, a playbook in this operation mode requests the user's approval to launch.
- Manual. A playbook in this operation mode can only be launched manually.
- In the Launching rule list, choose an action to perform if two or more playbook instances are launching at the same time:
- Add new playbook instances to the queue. A new playbook instance will be launched after the current one is completed. By default, this action is selected.
- Terminate current execution and launch a new instance. The execution of the current playbook instance will be terminated. After that, a new playbook instance is launched.
- Do not launch new playbook instances. A new playbook instance will not be launched. The execution of the current playbook instance will continue.
The Launching rule list is displayed only if the Auto operation mode is selected.
- In the Trigger section, specify the condition for the automatic launch of the playbook.
To describe the trigger condition, use jq expressions. For more information about jq expressions, refer to jq Manual.
Depending on the option you select in the Scope list when creating or editing a playbook, alert data model or incident data model is used.
For example, to filter alerts or incidents by critical severity, specify the following expression:
.Severity == "critical"You can also specify complex expressions to filter alerts or incidents.
For example, to filter critical alerts or incidents by rule name, specify the following expression:
[(.Severity == "critical") and (.Rules[] |.Name | contains("Rule_1"))]where
Rules[] |.Namedefines the name of the triggered rule.Validation of jq expressions is configured. If you specify an incorrect expression in the Trigger section, the error is marked in red. If you want to view the details, hover the mouse cursor over the error.
If you select the Manual operation mode, the Trigger section is unavailable.
- To view alerts or incidents that match the playbook trigger, in the Trigger matching section, click the Find button.
You can also request a full list of alerts or incidents. To do this, in the Trigger section, enter
true, and then click the Find button.The full list of alerts or incidents is displayed.
- In the Algorithm section, specify the sequence of responses to alerts or incidents in the JSON format. For details, refer to the Playbook algorithm section.
If necessary, you can copy an algorithm from another playbook. To do this, do the following:
- Click the Copy from another playbook button.
The Copy from another playbook window opens.
- In the list of playbooks, select a playbook from which to copy the algorithm, and then click the Add button.
The algorithm of the selected playbook is added to the Algorithm section.
Validation of jq expressions and JSON syntax is configured. If you specify an incorrect expression in the Algorithm section, the error is marked in red. If you want to view the details, hover the mouse cursor over the error.
- Click the Copy from another playbook button.
- By default, the playbook will only be launched for new alerts or incidents that match the trigger.
If you want to launch a new playbook for existing alerts or incidents that match the trigger, select the Launch the playbook for all matching alerts or incidents. Note that the system may be overloaded check box.
- Click the Create button.
A new playbook is created and displayed in the list of playbooks.
Page top
Editing playbooks
To edit a playbook, you must have one of the following roles: Main administrator, SOC administrator, Tier 1 analyst, Tier 2 analyst, Tenant administrator.
For predefined playbooks, you can only change the playbook mode and launching rule. You can also view alerts or incidents that match the predefined playbook.
To edit a playbook:
- In the main menu, go to Monitoring & reporting → Playbooks.
- Do one of the following:
- Click the name of the playbook that you want to edit. In the Playbook details window that opens, click the Edit button.
- Select the playbook from the list, and then click the Edit button.
The Edit playbook window opens.
- Edit the playbook's properties. For more details on the playbook properties that you can edit, see Creating playbooks.
- If you changed the operation mode to Auto or Training, in the Running instances list, choose an action to apply to launching playbook instances:
- Terminate instances that are in progress or awaiting approval.
- Terminate only the instances that are awaiting approval.
- Execute all instances that are in progress or awaiting approval.
- Click the Save button.
The playbook's properties are modified and saved.
Page top
Customizing playbooks
You can customize any playbook to your needs.
To customize playbooks:
- In the main menu, go to Monitoring & reporting → Playbooks.
- Open the playbook for editing by doing one of the following:
- Click the name of the playbook that you want to customize. In the playbook details window that opens, click the Duplicate and edit button.
- Select the playbook from the list, and then click the Duplicate and edit button.
The Edit playbook window opens.
- Configure the playbook's properties according to your needs.
For more details on the playbook's properties that you can edit, refer to Creating playbooks.
If you want to customize the playbook algorithm parameters, refer to Playbook algorithm.
The name of the customized playbook must be unique.
- Click the Save button.
The customized playbook is modified and saved.
Page top
Viewing playbook properties
Playbooks allow you to automate workflows and reduce the time it takes to process alerts and incidents.
To view a playbook, you must have one of the following roles: Main administrator, SOC administrator, Junior analyst, Tier 1 analyst, Tier 2 analyst, SOC manager, Approver, Observer, Tenant administrator.
To view a playbook's properties:
- In the main menu, go to Monitoring & reporting → Playbooks.
- In the list of playbooks, click the name of the playbook that you want to view.
The Playbook details window opens.
- Switch between tabs to get information about the playbook.
General
The General tab contains the following information about the playbook:
- Tenant. Name of the tenant to which the playbook belongs.
- Tags. Tags assigned to the playbook.
- Description. Playbook description.
- Scope. Playbook scope. Possible values: Alert or Incident.
- Created. Date and time the playbook was created.
- Modified. Date and time of the last edit of the playbook.
- Trigger. Description of alerts or incidents that trigger the playbook. The trigger is described by using jq expressions.
- Algorithm. Description of response actions that are launched during the playbook execution. The algorithm is described by using JSON.
You can edit the playbook's properties by clicking the Edit button.
History
The History tab contains a table that lists all playbooks or response actions launched within the playbook. On this tab, you can view response history and terminate the launched playbooks or response actions by clicking the Terminate button. You can also view response history from the Response history section or from alert or incident details.
You can group and filter the data in the table as follows:
- Click the settings icon (), and then select the columns to be displayed in the table.
- Click the filter icon (), and then specify and apply the filter criterion in the invoked menu.
When you apply the filter criterion for the Action status column, the table displays the manually launched responses whose status contains the selected value and the playbooks that include response actions whose status contains the selected value. It means that only the response actions of the playbook that meet the filter criterion will be displayed.
The filtered table of devices is displayed.
The table contains the following columns:
- Actions. Response action name.
- Response parameters. Response action parameters that are specified in the playbook algorithm.
- Start. Date and time the playbook or response action was launched.
- End. Date and time the playbook or response action was completed.
- Alert ID or Incident ID. ID that contains a link to the alert or incident details.
- Launched by. Name of the user who launched the playbook or response action.
- Approver. Name of the user who approved the launch of the playbook or response action.
By default, this column is hidden. To display the column, click the settings icon (
), and then select the Approver column. - Approval time. Date and time when the user confirmed or rejected the launch of the playbook or response action.
By default, this column is hidden. To display the column, click the settings icon (
), and then select the Approval time column. - Action status. Execution status of the playbook or response action. The following values can be shown in this column:
- Awaiting approval—Response action or playbook awaiting approval for launch.
- In progress—Response action or playbook is in progress.
- Success—Response action or playbook is completed without errors or warnings.
- Warning—Response action or playbook is completed with warnings.
- Error—Response action or playbook is completed with errors.
- Terminated—Response action or playbook is completed because the user interrupted the execution.
- Approval time expired—Response action or playbook is completed because the approval time for the launch has expired.
- Rejected—Response action or playbook is completed because the user rejected the launch.
- Playbook status. Execution status of the playbook. The following values can be shown in this column:
- Awaiting approval—Playbook awaiting approval for launch.
- In progress—Playbook is in progress.
- Success—Playbook is completed without errors or warnings.
- Warning—Playbook is completed with warnings.
- Error—Playbook is completed with errors.
- Terminated—Playbook is completed because the user interrupted the execution.
- Approval time expired—Playbook is completed because the approval time for the launch has expired.
- Rejected—Playbook is completed because the user rejected the launch.
You can click the Playbook status value or the Action status value to open the window with the result of the playbook or the response action launch. The Launch ID can be used by Technical Support. If the status is In progress, you can view the Launch ID by hovering the mouse cursor over the icon next to the status.
- Assets. Number of the assets for which the playbook or response action is launched. You can click the link with the number of the assets to view the asset details. The field is empty, if the playbook or response action does not involve assets.
Changelog
The Changelog tab contains the history of playbook editing, including time, author, and description.
Page top
Terminating playbooks
You can forcibly terminate the launched playbook. In this case, the uncompleted response actions will be terminated. The completed response actions will not be canceled after the termination of the playbook.
To terminate a playbook, you must have one of the following roles: Main administrator, Junior analyst, Tier 1 analyst, Tier 2 analyst, Tenant administrator.
To terminate a playbook:
- In the main menu, go to Monitoring & reporting → Playbooks.
- In the Playbook details window that opens, go to the History tab.
- In the list of the launched playbook instances, select one or several instances that you want to terminate, and then click the Terminate button.
- In the window that opens, click Terminate.
The playbook is terminated.
Page top
Deleting playbooks
Predefined playbooks cannot be deleted.
To delete a custom playbook, you must have one of the following roles: Main administrator, SOC administrator, Tier 1 analyst, Tier 2 analyst, Tenant administrator.
To delete a custom playbook:
- In the main menu, go to Monitoring & reporting → Playbooks.
- Do one of the following:
- Click the name of the playbook that you want to delete. In the Playbook details window that opens, click the Delete button.
- Select the playbook from the list, and then click the Delete button.
- In the confirmation dialog box, click Delete.
The playbook cannot be deleted if there are launched playbook instances. In this case, terminate all launched instances before deleting the playbook.
Deleted playbooks will only be available for viewing and copying in the Playbooks section.
Page top
Launching playbooks and response actions
Launching playbooks
Depending on your needs, you can configure the way to launch the playbook. You can select one of the following operation modes during the playbook creation:
- Auto. Select this operation mode if you want to automate the launch of playbook and response actions.
Playbooks in this mode help automate threat response, and also reduce the time it takes to analyze alerts and incidents.
- Training. Select this operation mode if you want to check if the playbook is configured correctly.
Playbooks in this mode will not be launched automatically when a corresponding alert or incident is detected. Instead, the playbook requests the user's approval to launch.
- Manual. Select this operation mode if you want to launch the playbook manually only.
Playbooks in this mode have no trigger, so you can launch such playbooks for any alert or incident, depending on the selected playbook scope. For more details, see Launching playbooks manually.
You can also change the operation mode of the existing playbook. For more details, see Editing playbooks.
Launching response actions
Response actions can be launched manually, automatically within a playbook, or can be configured to request the user's approval before launching within the playbook. By default, manual approval of the response action is disabled.
For more details on how to configure the manual approval of a response action launched within the playbook, see Configuring manual approval of response actions.
Launching playbooks manually
Kaspersky Next XDR Expert allows you to manually launch any playbook that matches alerts or incidents you want to respond to.
To launch a playbook manually, you must have one of the following roles: Main administrator, Junior analyst, Tier 1 analyst, Tier 2 analyst, Tenant administrator.
You can also launch a playbook for observables and assets if you have specified these objects when creating the playbook and when launching it.
Launching a playbook for an alert
To launch a playbook manually for an alert:
- In the main menu, go to Monitoring & reporting → Alerts.
- In the table of alerts, click the link with the ID of the alert for which you want to launch the playbook.
- In the Alert details window that opens, click the Select playbook button.
The Select playbook window opens.
- In the list of playbooks that match the alert, select the playbook you want to launch, and then click the Launch button.
If the selected playbook is already running for this alert, in the Monitoring & reporting window that appears, do one of the following:
- If you want to wait until the current playbook instance is completed, click the Wait and launch button.
The new playbook instance will be launched after the current one is completed.
- If you want to launch a new playbook instance immediately, click the Terminate and launch a new one button.
The current playbook instance will be terminated and the new one will be launched.
- If you want to cancel the new playbook launch, click the Close button (
 ).
).
If the selected playbook already has the status Awaiting approval, after manual launch, the playbook status will change to In progress.
- If you want to wait until the current playbook instance is completed, click the Wait and launch button.
The playbook is launched for the selected alert. After the playbook is completed, you will receive a notification.
Launching a playbook for an incident
To launch a playbook manually for an incident:
- In the main menu, go to Monitoring & reporting → Incidents, and then select the XDR incidents tab.
- In the table of incidents, click the link with the ID of the incident for which you want to launch the playbook.
- In the Incident details window that opens, click the Select playbook button.
The Select playbook window opens.
- In the list of playbooks that match the incident, select the playbook you want to launch, and then click the Launch button.
If the selected playbook is already running for this incident, in the Monitoring & reporting window that appears, do one of the following:
- If you want to wait until the current playbook instance is completed, click the Wait and launch button.
The new playbook instance will be launched after the current one is completed.
- If you want to launch a new playbook instance immediately, click the Terminate and launch a new one button.
The current playbook instance will be terminated and the new one will be launched.
- If you want to cancel the new playbook launch, click the Close button ().
If the selected playbook already has the status Awaiting approval, after manual launch, the playbook status will change to In progress.
- If you want to wait until the current playbook instance is completed, click the Wait and launch button.
The playbook is launched for the selected incident. After the playbook is completed, you will receive a notification.
Page top
Launching playbooks for objects specified by users
You can specify observables and assets for which a playbook must run. You have to create a playbook with the following settings:
- In the Scope list, select Alert or Incident.
- In the Operation mode list, select Manual.
- In the Algorithm section, when setting a response action, use jq expressions to specify the objects (observables or assets) for which you want the playbook to launch. These objects will be the input to the playbook when it is launched.
If you do not specify the objects in the playbook algorithm and only select them before launching the playbook, these objects will be ignored.
After the playbook is created, you can launch it for the selected objects.
To do this, you must have one of the following XDR roles: Main administrator, Junior analyst, Tier 1 analyst, Tier 2 analyst, or Tenant administrator.
To launch a playbook for the selected objects:
- In the main menu, go to the Monitoring & reporting section, and then in the Alerts or Incidents section, click the ID of the alert or incident from which you want to launch the playbook.
- In the details window that opens, click the Select playbook button.
The Select playbook window opens.
- Select the Select target objects before launching the playbook option, and then click the Launch button.
- In the Target objects window that opens, select the objects from the Observables and Assets tabs for which you want to launch the playbook, and then click the Apply and launch button.
The playbook is launched for the objects you selected.
You can view the result of the playbook from the History tab in the alert or incident details, from the playbook History tab, and from the Response history section.
For example, you write a script that is called during the executeCustomScript response action. When creating a playbook, in the Algorithm section, you write the executeCustomScript response action with the playbook input data. Then, you have to run the script for an observable with an IP type that you select when launching the playbook. The script uses the IP address that you selected as a parameter:
{
"dslSpecVersion": "1.1.0",
"version": "1",
"actionSpecVersion": "1",
"executionFlow": [
{
"action": {
"function": {
"type": "executeCustomScript",
"params": {
"commandLine": "./script.py",
"commandLineParameters": "${ \"-ip \" + ([.input.observables[] | select(.type == \"ip\")] | map(.value) | join(\",\")) }",
"workingDirectory": "/folder/with/script"
}
},
"onError": "stop"
}
},
{
"action": {
"function": {
"type": "updateBases",
"params": {
"wait": false
},
"assets": "${ [.input.assets[] | select(.Type == \"host\") | .ID] }"
}
}
}
]
}
Several objects will be an input to the playbook, and the list of IP addresses separated with commas must be an input to the script:
{
"input": {
"observables": [
{
"type": "ip",
"value": "127.0.0.1"
},
{
"type": "ip",
"value": "127.0.0.2"
},
{
"type": "md5",
"value": "29f975b01f762f1a6d2fe1b33b8e3e6e"
}
],
"assets":[
{
"AttackerOrVictim": "unknown",
"ID": "c13a6983-0c40-4986-ab30-e85e49f98114",
"InternalID": "6d831b04-00c2-44f4-b9e3-f7a720643fb7",
"KSCServer": "E5DE6B73D962B18E849DC0BF5A2BA72D",
"Name": "VIM-W10-64-01",
"Type": "host"
}
]
}
After jq expressions perform calculations on the playbook operational data, the following information is passed as command line parameters:
-ip 127.0.0.1,127.0.0.2
For a playbook expecting input data, if you specified different types of objects when creating the playbook and when launching it, or if you did not select the Select target objects before launching the playbook option, the playbook will finish with one of the following results:
- An error will occur because the playbook did not receive input data.
- The action will not be performed because the playbook contains a condition or a loop that is based on the input data.
- The result will depend on the response of the application, or service, or script that performs the action.
Launching playbooks in the Training operation mode
The Training operation mode allows you to check if the playbook is configured correctly. This can be helpful if you are planning to change the playbook operation mode to Auto.
All playbooks in the Training operation mode request the user's approval to launch.
To launch a playbook in the Training operation mode, you must have one of the following roles: Main administrator, Junior analyst, Tier 1 analyst, Tier 2 analyst, Tenant administrator.
The playbook in the Training operation mode cannot be launched automatically when a triggering alert or incident is detected. You can test launching the playbook in the Training operation mode in one of the following ways:
- Create an alert or incident that matches the playbook trigger.
- Edit an alert or incident that matches the playbook trigger. The alert or incident must be in a status other than Closed.
When one of the above actions is completed, the playbook requests the user's approval to launch. For more information on how to approve the playbook, see Approving playbooks or response actions.
Page top
Configuring manual approval of response actions
Kaspersky Next XDR Expert allows you to configure manual approval of a response action launched within a custom playbook. By default, manual approval of the response action is disabled.
Before configuring manual approval, make sure that email notifications for tenants are configured and the email address of the approver is specified.
We recommend that you configure manual approval of the following response actions: moving devices to another administration group, moving files to quarantine, enabling and disabling network isolation, responding on accounts through Active Directory, and data enrichment.
To configure manual approval of a response action:
- In the main menu, go to Monitoring & reporting → Playbooks.
- Open the playbook for editing by doing one of the following:
- Click the name of the playbook that you want to edit. In the Playbook details window that opens, click the Edit button.
- Select the playbook from the list, and then click the Edit button.
If you select more than one playbook, the Edit button will be disabled.
The Edit playbook window opens.
- In the Algorithm section, specify one of the following parameters for the response action for which you want to enable the manual approval:
- To enable the manual approval of a response action with the default approval time, specify the following parameter:"manualApprove": true
By default, the approval time is 60 minutes.
- To enable the manual approval of a response action with an adjustable approval time, specify the following parameter:"manualApprove": {"timeout": "period"}
where
"period"is an adjustable approval time.You can configure the approval time in hours (h) and/or minutes (m), for example:
"manualApprove": {"timeout": "20h"} "manualApprove": {"timeout": "2h30m"} - To enable the manual approval of a response action with notifications sent to the email address of the approver, specify the following parameter:"emailNotifications": { "enabled":true }
- To enable the manual approval of a response action with a notification that is sent to the email address of the approver after a certain period, specify the following parameter:"manualApprove": { "emailNotifications": { "enabled": true, "delay": "period" }
where
"period"is an adjustable sending time.You can configure the sending time in minutes (m), for example:
"delay": "20m"
- To enable the manual approval of a response action with the default approval time, specify the following parameter:
- Click the Save button.
Manual approval of a response action is configured. Email notifications with a request to approve the response action will be sent to the email specified in the user account properties.
You can view requests for approval of response actions in the Approval requests section.
Page top
Approving playbooks or response actions
All playbooks in the Training operation mode require a user's approval. You can also configure manual approval of response actions launched within the playbook.
To approve or reject a playbook launch, you must have one of the following roles: Main administrator, Junior analyst, Tier 1 analyst, Tier 2 analyst, Tenant administrator.
To approve or reject a response action launch, you must have one of the following roles: Main administrator, Approver, Tenant administrator.
If there are playbooks or response actions that are awaiting a user's approval, a notification appears at the top of the Open Single Management Platform Console. Additionally, if the user's approval is required for the response action launch, an email notification is sent to the email address within the time period specified in the algorithm of the playbook.
Viewing the list of playbooks and response actions
To view the list of playbooks and response actions that are awaiting approval, do one of the following:
- Click the View approval requests link at the top of the Open Single Management Platform Console.
- Follow the link in the notification that is sent to your email address.
The Approval requests pane with the table that contains the full list of approval requests opens.
The Approval requests table contains the following columns:
- Time. Date and time when a playbook or a response action requested a user's approval.
- Approval due date. Date and time by which the user must approve or reject the playbook or the response action. If the user has not approved the playbook or the response action by this time, the launch is canceled.
- Playbook. Name of a custom or predefined playbook that requests a user's approval.
- Response action. Actions that are launched within playbooks.
- Assets. Number of the assets for which the playbook or response action is launched. You can view the list of assets for which the user's approval is requested by clicking the link with the number of the assets.
- Response parameters. Response action parameters that are specified in the response action or playbook algorithm.
- Alert or incident ID. ID that contains a link to the alert or incident details.
Approving and rejecting playbooks
To approve or reject playbooks:
- In the notification at the top of Open Single Management Platform Console, click the View approval requests link.
A notification with the View approval requests link is displayed only if there is a playbook that is waiting for a user's approval.
- In the Approval requests pane that opens, select one or more playbooks, and then do one of the following:
- To approve the launching of a playbook, click the Approve button.
After that, the playbook is launched. The action status in the Response history sections changes to In progress.
- To decline the launching of a playbook, click the Reject button.
After that, the launching of the playbook is canceled. The action status in the Response history sections changes to Rejected.
- To approve the launching of a playbook, click the Approve button.
- Click the Close button () to close the Approval requests pane.
After approving or rejecting playbooks, you can view their statuses in the Response history section.
Approving and rejecting response actions
To approve or reject response actions:
- In the notification at the top of Open Single Management Platform Console, click the View approval requests link.
A notification with the View approval requests link is displayed only if there is a response action that is waiting for a user's approval.
The Approval requests pane opens.
- In the Approval requests pane that opens, in the Assets column, click the link with the number of assets.
The Assets to approve pane that contains the full list of assets opens.
- Check the list of assets for which the manual approval is required, and then do one of the following:
- To approve the launch of a response action for assets, select one or more assets you need, and then click the Approve button. After that, the response action for the selected assets is launched.
- To decline the launch of a response action for assets, select one or more assets you need, and then click the Reject button. After that, the launch of the response action for the selected assets is canceled.
- Click the Close button () to close the Assets to approve pane.
- Click the Close button () to close the Approval requests pane.
After approving or rejecting response actions, you can view their statuses in the Response history section.
Page top
Enrichment from playbook
After you configure integration between Kaspersky Next XDR Expert and Kaspersky TIP, you can obtain information about the reputation of observables related to an alert or incident from Kaspersky TIP or Kaspersky OpenTIP, and then enrich the obtained data.
You can obtain information only for observables with the following types: domain, URL, IP, MD5, SHA256.
You can configure data enrichment to run automatically. To do this, when creating or editing a playbook, in the Algorithm section you must specify the following:
- Data source.
You can specify one of the following services:
- TIP—Kaspersky Threat Intelligence Portal (General access)
- OpenTIP—Kaspersky Threat Intelligence Portal (Premium access)
- Limit for data returned by Kaspersky TIP or Kaspersky OpenTIP, if necessary.
You can specify one of the following values:
- All records
- Top100
This value is set by default.
- Observable for which the playbook requests data from Kaspersky TIP or Kaspersky OpenTIP.
In the playbook algorithm, you can use the output enrichment parameters that are displayed in the fields that Kaspersky TIP returns.
You can view the enrichment result for all observables related to an alert or incident in one of the following ways:
- From the alert or incident details
- From a response history
- From a playbook
To view an enrichment result:
- In the main menu, go to the Monitoring & reporting section, and then do one of the following:
- If you want to view the result from an alert or incident details, go to the Alerts or Incidents section, and then click the ID of the alert or incident for which the enrichment was performed. In the window that opens, go to the History tab, and then select the Response history tab.
- If you want to view the result from a response history, go to the Response history section.
- If you want to view the result from a playbook, go to the Playbooks section, and then click the name of the playbook for which the enrichment was performed. In the window that opens, go to the History tab.
- In the Action status column, click the status of the playbook for which you want to view the enrichment result.
You can also obtain the information from Kaspersky TIP, and then enrich data manually on the Observables tab in alert or incident details.
Page top
Viewing response history
The Response history section allows you to view the detailed response history for all detected alerts and incidents. Note that if an alert or incident is deleted, the response history for this alert or incident is not displayed.
To view a response history, you must have one of the following roles: Main administrator, Junior analyst, Tier 1 analyst, Tier 2 analyst, SOC manager, Approver, Observer, Tenant administrator.
To view a response history, in the main menu, go to Monitoring & reporting → Response history. The table that contains the response history for all alerts and incidents opens.
By default, the table is sorted according to the time the playbook or response action was launched. The response actions in the playbooks are sorted according to their order in the playbook algorithm.
The toolbar in the upper part of the table allows you group and filter the data in the table as follows:
- Click the settings icon (), and then select the columns to be displayed in the table.
- Click the filter icon (), and then specify and apply the filter criterion in the invoked menu.
When you apply the filter criterion for the Action status column, the table displays the manually launched responses whose status contains the selected value and the playbooks that include the response actions whose status contains the selected value. It means that only the response actions of the playbook that meet the filter criterion will be displayed.
The table contains the following columns:
- Actions. Response action or playbook name.
- Response parameters. Response action parameters that are specified in the response action or playbook algorithm.
- Start. Date and time the playbook or response action was launched.
- End. Date and time the playbook or response action was completed.
- Alert or incident ID. ID that contains a link to the alert or incident details.
- Launched by. Name of the user who launched the playbook or response action.
- Action status. Execution status of the response action. The following values can be shown in this column:
- Awaiting approval—Response action awaiting approval for launch.
- In progress—Response action is in progress.
- Success—Response action is completed without errors or warnings.
- Warning—Response action is completed with warnings.
- Error—Response action is completed with errors.
- Terminated—Response action is completed because the user interrupted the execution.
- Approval time expired—Response action is completed because the approval time for the launch has expired.
- Rejected—Response action is completed because the user rejected the launch.
- Playbook status. Execution status of the playbook. The following values can be shown in this column:
- Awaiting approval—Playbook awaiting approval for launch.
- In progress—Playbook is in progress.
- Success—Playbook is completed without errors or warnings.
- Warning—Playbook is completed with warnings.
- Error—Playbook is completed with errors.
- Terminated—Playbook is completed because the user interrupted the execution.
- Approval time expired—Playbook is completed because the approval time for the launch has expired.
- Rejected—Playbook is completed because the user rejected the launch.
You can click the Playbook status value or the Action status value to open the window with the result of the playbook or the response action launch. The Launch ID can be used by Technical Support. If the status is In progress, you can view the Launch ID by hovering the mouse cursor over the icon next to the status.
- Assets. Number of the assets for which the playbook or response action is launched. You can click the link with the number of the assets to view the asset details. The field is empty, if the playbook or response action does not involve assets.
- Tenant. Name of the tenant to which the playbook belongs.
- Approver. Name of the user who approved or rejected the playbook or response action launch.
By default, this column is hidden. To display the column, click the settings icon (
), and then select the Approver column. - Approval time. Date and time the playbook or response action launch was approved or rejected. This column is not displayed by default.
By default, this column is hidden. To display the column, click the settings icon (
), and then select the Approval time column.
Predefined playbooks
Kaspersky Next XDR Expert provides ready-to-use predefined playbooks that are created by Kaspersky experts. Predefined playbooks are based on KUMA correlation rules. For more information on the KUMA correlation rules included in the distribution kit, see Correlation rules.
You can find predefined playbooks in the Playbooks section. Such playbooks are marked with the tag "Predefined" and the [KL] prefix in the name.
Note that you cannot edit the parameters of a predefined playbook, except for the Operation mode and the Running instances fields. If you want to edit other parameters of a predefined playbook, you need to duplicate the playbook, and then use it as a template to create a custom playbook. For details, refer to Customizing playbooks.
Before using the predefines playbooks, you must do the following in KUMA:
- Configure the enrichment rule settings for the event enrichment with the Event type selected as the Source kind setting. Specify the VictimUserID and AttackerUserID values in the Target field.
- Configure enrichment in KUMA to get Windows Event Log.
Predefined playbooks cannot be deleted.
Predefined playbooks belong to the parent tenant and are inherited by all child tenants.
[KL] P001 "Creation of executable files by office applications"
This playbook contains the Responding through KASAP response action, and can be used only as a template. If you want to launch the playbook, click the Duplicate and edit button. In the Edit playbook window that opens, in the Algorithm section, specify the KASAP group ID for the groupId parameter.
Before using the playbook, you must configure enrichment in KUMA to get Windows Event Log.
By default, the playbook launches the response actions for all users in the alert. If you want the playbook to launch the response actions only for the victim account, you can do the following:
- In KUMA, configure the enrichment rule settings. For the event enrichment that has the Event type selected as the Source kind setting, specify the VictimUserID value in the Target field.
- In the Algorithm section of the playbook, specify
and .IsVictimin the assets parameter, as shown below:"assets": "${[ alert.Assets[] | select(.Type == \"user\" and .IsVictim) | .ID]}".
The [KL] P001 "Creation of executable files by office applications" predefined playbook allows you to prevent an attacker from using office applications, for example, to perform a phishing attack when a user opens an infected document, and then the document creates an executable file and executes it.
The alert that triggers the playbook is created according to the Creation of executable files by office applications correlation rule. This rule helps to detect the creation of files with suspicious extensions such as scripts and executable files on behalf of office applications.
The Trigger section of the playbook contains the following expression:
[.OriginalEvents[] | .ExternalID == "R350"] | any
During execution, this playbook launches the following response actions:
- Responding through Active Directory, and then resetting the passwords of both the attacker and the victim accounts.
If an error occurs during the execution of the response action, the playbook is terminated.
- Responding through KASAP, and then assigning an information security course to the account.
If an error occurs during the execution of the response action, the execution of the playbook will continue.
The Algorithm section of the playbook contains the following sequence of response actions:
{
"dslSpecVersion": "1.1.0",
"version": "1",
"actionSpecVersion": "1",
"executionFlow": [
{
"action": {
"function": {
"type": "resetLDAPPassword",
"assets": "${[ alert.Assets[] | select(.Type == \"user\") | .ID]}"
},
"onError": "stop"
}
},
{
"action": {
"function": {
"type": "assignKasapGroup",
"assets": "${[ alert.Assets[] | select(.Type == \"user\") | .ID]}",
"params": {
"groupId": "SET KASAP GROUP ID"
}
},
"onError": "continue"
}
}
]
}
Page top
[KL] P002 "Windows Event Log was cleared"
By default, this playbook operates in the Manual operation mode. We do not recommend switching this playbook to the Auto or the Training operation mode.
Before using the playbook, you must do the following in KUMA:
- Configure the enrichment rule settings for the event enrichment that has the Event type selected as the Source kind setting. Specify the AttackerUserID value in the Target field.
- Configure enrichment in KUMA to get Windows Event Log.
The [KL] P002 "Windows Event Log was cleared" predefined playbook allows you to prevent an attacker from clearing the Windows Event Log, because the log contains sufficient telemetry for an investigation of the attacker's malicious activity.
The incident that triggers the playbook contains one or several alerts created according to the Windows Event Log was cleared correlation rule. This rule helps to detect when Windows logs are cleared or deleted by using the wevutil utility, the user interface, or PowerShell commands. To enable the creation of the incident, you have to configure segmentation rules.
The Trigger section of the playbook contains the following expression:
[.Alerts[] | .OriginalEvents[] | .ExternalID == "R050"] | any
During execution, this playbook launches the Responding through Active Directory response action, and then blocks the account of the attacker.
If an error occurs during the execution of the response action, the playbook is terminated.
If one or several alerts in the incident are generated by another correlation rule, the playbook does not apply to those alerts.
The Algorithm section of the playbook contains the following sequence of response actions:
{
"dslSpecVersion": "1.1.0",
"version": "1",
"actionSpecVersion": "1",
"executionFlow": [
{
"action": {
"function": {
"type": "blockLDAPAccount",
"assets": "${[ incident.Alerts[] | select(.OriginalEvents[] | .ExternalID == \"R050\") | .Assets[] | select(.Type == \"user\" and .IsAttacker) | .ID]}"
},
"onError": "stop"
}
}
]
}
Page top
[KL] P003 "Suspicious child process from wmiprvse.exe"
Before using the playbook, you must do the following in KUMA:
- Configure the enrichment rule settings for the event enrichment that has the Event type selected as the Source kind setting. Specify the AttackerUserID value in the Target field.
- Configure enrichment in KUMA to get Windows Event Log.
The [KL] P003 "Suspicious child process from wmiprvse.exe" predefined playbook allows you detect pairs of parent and child processes that deviate from the norm and must be viewed as suspicious.
The alert that triggers the playbook is created according to the R297_Suspicious child process from wmiprvse.exe correlation rule. This rule helps to detect the launch of suspicious processes on behalf of wmiprvse.exe.
The Trigger section of the playbook contains the following expression:
[.OriginalEvents[] | .ExternalID == "R297"] | any
During execution, this playbook launches the following response actions:
- Responding through Active Directory, and then blocks the account of the attacker.
- Terminating the process on the device that is registered in the alert.
- Running a malware scan, and then a full scan is performed on the device where the alert is detected.
By default, network drives are not scanned, to avoid overloading the system. If you want to scan the network drives, you have to duplicate this playbook, and then set the
allowScanNetworkDrivesparameter totruein the Algorithm section.
The Algorithm section of the playbook contains the following sequence of response actions:
{
"dslSpecVersion": "1.1.0",
"version": "1",
"actionSpecVersion": "1",
"executionFlow": [
{
"action": {
"function": {
"type": "blockLDAPAccount",
"assets": "${[ alert.Assets[] | select(.Type == \"user\" and .IsAttacker) | .ID]}"
},
"onError": "stop"
}
},
{
"loop": {
"input": "${ [alert.OriginalEvents[] | [select(.DestinationProcessName != null and .DestinationProcessName != \"\")][] | .DestinationProcessName] }",
"onError": "stop",
"steps": [
{
"action": {
"function": {
"type": "killProcess",
"params": {
"path": "${ .[0] }"
},
"assets": "${[ alert.Assets[] | select(.Type == \"host\") | .ID]}"
}
}
}
]
}
},
{
"action": {
"function": {
"type": "avScan",
"params": {
"scope": {
"area": "full",
"allowScanNetworkDrives": false
},
"wait": false
},
"assets": "${[ alert.Assets[] | select(.Type == \"host\") | .ID]}"
},
"onError": "stop"
}
}
]
}
If an error occurs during the execution of any response action, the playbook is terminated.
Page top
Playbook trigger
The playbook trigger is a filter that allows you to select alerts or incidents for which a playbook must be launched. The filter (trigger) is applied to each object (alert or incident) individually and takes a single value: either true or false. A trigger consists of expressions in the jq language that processes structured data in the JSON format. For more information about jq expressions, refer to jq Manual.
In Kaspersky Next XDR Expert, gojq is used. It is an implementation of jq written in the go language, which has the following differences from jq:
- Mathematical functions are implemented in a more convenient way.
- Errors messages have a clear indication of where to fix your query.
- Integer calculations are more accurate.
- Functions that work incorrectly in jq are improved in gojq.
For more information about the differences between gojq and jq, refer to GitHub.
How to write a trigger
You can write a trigger in the Trigger section when creating or editing a playbook.
Depending on the option you select in the Scope list when creating or editing a playbook, alert data model or incident data model is used.
The names of parameters in a playbook trigger must be the same as in the data model. Note that elements of jq expressions are case-sensitive.
To avoid overloading the system, it is not recommended to specify OriginalEvents, Observables, Extra, and Alerts data in the trigger.
When you start writing a trigger, the following suggestions can be displayed:
- Names of functions.
- Special values.
- Fields that are specified as object identifiers in accordance with the data model.
The suitable values are filtered and displayed in the list of suggestions when you start typing. For convenience, some suggestions contain a search string. For example, if you want to specify an incident type ID or incident status ID, you can search the corresponding record by the name, and the ID will be specified in the trigger.
Note that default statuses (New and Closed) have the same ID in different workflows, which means that the trigger will run for all incidents with the specified status ID. To limit the scope of incidents for which the playbook will run, in the trigger you have to specify the incident status ID and the incident type.
The jq language also provides syntax highlighting and validation of jq expressions. If the trigger has invalid expressions, you cannot save the playbook.
When writing a trigger, basic syntax rules are used.
To refer to structure properties, you must use dot "." and specify the attribute, for example:
.MITRETactics[]—To view the array of MITRE tactics associated with all triggered IOA rules in the alert..MITRETactics[0]—To view the first element from the MITRE tactics array.
To refer to child properties, you can either use the pipe (|) or the same combination without the pipe, for example:
.Assignee[0].NameorAssignee[0] | .Name—The expression outputs the name of the user to whom the alert is assigned..MITRETactics[0].IDor.MITRETactics[0] | .ID—The expression outputs the ID of the first MITRE tactic.
To get a value, you have to use the following operators: ==, >, <, >=, <=, !=, for example:
.Assignee[0] | .Name == "user"—The expression returnstrueif the alert is assigned to the user.(.Serverity == "high") and (.DetectSource == "KES")—The expression returnstrueif the alert severity level is high and the source of data is Kaspersky Endpoint Security.[ .DetectionTechnologies[] | . == "IOC" ] | any—The expression returnstrueif the IOC detection technology is triggered..DetectionTechnologies | length > 1—The expression returnstrueif more than one detection technology is triggered.
To enumerate values in an array of objects, you can use the any method, for example:
[.Assets[] | .Name == "W21H2-X64-3160"] | any—The expression filters the alert where any element of theAssetsarray has theW21H2-X64-3160value in theNamefield.[.Observables[] | .Value == "127.0.0.1"] | any—The expression filters the alert where any element of theObservablesarray has the127.0.0.1value in theValuefield.[.Assets[].ID]—To output the array of IDs.[.Assets[] | select(.AttackerOrVictim=="attacker") | .ID]—To display an array of IDs for the assets filtered by theAttackerOrVictimfield.
If you want to reuse calculations, specify a variable with $. For example, the expression event.manual != true as $not_manual | [ .DetectionTechnologies[] | . == "IOC" ] | any and $not_manual defines and uses the $not_manual variable that contains a flag that shows if the change is manual or not.
To work with dates, you can use the following functions:
now—To get the current Unix time in seconds, for example,now == 1690541520.537496.todate—To get the current Unix time in seconds, for example,now | todate == "2023-07-28T10:47:36Z".fromdate—To convert the date to seconds, for example:.CreatedAt | split(".")[0] + "Z"—This command removes milliseconds and converts the string to the 2023-07-15T07:49:51Z format.(.CreatedAt | split(".")[0] + "Z") | fromdate == 1689407391—The conversion to seconds is finished.
Jq uses iterators—an interface that provides access to elements of a collection, for example, an array, and allows you to navigate through them. Iterators are always the result of calculation. The difference is in the number of elements that the iterator contains. In Kaspersky Next XDR Expert, an iterator must have only one element; the other cases are considered an error.
To write a correct trigger, you have to wrap an iterator into square brackets ([ ... ]). For example, the .DetectionTechnologies[] == "IOC" trigger will cause an error because it returns an iterator with two elements. The correct trigger must have the following form: [ .DetectionTechnologies == "IOC" ] | any, where first you have to use [] to wrap the result of the comparison into an array, and then process it with the any method that returns true if at least one element of the array is true. Otherwise, false is returned.
When the trigger runs
The search for a suitable playbook starts when one of the following triggering events occurs:
- New alert/incident is created.
- Any field of an active alert/incident is changed.
- When creating or editing a playbook, the user selected the Launch the playbook for all matching alerts or incidents. Note that the system may be overloaded check box.
The following types of alert change events are supported:
- Assigning or removing an analyst.
- Changing an alert status.
- Changing basic events.
- Linking or unlinking an alert to or from an incident.
- Changing the value in the
ExternalReferencefield.
The following types of incident change events are supported:
- Assigning or removing an analyst.
- Changing an incident status.
- Changing basic events.
- Linking or unlinking an alert to or from an incident.
- Changing an incident name.
- Changing an incident description.
- Changing an incident priority.
- Changing the value in the
ExternalReferencefield. - Merging incidents.
The alert/incident structure does not contain any data about the alert/incident changes. This data is transferred in additional information. If in a playbook trigger you want to refer to the changes, use the event function without arguments.
By default, manual changes to an alert or incident details are ignored. If you want a playbook to launch for manual changes, you have to use the event.manual function in the trigger, for example:
event.manual and ([ event.updateOperations[] | . == "alertReopened" ] | any)—The trigger works only if the alert is manually reopened.[ event.updateOperations[] | . == "alertLinkedWithIncidentBySystem" ] | any—The trigger works only if the alert is automatically linked to an incident.event.manual != null and (([ event.updateOperations[] | . == "alertChangedToNew" ] | any) | not)—The trigger works if the alert status is changed to any status other than New, either manually or automatically.event == null and .Status == "inIncident"—The trigger works for all alerts with the In incident status, but only when the playbook is changed, not the alert.
If necessary, you can test examples of jq expressions, apply filters, and then view the results in the Jq playground service.
Page top
Playbook algorithm
Kaspersky Next XDR Expert allows you to respond to alerts and incidents manually or automatically by using playbooks. Responding to alerts or incidents may consist not of a single action, but of a whole set of steps and parameters. These steps depend on the specified conditions, the alert or incident data, and the results of previous response actions.
The playbook algorithm allows you to specify the sequence of response actions, the necessary conditions, and the required impact on the target objects, in the JSON format. The playbook algorithm steps are performed sequentially. You can specify the playbook algorithm when creating or editing a playbook.
After launch, the playbook obtains all the alert or incident data, and places them in global data. The playbook uses the following data:
- Global data
Global data is readable at any step of the playbook. Global data contains information about the alert or incident for which the playbook was launched.
You cannot edit global data by using a playbook, or by changing alert or incident data. Global data remains unchanged for the entire lifetime of the playbook instance.
- Operational data
Operational data is transferred between the steps of the playbook. You can manage operational data by using jq expressions, which are specified in the
inputandoutputparameters. - Local data
Local data is limited to a specific step. You can manage local data by using the
input(local data generation) andoutput(generation of operational data from local data) parameters.
How to write an algorithm
The playbook algorithm is written in the JSON format and consists of two main parts:
- General information on the playbook:
- Name (
name) - Description (
description) - Scope (
inputType) - Transformation of the input data of the playbook (
input) - Transformation of the output data of the playbook (
output) - Playbook execution timeout (
playbookRunTimeout) - Timeout policies that can be applied at specific steps (
timeouts) - Playbook version (
version) - DSL schema version (
dslSpecVersion) - Response action schema version (
actionsSpecVersion)
- Name (
- Playbook execution steps (
executionFlow).
The following parameters are required when writing the algorithm:
dslSpecVersion. The required value: 1.1.0.actionsSpecVersionversionexecutionFlow(at least one execution step)Each execution step has its own required fields.
If you try to save a playbook without filling in the required fields, an error will appear.
The playbook algorithm is case-sensitive. To use the asset data of the alert, you need to capitalize the Assets parameter. For example: alert.Assets[]. However, to use asset data in the input data when manually launching the playbook for target objects, do not capitalize the assets parameter. For example: .input.assets[].
Depending on the scope you selected when creating or editing a playbook, you can use the alert data model or incident data model in expressions written in the jq language. To do that, write expressions with an alert or incident value (do not use dot "." at the beginning of the value). For example:
"${[ alert.Assets[] | select(.Type == \"user\" and .IsAttacker) | .ID]}"
You can use alert or incident data in a jq expression at any execution step. The alert or incident data is only available in read mode. This data does not change during the operation of the playbook. If alert or incident data has changed after launching the playbook, it will not affect the playbook execution.
You also can use the jq expressions when using the playbook data in the algorithm. For more information about jq expressions, refer to jq Manual.
If you use quotation marks in the jq expression, you need to escape these marks with backslashes. For example: "${[ alert.Assets[] | select(.Type == \"user\" and .IsAttacker) | .ID]}".
Backslashes that are not used to escape quotation marks must also be escaped by other backslashes. For example: ${\"add_firewall_rule --ip_address=\" + ([.input.observables[] | select(.type == \"ip\") | select(.value | test(\"^(10\\\\.|172\\\\.(1[6-9]|2[0-9]|3[01])\\\\.|192\\\\.168\\\\.|127\\\\.).*\") | not) | .value] | join(\",\"))}.
If you want to launch the playbook for the specific object (observables or assets), use the .input parameter in the algorithm. These objects will be the input to the playbook when it is launched. For example:
"assets": "${ [.input.assets[] | select(.Type == \"host\") | .ID] }"
For details, refer to Launching playbooks for objects specified by users.
How to call hints
If you need a hint on the available fields when writing the algorithm, use quotation marks (""). A list of available fields appears.
To display hints on the alert or incident data,
in the jq expression, write alert or incident and include a dot "." at the end.
The correct hint appears if there are no errors in the above expressions. Otherwise, the list of available fields may be incorrect.
How to call suggestions
You can call suggestions when writing the playbook algorithm. The suggestions contain a search string and help you specify the field value quickly. To view the suggestions, use quotation marks (""). A list of suggestions appears.
The suggestions also allow you to search by name. However, when you select the required value, the name will be automatically changed to an ID in the algorithm. For details, refer to Editing incidents by using playbooks and Editing alerts by using playbooks.
If you select and then delete the parameter name specified between the quotation marks, suggestions for the parameter will not appear, even if you have specified a new parameter between the quotation marks.
To return to the suggestion mode for the parameter, do one of the following:
- Delete the quotation marks, and then add an opening double quotation mark. A closing double quotation mark will be added automatically, and a suggestion will appear.
- Type any character between the quotation marks, and then press Backspace. This will return you to the suggestion mode.
If you delete the parameter name character by character, you will not exit the suggestion mode, even if you delete the parameter name completely.
Example of the playbook algorithm
Playbook parameters
Parameter ID |
Description |
|
Playbook name. Specified by the system when creating or updating a playbook. If the value is set in the algorithm, it will be replaced by the system. |
|
Playbook description. Specified by the system when creating or updating a playbook. If the value is set in the algorithm, it will be replaced by the system. |
|
Playbook version. The minimum length is 1. This parameter is required. |
|
DSL schema version. The minimum length is 1. This parameter is required. |
|
Response actions schema version. The minimum length is 1. This parameter is required. |
|
The maximum execution time of the playbook, including waiting in the queue. The maximum value is 48 hours ( By default, the value is |
|
Inbound object type. The possible values: |
|
A jq expression that could be used to transform or filter incoming data before executing a playbook. |
|
A jq expression that could be used to modify the output of the playbook before execution. |
|
Timeout definitions. |
|
Steps of the playbook execution. This parameter is required. |
Execution step parameters
The array of execution step elements describes a playbook's logic. The execution steps are performed in the order described in the playbook. There are several types of execution steps:
- Action
- Loop
- Parallel
- Decision
- UpdateData
Action parameters
The Action parameters call the response function.
Parameter ID |
Description |
|
An object that defines a response action. For more information, refer to ResponseFunction parameters. |
|
This parameter allows you to filter components to perform a response action. When requested, the component plug-ins are filtered by allowed and restricted components. For example, the parameter can be specified as follows: "filterProduct": {
"allowed": ["PRODUCT_NAME"]
}
|
|
This parameter allows you to edit the value returned by the response action, by using a jq expression and placing it in the playbook data (local or operational). |
|
This parameter allows you to set timeouts for calling the response function. You can specify the name of the timeout policy set in the playbook or set timeout values manually. If the value is not specified, the default timeout is applied. |
|
This parameter allows you to configure a manual approval of a response action. Possible values:
|
|
This parameter defines the behavior when an error occurs during the execution of a response action. Possible values:
By default, the value is Note that, if a system error occurs, the playbook execution completes with an error regardless of the specified value of the |
Timeout policy
The timeout policy of execution steps. The system automatically determines the default timeout policy.
The default timeout policy can be reconfigured by using the default policy name. In this case, the new policy will be automatically applied to all execution steps.
Parameter ID |
Description |
|
Timeout policy name. |
|
The maximum execution time, including waiting in the queue and retries. The parameter is specified in the Go string format. If the value is not specified or 0, the value from the |
Output
The output parameter generates operational data at the end of a step, which will then be transferred to the next step. Specify the output parameter if you want to use the results of the current step of the playbook in the next step.
To avoid overloading the system, it is recommended to limit the data placed in the playbook data (local or operational).
Parameter ID |
Description |
|
This parameter defines whether the playbook data (local or operational) will be overwritten or merged. Possible values:
|
|
This parameter defines the jq expression for processing output data. |
Manual approve
Parameter ID |
Description |
|
The timeout for manual approval in minutes. The minimum value is 10 minutes ( By default, the value is 60 minutes ( |
|
This parameter allows you to configure the sending of email notifications. |
Email notification settings
Parameter ID |
Description |
|
Flag for enabling email notifications. |
|
This parameter defines the delay before sending the email notification. The value is specified in minutes. The minimum value is 5 minutes ( By default, the value is 10 minutes ( |
Loop
Before specifying the Loop parameter, make sure that the aggregate parameter is also specified in the playbook algorithm.
The Loop parameters are used to split the array of incoming data by elements and to perform various actions on the elements.
Parameter ID |
Description |
|
A jq expression for composing an array or referencing an array. |
|
This parameter allows you to configure aggregation rules by using a jq expression. |
|
Configuring how to apply the output data to the current playbook data. Possible values:
|
|
Loop operation mode. Possible values:
By default, the value is |
|
This parameter allows you to specify the number of array elements that will be processed in one loop or one parallel thread. You can use this parameter if the plug-in function limits the number of input elements. For example, if a plug-in function can handle no more than 10 elements in one loop, you can specify the following parameter value: By default, the value is |
|
This parameter defines the behavior when an error occurs in one of the branches. Possible values:
By default, the value is |
|
Array of execution steps. |
Parallel
Before specifying the Parallel parameter, make sure that the aggregate parameter is also specified in the playbook algorithm.
The Parallel parameters are used to perform several actions on the data at the same time. Unlike Loop, Parallel transmits the same input data to different execution branches.
Parameter ID |
Description |
|
A jq expression for composing an array. |
|
This parameter allows you to configure aggregation rules by using a jq expression. |
|
Configuring how to apply the output data to the current playbook data. Possible values:
|
|
This parameter defines the behavior when an error occurs in one of the branches. Possible values:
By default, the value is |
|
Execution branches. |
Branch
Parameter ID |
Description |
|
The name of the branch that is unique within |
|
Array of execution steps. |
Decision
The Decision execution step allows you to perform a step or set of steps according to a condition. Note that only the first verified condition is executed.
Parameter ID |
Description |
|
Array of conditions. |
Condition
Parameter ID |
Description |
|
A jq expression that contains execution conditions. |
|
Execution steps for the current branch. |
UpdateData
The UpdateData parameter can be described either as a jq script with state change logic, or as an Output object.
ResponseFunction parameters
Parameter ID |
Description |
|
Response action name. |
|
The parameter allows you to describe the parameters of a response action you want to launch. You can specify the parameter as a jq expression or as an object. Parameters of the response actions are described in the table below. |
|
The parameter allows you to use a jq expression or string array to specify a list of assets for which you want to launch a response action. The |
Response action parameters
Response action name |
Parameters |
|
Update databases response action. Possible parameters:
To launch this response action, you need to specify the |
|
Run malware scan response action. Possible parameters:
To launch this response action, you need to specify the |
|
Move to group response action. Possible parameters:
To launch this response action, you need to specify the |
|
Move to quarantine response action. Possible parameters:
You can specify the response action parameters in one of the following ways:
To launch this response action, you need to specify the |
|
Terminate process response action. Possible parameters:
To launch this response action, you need to specify the |
|
Change authorization status response action. Possible parameter:
To launch this response action, you need to specify the |
|
Enable network isolation response action. Possible parameters:
|
|
Disable network isolation response action. To launch this response action, you need to specify the |
|
Run executable file response action. Possible parameters:
To launch this response action, you need to specify the |
|
Add prevention rule response action. Possible parameters:
To launch this response action, you need to specify the |
|
Delete prevention rule response action. Possible parameters:
To launch this response action, you need to specify the |
|
Delete all prevention rules. To launch this response action, you need to specify the |
|
Assign KASAP group response action. Possible parameters:
To launch this response action, you need to specify the |
|
Add user to security group response action. Possible parameters:
To launch this response action, you need to specify the |
|
Delete user from security group response action. Possible parameters:
To launch this response action, you need to specify the |
|
Lock account response action. To launch this response action, you need to specify the |
|
Reset password response action. To launch this response action, you need to specify the |
|
Execution of custom scripts. Possible parameters:
|
|
Data enrichment. Possible parameters:
|
Editing incidents by using playbooks
Kaspersky Next XDR Expert allows you to edit incidents manually or by using playbooks. When creating a playbook, you can configure the playbook algorithm to edit the incident properties.
To edit an incident by using a playbook, you must have one of the following roles: Main administrator, SOC administrator, Tier 1 analyst, Tier 2 analyst, or Tenant administrator.
You cannot edit incidents that have the Closed status.
You can edit the following incident properties by using the playbook:
- Assignee
- Incident workflow status
- Incident type
- Comment
- Description
- Priority
- ExternalReference attribute
- Additional data attribute
Examples of the expressions that you can use in the playbook algorithm to edit the incident properties:
- Assigning an incident to a user
- Unassigning an incident from a user
- Changing a status of the incident workflow
- Changing the incident type
- Adding a comment to an incident
- Editing the incident description
- Changing the incident priority
- Editing the ExternalReference attribute
- Editing the Additional data attribute
Editing alerts by using playbooks
Kaspersky Next XDR Expert allows you to edit incidents manually or by using playbooks. When creating a playbook, you can configure the playbook algorithm to edit the alert properties.
To edit an alert by using a playbook, you must have one of the following XDR roles: Main administrator, SOC administrator, Tier 1 analyst, Tier 2 analyst, or Tenant administrator.
You cannot edit alerts that have the Closed status.
You can edit the following alerts properties by using the playbook:
- Assignee
- Alert status
- Comment
- ExternalReference attribute
- Additional data attribute
Examples of the expressions that you can use in the playbook algorithm to edit the alert properties:
- Assigning an alert to a user
- Unassigning an alert from a user
- Changing the alert status
- Adding a comment to an alert
- Editing the ExternalReference attribute
- Editing the Additional data attribute
REST API
You can access XDR from third-party solutions using the API. The XDR REST API operates over HTTP and consists of a set of request/response methods.
On the Swagger page, use the Select a definition drop-down list to switch between KUMA and XDR (OSMP) API sets.
REST API requests must be sent to the following address:
https://api.<XDR FQDN>/xdr/api/v1/<request>
https://api.<XDR FQDN>/xdr/api/v3/kuma/<request> (for KUMA-specific API)
Example:
https://api.example.com/xdr/api/v1/
https://api.example.com/xdr/api/v3/kuma/ (for KUMA-specific API)
Creating a token
To generate a user API token:
- In the main menu, go to Settings → API Tokens.
- Click Add token.
- In the Add token panel, configure the token options:
- Click Expiration date and use the calendar to specify the expiration date. If you want to disable automatic expiration for the token, select the No expiration date check box.
The maximum expiration date range is 365 days.
We recommend that you enable automatic expiration for tokens that have access to POST methods.
- Select check boxes next to the API methods you want to allow access to.
- Click Expiration date and use the calendar to specify the expiration date. If you want to disable automatic expiration for the token, select the No expiration date check box.
- Click Generate.
- Click Copy and close.
You will not be able to copy the token later.
The token is created and copied to the clipboard. Save the token in any convenient way.
Page top
Authorizing API requests
Each API request must include token-based authorization. The user whose token is used to make the API request must have the permissions to perform this type of request.
Each request must be accompanied by the following header:
Authorization: Bearer <token>
Possible errors
HTTP code |
Description |
|
400 |
Invalid header |
invalid authorization header |
403 |
The token does not exist or the owner user is disabled |
access denied |
API Reference Guide
This Kaspersky Security Center OpenAPI reference guide is designed to assist in the following tasks:
- Automation and customization. You can automate tasks that you might not want to handle manually. For example, as an administrator, you can use Kaspersky Security Center OpenAPI to create and run scripts that will facilitate developing the structure of administration groups and keep that structure up-to-date.
- Custom development. Using OpenAPI, you can develop a client application.
You can use the search field in the right part of the screen to locate the information you need in the OpenAPI reference guide.
Samples of scripts
The OpenAPI reference guide contains samples of the Python scripts listed in the table below. The samples show how you can call OpenAPI methods and automatically accomplish various tasks for protecting your network, for instance, create a "primary/secondary" hierarchy, run tasks in Open Single Management Platform, or assign distribution points. You can run the samples as is or create your own scripts based on the samples.
To call the OpenAPI methods and run scripts:
- Download the KlAkOAPI.tar.gz archive. This archive includes the KlAkOAPI package and samples (you can copy them from the archive or the OpenAPI reference guide). The KlAkOAPI.tar.gz archive is also located in the Open Single Management Platform installation folder.
- Install the KlAkOAPI package from the KlAkOAPI.tar.gz archive on a device where Administration Server is installed.
You can call the OpenAPI methods, run the samples and your own scripts only on devices where Administration Server and the KlAkOAPI package are installed.
Matching between user scenarios and samples of Kaspersky Security Center OpenAPI methods
Sample
Purpose of the sample
Scenario
You can extract and process data by using the
KlAkParamsdata structure. The sample shows how to work with this data structure.The sample output may be present in different ways. You can get the data to send an HTTP method or to use it in your code.
You can add a secondary Administration Server and establish a "primary/secondary" hierarchy. Alternately, you can disconnect the secondary Administration Server from the hierarchy.
Creating a hierarchy of Administration Servers, adding a secondary Administration Server, and deleting a hierarchy of Administration Servers
Download network list files via connection gateway to the specified host
You can connect to Network Agent on the needed device by using a connection gateway, and then download a file with the network list to your device.
You can connect to the primary Administration Server, download a required license key from it, and transmit this key to all the secondary Administration Servers included in a hierarchy.
Licensing of managed applications
You can create different reports. For instance, you can generate the report of effective user rights by using this sample. This report describes the rights that a user has, depending on his or her group and role.
You can download the report in the HTML, PDF, or Excel format.
You can connect to Network Agent on the needed device by using a connection gateway, and then run the necessary task.
You can assign managed devices as distribution points (previously known as update agents).
You can perform various actions with administration groups. The sample shows how to do the following:
- Get an identifier of the "Managed devices" root group
- Move through the group hierarchy
- Retrieve the full, expanded hierarchy of groups, along with their names and nesting
You can find out the following information:
- Task progress history
- Current task status
- Number of tasks in different statuses
You can also run a task. By default, the sample runs a task after it outputs statistics.
You can create a task. Specify the following task parameters in the sample:
- Type
- Method of run
- Name
- Device group for which the task will be used
By default, the sample creates a task with the "Show message" type. You can run this task for all managed devices of Administration Server. If necessary, you can specify your own task parameters.
You can get a list of all the active license keys for Kaspersky applications installed on managed devices of Administration Server. The list contains detailed data about every license key, such as a name, type, or expiration date.
You can create the application category with the needed parameters.
Creating an application category with content added manually
You can use the SrvView class to request detailed information from the Administration Server. For instance, you can get a list of users by using this sample.
Applications interacting with Open Single Management Platform via OpenAPI
Some applications interact with Open Single Management Platform via OpenAPI. Such applications include, for example, Kaspersky Anti Targeted Attack Platform. This can also be a custom client application developed by you based on OpenAPI.
Applications interacting with Open Single Management Platform via OpenAPI connect to Administration Server. To find out whether the application that you use works by OpenAPI, see Help of this application.
Page top
Managing Kaspersky Unified Monitoring and Analysis Platform
This section provides information about Kaspersky Unified Monitoring and Analysis Platform functions related to the operation and maintenance of Kaspersky Next XDR Expert.
About Kaspersky Unified Monitoring and Analysis Platform
Kaspersky Unified Monitoring and Analysis Platform (hereinafter KUMA or "program") is an integrated software solution that includes the following set of functions:
- Receiving, processing, and storing information security events.
- Analysis and correlation of incoming data.
- Search within the obtained events.
- Creation of notifications upon detecting symptoms of information security threats.
The program is built on a microservice architecture. This means that you can create and configure the relevant microservices (hereinafter also "services"), thereby making it possible to use KUMA both as a log management system and as a full-fledged SIEM system. In addition, flexible data streams routing allows you to use third-party services for additional event processing.
Updates functionality (including providing anti-malware signature updates and codebase updates) may not be available in the software in the U.S.
What's new
Kaspersky Unified Monitoring and Analysis Platform introduces the following features and improvements:
- KUMA now also supports the following operating systems:
- Astra Linux 1.7.6
- Now you can visualize the dependencies of resources on each other and on other objects in the interactive graph. Now, when editing resources, you can figure out to which linked resources the change will be applied. You can display certain types of resources on the graph and save the resulting graph in SVG format.
- Now you can add tags to resources, which makes it easier to search for resources that have the same tag.
- Added resource versioning (except dictionaries and tables), which allows storing change history for resources.
When you save changes in resource settings, a new version of the resource is created. You can restore a previous version of a resource, for example, to recover its functionality; you can also compare resource versions to keep track of the changes.
After upgrading KUMA to version 3.4, existing resources will acquire versions only after they are changed and the changes are saved.
- Now you can search for resources by their content using full-text search. You can find resources in which at least one field contains a specific word, for example, if you need to find rules with a certain word in a condition.
- Introducing a new type of KUMA resource, Data collection and analysis rules, which allow you to schedule SQL queries to the storage and perform correlation based on the received data.
- Now you can pass the values of unique fields to the fields of correlation events when creating correlation rules of the standard type.
- New SQL function sets, enrich and lookup, allow using the attributes of assets and accounts, as well as data from dictionaries and tables, in search queries to filter events, generate reports and widgets (graph type: table). You can use the enrich and lookup function sets in an SQL query in data collection and analysis rules.
- Now you can save the search history. Now you can refer to the history of queries and quickly find a query you have used in the past.
- Now you can organize saved queries in a folder tree for structured storage and quick search of queries. Now you can edit previously saved queries, rename them, hierarchically arrange queries in groups (folders). and search for previously saved queries in the search bar. You can also edit the queries and create links to frequently used queries by adding them to favorites.
- Now you can create a temporary list of exclusions (for example, create exclusions for false positives when managing alerts or incidents). You can create a list of exclusions for each correlation rule.
- When creating a collector, at the Event parsing step, you now can pass the name or path of the file being processed by the collector to the KUMA event field.
- The following settings have been added to the connector of the file type:
- The Modification timeout, sec field. This field lets you specify the time in seconds for which the file must not be updated for KUMA to apply the action specified in the Action after timeout drop-down list to the file: delete, add suffix, leave unchanged.
- The Action after timeout drop-down list. This drop-down list lets you specify the action that KUMA applies to the file after the time specified in the Modification timeout, sec field.
- The following settings have been added to connectors of the file, 1с-xml, and 1c-log types:
- The File/folder polling mode drop-down list. This drop-down list lets you specify the mode in which the connector rereads files in the directory.
- The Poll interval, ms field. This field lets you specify the interval in milliseconds at which the connector rereads files in the directory.
- A new approach is taken to determining the retention period for events when using cold storage, because you can now configure the storage conditions in the ClickHouse cluster and the amount of disk space (absolute in GB and percentage) when creating the storage or space. The new Event retention time setting lets you configure the total duration retention time of events in KUMA, counting from the time when the event is received. This setting replaces the Cold retention period.
When upgrading KUMA to version 3.4, if you have previously configured cold storage disks, the value of the Event retention time setting will be calculated as the sum of the previously specified values of the Retention period and Cold retention period settings.
- Now you can make the storage more stable by flexibly configuring event storage conditions in the ClickHouse cluster using the Event storage options setting: by storage period, storage size in GB, or the ratio of the storage size to the total available disk space. When a specified condition is triggered, events are moved to a cold storage disk or deleted.
You can configure storage conditions for the whole storage or for each storage space individually. The Event storage options setting replaces the Retention period setting.
- Users with different rights can have granular access to events. Access to events is controlled at the level of storage space. After upgrading KUMA to version 3.4, the 'All spaces' space set is assigned to all existing users, that is, access to all spaces is unrestricted. To differentiate access, you must configure space sets, and adjust access permissions. Also, after the update, all available storage spaces become selected in all widgets where storages had been selected. If a new space is created, this space is not automatically selected in widget settings. You must select the new space manually in the widget settings.
- Now you can manage extended event schema fields in the Settings → Extended event schema fields section. You can view existing extended event schema fields and the resources in which they are used, edit fields, create new fields manually or import them from a file, and export fields and information about fields.
When upgrading KUMA, the previously created extended event schema fields are automatically migrated and displayed in the Settings → Extended event schema fields section, with the following special considerations:
- If you had multiple fields of the same type with the same name, only one such field is migrated to KUMA.
- All fields with the
KLprefix in the name are migrated to KUMA with the Enabled status. If any of these fields become service fields, you will not be able to delete, edit, disable, or export them. - Extended event schema fields that do not satisfy the requirements that current version imposes on fields, are migrated to KUMA with the Disabled status.
After the upgrade, we recommend checking such fields and manually fixing any problems or change the configurations of the resources that use such fields.
- Now you can filter and display data for a relative time range.
This functionality is available for filtering events by period and for customizing the display of data in reports, the dashboard layout, and in widgets. You can use this functionality to display events or other data for which the selected filtering option has been updated within a time span defined relative to current time.
For data filtering, the time is specified as UTC time, and then converted in the KUMA interface to the local time zone set in the browser.
- Added support for autocomplete when typing functions of variables in correlators and correlation rules.
Now, when you start typing the name of a function when describing a local or global variable, a list of possible options is shown in the input field, and to the left of it a window is displayed with the description of the corresponding function and usage examples. You can select a function from the list and insert it together with arguments into the input field.
- Now you can apply multiple monitoring policies to multiple event sources or disable monitoring policies for multiple sources at the same time.
- Monitoring policies get a new Schedule setting that allows you to configure how often you want to apply monitoring policies to event sources.
- Now you can manage connections created for an agent, which improves ease of use. You can rename connections (which lets you know from which connection and from which agent the event arrived) duplicate connections to create new connections based on existing ones, and delete connections. The functionality that allows using one agent to read multiple files has also been restored.
- KUMA agents now have the ability to trace event route if at least one internal destination is specified in the agent connection and if a connector of the internal type is configured in the collector that receives events from the agent. After configuring the agent, information about the event route is added to in the event card, the alert card, and the correlation event card in the Event tracing log section. For events with route tracing, the Event tracing log section displays information about the services through which the event passes; the information is displayed in converted form. Service names are clickable links. Clicking a link with the service name opens the service card in a new browser tab. If you rename the service, the new name of the service is displayed in the cards of new events and in the cards of already processed events. If you delete a service in the Active services section, the Event tracing log section displays Deleted instead of the link. The rest of the event route data is not deleted and continues to be displayed.
- The Sigma rule converter converts rules to a filter selector, an SQL query for event search, or a KUMA correlation rule of the 'simple' type. Available under the LGPL 2.1 license.
- Now you can install the AI score and asset status service if your license covers the AI module.
The AI service helps with precisely assessing the severity of correlation events generated as a result of correlation rules triggering. The AI service gets correlation events that connect linked assets from the available storage clusters, constructs the expected sequence of events, and trains the AI model. Based on the chain of triggered correlation rules, the AI service calculates whether such a sequence of events is typical for this infrastructure. Non-typical patterns increase the score of the asset. The AI service calculates the AI score and the Status, which are displayed in the asset card. You can apply a filter by the AI score and Status fields when searching for assets. You can also set up proactive categorization of assets by the AI score and Status fields, which moves the asset to the category corresponding to the risk level as soon as the AI service assigns a score to the asset. You can also track the changes of asset categories and the distribution of assets by status on the dashboard.
- In the RU region, if you have the AI license module, you can use the Kaspersky Investigation and Response Assistant (KIRA) to analyze the command that triggered the correlation rule. This analysis helps with the investigation of alerts and incidents by offering an easy to understand description of the command line options.
You can send a request to KIRA from card of the event or correlation event. If the command is obfuscated, KIRA deobfuscates it and displays the result: the conclusion, summary, and detailed analysis. The results of the query are stored in the cache for 14 days and are can be viewed in the event card on the KIRA analysis tab by all users with access rights. You can also view the result in the properties of the Request to KIRA task, or restart the task and perform the analysis from scratch.
- Now you can categorize assets by a relative time range.
You can set up active categorization of assets to have assets moved to a category from the moment when the categorization condition has been satisfied for a certain time span defined relative to the current time.
For categorization, the time is specified as UTC time, and then converted in the KUMA interface to the local time zone set in the browser.
- Added new types of custom notification templates:
- Report generated.
- Task finished (only one template of this type can exist).
- KASAP group changed.
All types of templates are available when creating a template for the Shared tenant. For all other tenants, the Monitoring policy violation notification template is available.
- A new graph type: Stacked bar chart.
You can use the new graph type when creating Events and Assets widgets to visualize the relative quantities or percentages for selected parameters. Values of individual parameters values are displayed in each bar in a different color.
- Now you can select multiple assets using a filter and delete all selected assets. Now you can also select all assets in a category, link them to a category, or unlink assets from a category.
- Now you can select multiple resources and delete them. You can delete all resources or specific types of resources.
- New predefined widgets are available in the Assets group, as well as a new type, Custom widget, which lets you get custom analytics for assets.
- Improved export of widgets to PDF. Now, if the data displayed in a widget continues beyond the visible area, when such a widget is exported to PDF, it is split into multiple widgets, and vertical bar charts are converted to horizontal bar charts.
- New unified normalizer for different versions of NetFlow (NetFlow v5, NetFlow v9, IPFIX/NetFlow v10) lets you replace several normalizers with just one. The NetFlow v5, NetFlow v9, and IPFIX (NetFlow v10) normalizers remain available.
In addition, the last NetFlow template is now saved to disk for each event source, which allows to immediately parse the netflow from an already known event source when the collector is restarted.
- The End User License Agreement can now be accepted automatically when installing the KUMA agent on Linux devices and Windows devices using the
--accept-eulaoption. Also, for the Windows agent, you now use the command line to set the password for the agent's user account. - In the Resources → Active services section, a new column of the table of services, UUID, displays the unique identifier of the service.
This column is hidden by default. Identifying KUMA services by UUID can facilitate troubleshooting at the operating system level.
- KUMA supports the UNION operator for connections to an Oracle database as an event source.
- To optimize asset management, the process of importing information about assets from Open Single Management Platform is divided into two tasks:
- Importing information about the basic parameters of assets (protection status, versions of anti-virus databases, hardware information), which takes less time and is presumed to be performed more frequently.
- Importing information about other assets parameters (vulnerabilities, software, owners), which can involve downloading a large amount of information and which takes a longer time to complete.
Each of the import tasks can be started independently of the other, and you can configure a separate schedule for each task when configuring the integration with Open Single Management Platform.
- Now you can display separate incoming events graphs for multiple event sources at the same time, as well as create an incoming events chart based on graphs for multiple event sources, which lets you compare the amount of events received from multiple event sources and how this figure changes in time.
- New filtering criteria added to the conditions for active categorization and search of assets: Software version, KSC group, CVSS (severity level of CVE vulnerability on the asset), CVE count (number of unique vulnerabilities with the CVE attribute on the asset), as well as filtering by custom fields of assets.
- Now you can receive resource updates through a proxy server.
- Now you can generate resource utilization reports (CPU, RAM, etc) in the form of dumps at the request of Technical Support.
- For resources, the table displays the number of resources from the tenants available to you in the table: the total number or the number with the filter or search applied, as well as the number of selected resources.
- The new office365 connector lets you configure the reception of events from the Microsoft 365 (Office 365) solution using the API.
- Certain obsolete resources are no longer supported or provided:
- [OOTB] Linux audit and iptables syslog
- [OOTB] Linux audit.log file
- [OOTB] Checkpoint Syslog CEF by CheckPoint
- [OOTB] Eltex MES Switches
- [OOTB] PTsecurity NAD
- [OOTB][AD] Granted TGS without TGT (Golden Ticket)
- [OOTB][AD] Possible Kerberoasting attack
- [OOTB][AD][Technical] 4768. TGT Requested
- [OOTB][AD] List of requested TGT. EventID 4768
Program architecture
The standard program installation includes the following components:
- The Core that includes a graphical interface to monitor and manage the settings of system components.
- Agents that are used to forward raw events from servers and workstations to KUMA destinations.
- One or more Collectors that receive messages from event sources and parse, normalize, and, if required, filter and/or aggregate them.
- Event routers that receive events from collectors and, apply the configured filters, and route the events to the configured destinations. In this way, these services balance the load on the links.
- A Correlator that analyzes normalized events received from Collectors, performs the necessary actions with active lists, and creates alerts in accordance with the correlation rules.
- The Storage, which contains normalized events and registered incidents.
Events are transmitted between components over optionally encrypted, reliable transport protocols. You can configure load balancing to distribute load between service instances, and it is possible to enable automatic switching to the backup component if the primary one is unavailable. If all components are unavailable, events are saved to the hard disk buffer and sent later. The size of the buffer in the file system for temporary storage of events can be changed.
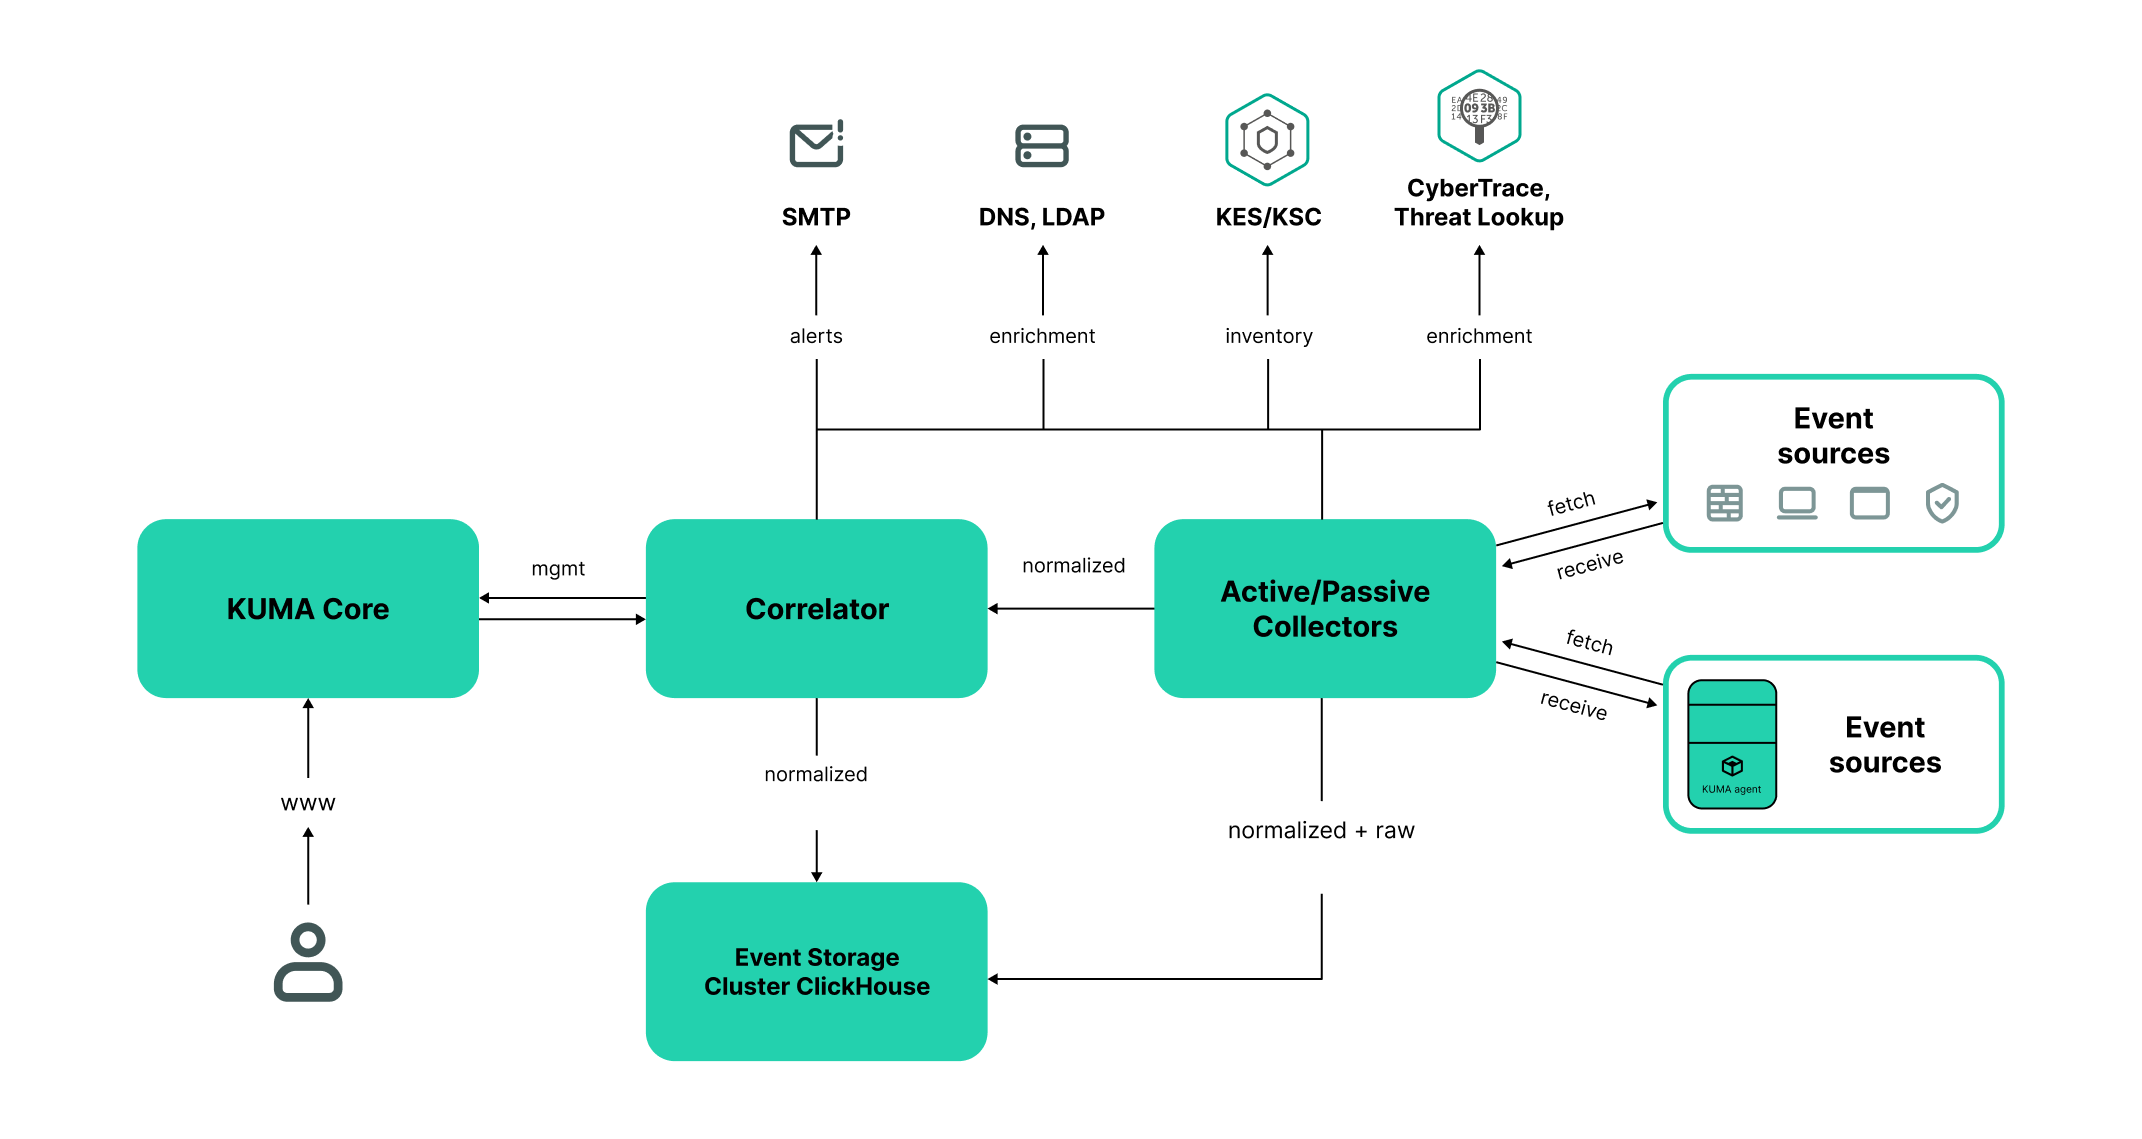
KUMA architecture
Core
The Core is the central component of KUMA that serves as the foundation upon which all other services and components are built. The Core provides a graphical user interface that is intended for everyday use as well as for configuring the system as a whole.
The Core allows you to:
- create and configure services, or components, of the program, as well as integrate the necessary software into the system;
- manage program services and user accounts in a centralized way;
- visualize statistical data on the program;
- investigate security threats based on the received events.
Collector
A collector is an application component that receives messages from event sources, processes them, and transmits them to a storage, correlator, and/or third-party services to identify alerts.
For each collector, you need to configure one connector and one normalizer. You can also configure an unlimited number of additional Normalizers, Filters, Enrichment rules, and Aggregation rules. To enable the collector to send normalized events to other services, specific destinations must be added. Normally, two destinations are used: the storage and the correlator.
The collector operation algorithm includes the following steps:
- Receiving messages from event sources
To receive messages, you must configure an active or passive connector. The passive connector can only receive messages from the event source, while the active connector can initiate a connection to the event source, such as a database management system.
Connectors can also vary by type. The choice of connector type depends on the transport protocol for transmitting messages. For example, for an event source that transmits messages over TCP, you must install a TCP type connector.
The program has the following connector types available:
- tcp
- udp
- netflow
- sflow
- nats-jetstream
- kafka
- kata/edr
- http
- sql
- file
- 1c-xml
- 1c-log
- diode
- ftp
- nfs
- vmware
- wmi
- wec
- snmp-trap
- elastic
- etw
- Event parsing and normalization
Events received by the connector are processed using the normalizer and normalization rules set by the user. The choice of normalizer depends on the format of the messages received from the event source. For example, you must select a CEF-type root normalizer for a source that sends events in CEF format.
The following normalizers are available in the program:
- JSON
- CEF
- Regexp
- Syslog (as per RFC3164 and RFC5424)
- CSV
- Key-value
- XML
- NetFlow (unified normalizer for NetFlow v5, NetFlow v9 and IPFIX)
- NetFlow v5
- NetFlow v9
- SQL
- IPFIX (v10)
- Filtering of normalized events
You can configure filters to select events satisfying specified conditions to send such events for processing.
- Enrichment and conversion of normalized events
Enrichment rules let you to supplement event contents with information from internal and external sources. The program has the following enrichment sources:
- constants
- cybertrace
- dictionaries
- dns
- events
- ldap
- templates
- timezone data
- geographic data
Mutation rules let you convert event field contents in accordance with the defined criteria. The program has the following conversion methods:
- lower—converts all characters to lower case.
- upper—converts all characters to upper case.
- regexp—extracts a substring using RE2 regular expressions.
- substring—gets a substring based on the specified numbers of the start and end positions.
- replace—replaces text with the entered string.
- trim—deletes the specified characters.
- append—adds characters to the end of the field value.
- prepend—adds characters to the beginning of the field value.
- Aggregation of normalized events
You can configure aggregation rules to reduce the number of similar events that are transmitted to the storage and/or the correlator. Configuring aggregation rules lets you combine several events into one event. This helps you reduce the load on the services responsible for further event processing, conserves storage space and the license quota for events per second (EPS). For example, you can aggregate into one event all events involving network connections made using the same protocol (transport and application layers) between two IP addresses and received during a specified time interval.
- Transmission of normalized events
After all the processing stages are completed, the event is sent to configured destinations.
Correlator
The Correlator is a program component that analyzes normalized events. Information from active lists and/or dictionaries can be used in the correlation process.
The data obtained by analysis is used to carry out the following tasks:
- Alert detection.
- Notification about detected incidents.
- Active lists content management.
- Sending correlation events to configured destinations.
Event correlation is performed in real time. The operating principle of the correlator is based on an event signature analysis. This means that every event is processed according to the correlation rules set by the user. When the program detects a sequence of events that satisfies the conditions of the correlation rule, it creates a correlation event and sends it to the Storage. The correlation event can also be sent to the correlator for repeated analysis, which allows you to customize the correlation rules so that they are triggered by the results of a previous analysis. Products of one correlation rule can be used by other correlation rules.
You can distribute correlation rules and the active lists they use among correlators, thereby sharing the load between services. In this case, the collectors will send normalized events to all available correlators.
The correlator operation algorithm has the following steps:
- Obtaining an event
The correlator receives a normalized event from the collector or from another service.
- Applying correlation rules
You can configure correlation rules so they are triggered based on a single event or a sequence of events. If no alert was detected using the correlation rules, the event processing ends.
- Responding to an alert
You can specify actions that the program must perform when an alert is detected. The following actions are available in the program:
- Event enrichment
- Operations with active lists
- Sending notifications
- Storing correlation event
- Sending a correlation event
When the program detects a sequence of events that satisfies the conditions of the correlation rule, it creates a correlation event and sends it to the storage. Event processing by the correlator is now finished.
Storage
A KUMA storage is used to store normalized events so that they can be quickly and continually accessed from KUMA for the purpose of extracting analytical data. Access speed and continuity are ensured through the use of the ClickHouse technology. This means that a storage is a ClickHouse cluster bound to a KUMA storage service. ClickHouse clusters can be supplemented with cold storage disks.
When choosing a ClickHouse cluster configuration, consider the specific event storage requirements of your organization. For more information, please refer to the ClickHouse documentation.
In repositories, you can create spaces. The spaces enable to create a data structure in the cluster and, for example, store the events of a certain type together.
Page top
About events
Events are information security events registered on the monitored elements of the organization's IT infrastructure. For example, events include login attempts, interactions with a database, and sensor information broadcasts. Each separate event may seem meaningless, but when considered together they form a bigger picture of network activities to help identify security threats. This is the core functionality of KUMA.
KUMA receives events from logs and restructures their information, making the data from different event sources consistent (this process is called normalization). Afterwards, the events are filtered, aggregated, and later sent to the correlator service for analysis and to the Storage for retaining. When KUMA recognizes specific event or a sequences of events, it creates correlation events, that are also analyzed and retained. If an event or sequence of events indicates a potential security threat, KUMA creates an alert. This alert consists of a warning about the threat and all related data that should be investigated by a security officer. If the nature of the data received by KUMA or the generated correlation events and alerts indicate a possible attack or vulnerability, the symptoms of such an event can be combined into an incident.
For convenience of investigating alerts and processing incidents, make sure that time is synchronized on all devices involved in the event life cycle (event sources, KUMA servers, client hosts) with the help of Network Time Protocol (NTP) servers.
Throughout their life cycle, events undergo conversions and may receive different names. Below is a description of a typical event life cycle:
The first steps are carried out in a collector.
- Raw event. The original message received by KUMA from an event source using a Connector is called a raw event. This is an unprocessed message and it cannot be used yet by KUMA. To fit into the KUMA pipeline, raw events must be normalized into the KUMA data model. That's what the next stage is for.
- Normalized event. A normalizer transforms 'raw' event data in accordance with the KUMA data model. After this conversion, the original message becomes a normalized event and can be used by KUMA for analysis. From here on, only normalized events are used in KUMA. Raw events are no longer used, but they can be kept as a part of normalized events inside the
Rawfield.The program has the following normalizers:
- JSON
- CEF
- Regexp
- Syslog (as per RFC3164 and RFC5424)
- CSV/TSV
- Key-value
- XML
- Netflow v5, v9, IPFIX (v10), sFlow v5
- SQL
At this point normalized events can already be used for analysis.
- Event destination. After the collector has processed an event, it is ready to be used by other KUMA services and sent to the KUMA Correlator and/or Storage.
The next steps of the event life cycle are completed in the correlator.
Event types:
- Base event. An event that was normalized.
- Aggregated event. When dealing with a large number of similar events, you can "merge" them into a single event to save processing time and resources. They act as base events, but In addition to all the parameters of the parent events (events that are "merged"), aggregated events have a counter that shows the number of parent events it represents. Aggregated events also store the time when the first and last parent events were received.
- Correlation event. When a sequence of events is detected that satisfies the conditions of a correlation rule, the program creates a correlation event. These events can be filtered, enriched, and aggregated. They can also be sent for storage or looped into the Correlator pipeline.
- Audit event. Audit events are created when certain security-related actions are completed in KUMA. These events are used to ensure system integrity. They are automatically placed in a separate storage space and stored for at least 365 days.
- Monitoring event. These events are used to track changes in the amount of data received by KUMA.
About alerts
In KUMA, an alert is created when a sequence of events is received that triggers a correlation rule. Correlation rules are created by KUMA analysts to check incoming events for possible security threats, so when a correlation rule is triggered, it's a warning there may be some malicious activity happening. Security officers should investigate these alerts and respond if necessary.
KUMA automatically assigns the severity to each alert. This parameter shows how important or numerous the processes are that triggered the correlation rule. Alerts with higher severity should be dealt with first. The severity value is automatically updated when new correlation events are received, but a security officer can also set it manually. In this case, the alert severity is no longer automatically updated.
Alerts have related events linked to them, making alerts enriched with data from these events. KUMA also offers drill down functionality for alert investigations.
You can create incidents based on alerts.
Alert management in KUMA is described in this section.
Page top
About incidents
If the nature of the data received by KUMA or the generated correlation events and alerts indicate a possible attack or vulnerability, the symptoms of such an event can be combined into an incident. This allows security experts to analyze threat manifestations in a comprehensive manner and facilitates response.
You can assign a category, type, and severity to incidents, and assign incidents to data protection officers for processing.
Incidents can be exported to NCIRCC.
Page top
About resources
Resources are KUMA components that contain parameters for implementing various functions: for example, establishing a connection with a given web address or converting data according to certain rules. Like parts of an erector set, these components are assembled into resource sets for services that are then used as the basis for creating KUMA services.
Page top
About services
Services are the main components of KUMA that work with events: receiving, processing, analyzing, and storing them. Each service consists of two parts that work together:
- One part of the service is created inside the KUMA Console based on set of resources for services.
- The second part of the service is installed in the network infrastructure where the KUMA system is deployed as one of its components. The server part of a service can consist of multiple instances: for example, services of the same agent or storage can be installed on multiple devices at once.
Parts of services are connected to each other via the service ID.
Page top
About agents
KUMA agents are services that are used to forward raw events from servers and workstations to KUMA destinations.
Types of agents:
- wmi agents are used to receive data from remote Windows devices using Windows Management Instrumentation. They are installed to Windows assets.
- wec agents are used to receive Windows logs from a local device using Windows Event Collector. They are installed to Windows assets.
- tcp agents are used to receive data over the TCP protocol. They are installed to Linux and Windows assets.
- udp agents are used to receive data over the UDP protocol. They are installed to Linux and Windows assets.
- nats-jetstream—used for NATS communications. They are installed to Linux and Windows assets.
- kafka agents are used for Kafka communications. They are installed to Linux and Windows assets.
- http agents are used for communication over the HTTP protocol. They are installed to Linux and Windows assets.
- file agents are used to get data from a file. They are installed to Linux and Windows assets.
- ftp agents are used to receive data over the File Transfer Protocol. They are installed to Linux and Windows assets.
- nfs agents are used to receive data over the Network File System protocol. They are installed to Linux and Windows assets.
- snmp agents are used to receive data over the Simple Network Management Protocol. They are installed to Linux and Windows assets.
- diode agents are used together with data diodes to receive events from isolated network segments. They are installed to Linux and Windows assets.
- etw agents are used to receive Event Tracing for Windows data. They are installed to Windows assets.
About Priority
Priority reflects the relative importance of security-sensitive activity detected by a KUMA correlator. It shows the order in which multiple alerts should be processed, and indicates whether senior security officers should be involved.
The Correlator automatically assigns severity to correlation events and alerts based on correlation rule settings. The severity of an alert also depends on the assets related to the processed events because correlation rules take into account the severity of a related asset's category. If the alert or correlation event does not have linked assets with a defined severity or does not have any related assets at all, the severity of this alert or correlation event is equal to the severity of the correlation rule that triggered them. The alert or the correlation event severity is never lower than the severity of the correlation rule that triggered them.
Alert severity can be changed manually. The severity of alerts changed manually is no longer automatically updated by correlation rules.
Possible severity values:
- Low
- Medium
- High
- Critical
Administrator's guide
This chapter provides information about installing and configuring the KUMA SIEM system.
Logging in to the KUMA Console
To go to the KUMA Console, in the XDR web interface, go to the Settings → KUMA section.
This takes you to the KUMA Console. The console is opened in a new browser tab.
Page top
KUMA services
Services are the main components of KUMA that help the system to manage events: services allow you to receive events from event sources and subsequently bring them to a common form that is convenient for finding correlation, as well as for storage and manual analysis. Each service consists of two parts that work together:
- One part of the service is created inside the KUMA Console based on set of resources for services.
- The second part of the service is installed in the network infrastructure where the KUMA system is deployed as one of its components. The server part of a service can consist of multiple instances: for example, services of the same agent or storage can be installed on multiple devices at once.
On the server side, KUMA services are located in the
/opt/kaspersky/kumadirectory.When you install KUMA in high availability mode, only the KUMA Core is installed in the cluster. Collectors, correlators, and storages are hosted on hosts outside of the Kubernetes cluster.
Parts of services are connected to each other via the service ID.
Service types:
- Storages are used to save events.
- Correlators are used to analyze events and search for defined patterns.
- Collectors are used to receive events and convert them to KUMA format.
- Agents are used to receive events on remote devices and forward them to KUMA collectors.
In the KUMA Console, services are displayed in the Resources → Active services section in table format. The table of services can be updated using the Refresh button and sorted by columns by clicking on the active headers. You can also configure the columns displayed in the table. To do so, click the gear button in the upper-right corner to display a drop-down list. In that drop-down list, select check boxes next to the names of the columns that you want to display in the table. You can leave any single column in the list to be displayed.
The maximum table size is not limited. If you want to select all services, scroll to the end of the table and select the Select all check box, which selects all available services in the table.
Table columns:
- Status—service status:
- Green means the service is running and accessible from the Core server.
- Red means the service is not running or is not accessible from the Core server.
- Yellow is the status that applies to all services except the agent. The yellow status means that the service is running, but there are errors in the service log, or there are alerts for the service from Victoria Metrics. You can view the error message by hovering the mouse cursor over the status of the service in the Active services section.
- Purple is the status that is applied to running services whose configuration file in the database has changed, but that have no other errors. If a service has an incorrect configuration file and has errors, for example, from Victoria Metrics, status of the service is yellow.
- Gray means that if a deleted tenant had a running service that is still running, that service is displayed with a gray status on the Active services page. Services with the gray status are kept when you delete the tenant to let you copy the ID and remove services on your servers. Only the General administrator can delete services with the gray status. When a tenant is deleted, the services of that tenant are assigned to the Main tenant.
- Type—type of service: agent, collector, correlator, storage, event router.
- Name—name of the service. Clicking on the name of the service opens its settings.
- Version—service version.
- Tenant—the name of the tenant that owns the service.
- FQDN—fully qualified domain name of the service server.
- IP address—IP address of the server where the service is installed.
- API port—Remote Procedure Call port number.
- Uptime—Uptime of the service.
- Created—the date and time when the service was created.
- UUID—Unique ID of the service.
By default, this column is not displayed in the table. You can add it to the table by clicking the gear icon
 in the upper-right part of the table of services and selecting the check box next to the name of the UUID column in the drop-down list.
You can sort data in the table in ascending and descending order, as well as by the Status parameter and by the service type in the Type column. To sort active services, right-click the context menu and select one or more statuses and a type.
You can use the buttons in the upper part of the Services window to perform the following group actions:
- Add service
You can create new services based on existing service resource sets. We do not recommend creating services outside the main tenant without first carefully planning the inter-tenant interactions of various services and users.
- Refresh
You can refresh the list of active services.
- Update configuration
The Update settings button is not available if the KUMA Core service is among the services selected for group actions or if any of the selected services has the grey status. To make the Update settings button available for group actions, clear the check box from the KUMA Core service and services with the grey status.
- Restart
To perform an action with an individual service, right-click the service to display its context menu. The following actions are available:
- Reset certificate
- Delete
- Download log
If you want to receive detailed information, enable the Debug mode in the service settings.
- Copy service ID
You need this ID to install, restart, stop, or delete the service.
- Go to Events
- Go to active lists
- Go to context tables
- Go to partitions
To change a service, select a service under Resources → Active services. This opens a window with a set of resources based on which the service was created. You can edit the settings of the set of resources and save your changes. To apply the saved changes, restart the service.
If, when changing the settings of a collector resource set, you change or delete conversions in a normalizer connected to it, the edits will not be saved, and the normalizer itself may be corrupted. If you need to modify conversions in a normalizer that is already part of a service, the changes must be made directly to the normalizer under Resources → Normalizers in the web interface.
Services tools
This section describes the tools for working with services available in the Resources → Active services section of the KUMA Console.
Getting service identifier
The service identifier is used to bind parts of the service residing within KUMA and installed in the network infrastructure into a single complex. An identifier is assigned to a service when it is created in KUMA, and is then used when installing the service to the server.
To get the identifier of a service:
- Log in to the KUMA Console and open Resources → Active services.
- Select the check box next to the service whose ID you want to obtain, and click Copy ID.
The identifier of the service will be copied to the clipboard. It can be used, for example, for installing the service on a server.
Page top
Stopping, starting, checking status of the service
While managing KUMA, you may need to perform the following operations.
- Temporarily stop the service. For example, when restoring the Core from backup, or to edit service settings related to the operating system.
- Start the service.
- Check the status of the service.
The "Commands for stopping, starting, and checking the status of a service" table lists commands that may be useful when managing KUMA.
Commands for stopping, starting, and checking the status of a service
Service |
Stop service |
Start service |
Check the status of the service |
|---|---|---|---|
Core |
|
|
|
Services with an ID:
|
|
|
|
Services without an ID:
|
|
|
|
Windows agents |
To stop an agent service: 1. Copy the agent ID in the KUMA Console. 2. Connect to the host on which you want to start the KUMA agent service. 3. Run PowerShell as an account that has administrative privileges. 4. Run the following command in PowerShell:
|
To start an agent service: 1. Copy the agent ID in the KUMA Console. 2. Connect to the host on which you want to start the KUMA agent service. 3. Run PowerShell as an account that has administrative privileges. 4. Run the following command in PowerShell:
|
To view the status of an agent service: 1. In Windows, go to the Start → Services menu, and in the list of services, double-click the relevant KUMA agent. 2. This opens a window; in that window, view the status of the agent in the Service status field. |
Restarting the service
To restart the service:
- Log in to the KUMA Console and open Resources → Active services.
- Select the check box next to the service and select the necessary option:
- Update configuration—perform a hot update of a running service configuration. For example, you can change the field mapping settings or the destination point settings this way.
- Restart—stop a service and start it again. This option is used to modify the port number or connector type.
Restarting KUMA agents:
- KUMA Windows Agent can be restarted as described above only if it is running on a remote computer. If the service on the remote computer is inactive, you will receive an error when trying to restart from KUMA. In that case you must restart KUMA Windows Agent service on the remote Windows machine. For information on restarting Windows services, refer to the documentation specific to the operating system version of your remote Windows computer.
- KUMA Agent for Linux stops when this option is used. To start the agent again, you must execute the command that was used to start it.
- Reset certificate—remove certificates that the service uses for internal communication. This option may not be used to renew the Core certificate. To renew KUMA Core certificates, they must be reissued.
Special considerations for deleting Windows agent certificates:
- If the agent has the green status and you select Reset certificate, KUMA deletes the current certificate and creates a new one, the agent continues working with the new certificate.
- If the agent has the red status and you select Reset certificate, KUMA generates an error that the agent is not running. In the agent installation folder %APPDATA%\kaspersky\kuma\<Agent ID>\certificates, manually delete the internal.cert and internal.key files and start the agent manually. When the agent starts, a new certificate is created automatically.
Special considerations for deleting Linux agent certificates:
- Regardless of the agent status, apply the Reset certificate option in the web interface to delete the certificate in the databases.
- In the agent installation folder, /opt/kaspersky/agent/<Agent ID>/certificates, manually delete the internal.cert and internal.key files.
- Since the Reset certificate option stops the agent, to continue its operation, start the agent manually. When the agent starts, a new certificate is created automatically.
Deleting the service
Before deleting the service get its ID. The ID will be required to remove the service for the server.
To remove a service in the KUMA Console:
- Log in to the KUMA Console and open Resources → Active services.
- Select the check box next to the service you want to delete, and click Delete.
A confirmation window opens.
- Click OK.
The service has been deleted from KUMA.
To remove a service from the server, run the following command:
sudo /opt/kaspersky/kuma/kuma <collector/correlator/storage> --id <service ID> --uninstall
The service has been deleted from the server.
Partitions window
If the storage service was created and installed, you can view its partitions in the Partitions table.
To open Partitions table:
- Log in to the KUMA Console and open Resources → Active services.
- Select the check box next to the relevant storage and click Go to partitions.
The Partitions table opens.
The table has the following columns:
- Tenant—the name of the tenant that owns the stored data.
- Created—partition creation date.
- Space—the name of the space.
- Size—the size of the space.
- Events—the number of stored events.
- Transfer to cold storage—the date when data will be migrated from the ClickHouse clusters to cold storage disks.
- Expires—the date when the partition expires. After this date, the partition and the events it contains are no longer available.
You can delete partitions.
To delete a partition:
- Open the Partitions table (see above).
- Open the
 drop-down list to the left from the required partition.
 - Select Delete.
A confirmation window opens.
- Click OK.
The partition has been deleted. Audit event partitions cannot be deleted.
Page top
Searching for related events
You can search for events processed by the Correlator or the Collector services.
To search for events related to the Correlator or the Collector service:
- Log in to the KUMA Console and open Resources → Active services.
- Select the check box next to the required correlator or collector and click Go to Events.
This opens a new browser tab with the KUMA Events section open.
- To find events, click the
 icon.
icon.A table with events selected by the
ServiceID = <ID of the selected service> search expression is displayed.
Event search results
When searching for events, you may encounter the following shard unavailability error:
Code: 279. DB::NetException: All connection tries failed. Log: \\n\\nTimeout exceeded while connecting to socket(host.example.com:port, connection timeout 1000 ms)\\nTimeout exceeded while connecting to socket (host.example.com:port, connection timeout 1000 ms)\\nTimeout exceeded while connecting to socket (host.example.com:port, connection timeout 1000 ms)\\n\\n: While executing Remote. (ALL_CONNECTION_TRIES_FAILED) (version 23.8.8.207)\\n\"}",
In this case, you need to override the ClickHouse configuration in storage settings.
To override the ClickHouse configuration:
- In the KUMA Console, in the Resources → Storages section, click the storage resource that you want to edit.
This opens the Edit storage window.
- To skip unavailable shards when searching, insert the following lines into the ClickHouse configuration override field:
<profiles>
<default>
<skip_unavailable_shards>1</skip_unavailable_shards>
</default>
</profiles>
- To apply the ClickHouse configuration, click Save.
- Restart the storage services that depend on this resource.
This resolves the shard unavailability error, and you can proceed to search for events processed by a particular correlator or collector.
Page top
Service resource sets
Service resource sets are a resource type, a KUMA component, a set of settings based on which the KUMA services are created and operate. Resource sets for services are collections of resources.
Any resources added to a set of resources must be owned by the same tenant that owns the created set of resources. An exception is the shared tenant, whose owned resources can be used in the sets of resources of other tenants.
Resource sets for services are displayed in the Resources → <Resource set type for the service> section of the KUMA Console. Available types:
- Collectors
- Correlators
- Storages
- Agents
When you select the required type, a table opens with the available sets of resources for services of this type. The resource table contains the following columns:
- Name—the name of a resource set. Can be used for searching and sorting.
- Updated—the date and time of the last update of the resource set. Can be used for sorting.
- Created by—the name of the user who created the resource set.
- Description—the description of the resource set.
Creating a storage
A storage consists of two parts: one part is created inside the KUMA Console, and the other part is installed on network infrastructure servers intended for storing events. The server part of a KUMA storage consists of ClickHouse nodes collected into a cluster. ClickHouse clusters can be supplemented with cold storage disks.
For each ClickHouse cluster, a separate storage must be installed.
Prior to storage creation, carefully plan the cluster structure and deploy the necessary network infrastructure. When choosing a ClickHouse cluster configuration, consider the specific event storage requirements of your organization.
It is recommended to use ext4 as the file system.
A storage is created in several steps:
- Creating a set of resources for a storage in the KUMA Console
- Creating a storage service in the KUMA Console
- Installing storage nodes in the network infrastructure
When creating storage cluster nodes, verify the network connectivity of the system and open the ports used by the components.
If the storage settings are changed, the service must be restarted.
ClickHouse cluster structure
A ClickHouse cluster is a logical group of devices that possess all accumulated normalized KUMA events. It consists of one or more logical shards.
A shard is a logical group of devices that possess a specific portion of all normalized events accumulated in the cluster. It consists of one or more replicas. Increasing the number of shards lets you do the following:
- Accumulate more events by increasing the total number of servers and disk space.
- Absorb a larger stream of events by distributing the load associated with an influx of new events.
- Reduce the time taken to search for events by distributing search zones among multiple devices.
A replica is a device that is a member of a logical shard and possesses a single copy of that shard's data. If multiple replicas exist, it means multiple copies exist (the data is replicated). Increasing the number of replicas lets you do the following:
- Improve high availability.
- Distribute the total load related to data searches among multiple machines (although it's best to increase the number of shards for this purpose).
A keeper is a device that participates in coordination of data replication at the whole cluster level. At least one device per cluster must have this role. The recommended number of the devices with this role is 3. The number of devices involved in coordinating replication must be an odd number. The keeper and replica roles can be combined in one machine.
Page top
ClickHouse cluster node settings
Prior to storage creation, carefully plan the cluster structure and deploy the necessary network infrastructure. When choosing a ClickHouse cluster configuration, consider the specific event storage requirements of your organization.
When creating ClickHouse cluster nodes, verify the network connectivity of the system and open the ports used by the components.
For each node of the ClickHouse cluster, you need to specify the following settings:
- Fully qualified domain name (FQDN)—a unique address to access the node. Specify the entire FQDN, for example,
kuma-storage.example.com. - Shard, replica, and keeper IDs—the combination of these settings determines the position of the node in the ClickHouse cluster structure and the node role.
Node roles
The roles of the nodes depend on the specified settings:
- shard, replica, keeper—the node participates in the accumulation and search of normalized KUMA events and helps coordinate data replication at the cluster-wide level.
- shard, replica—the node participates in the accumulation and search of normalized KUMA events.
- keeper—the node does not accumulate normalized events, but helps coordinate data replication at the cluster-wide level. Dedicated keepers must be specified at the beginning of the list in the Resources → Storages → <Storage> → Basic settings → ClickHouse cluster nodes section.
ID requirements:
- If multiple shards are created in the same cluster, the shard IDs must be unique within this cluster.
- If multiple replicas are created in the same shard, the replica IDs must be unique within this shard.
- The keeper IDs must be unique within the cluster.
Example of ClickHouse cluster node IDs:
- shard 1, replica 1, keeper 1;
- shard 1, replica 2;
- shard 2, replica 1;
- shard 2, replica 2, keeper 3;
- shard 2, replica 3;
- keeper 2.
Cold storage of events
In KUMA, you can configure the migration of legacy data from a ClickHouse cluster to the cold storage. Cold storage can be implemented using the local disks mounted in the operating system or the Hadoop Distributed File System (HDFS). Cold storage is enabled when at least one cold storage disk is specified. If you use several storages, on each node with data, mount a cold storage disk or HDFS disk in the directory that you specified in the storage configuration settings.If a cold storage disk is not configured and the server runs out of disk space in hot storage, the storage service is stopped. If both hot storage and cold storage are configured, and space runs out on the cold storage disk, the KUMA storage service is stopped. We recommend avoiding such situations by adding custom event storage conditions in hot storage.
Cold storage disks can be added or removed. If you have added multiple cold storage disks, data is written to them in a round-robin manner. If data to be written to disk would take up more space than is available on that disk, this data and all subsequent data is written round-robin to the next cold storage disks. If you added only two cold storage disks, the data is written to the drive that has free space left.
After changing the cold storage settings, the storage service must be restarted. If the service does not start, the reason is specified in the storage log.
If the cold storage disk specified in the storage settings has become unavailable (for example, out of order), this may lead to errors in the operation of the storage service. In this case, recreate a disk with the same path (for local disks) or the same address (for HDFS disks) and then delete it from the storage settings.
Rules for moving the data to the cold storage disks
You can configure the storage conditions for events in hot storage of the ClickHouse cluster by setting a limit based on retention time or on maximum storage size. When cold storage is used, every 15 minutses and after each Core restart, KUMA checks if the specified storage conditions are satisfied:
- KUMA gets the partitions for the storage being checked and groups the partitions by cold storage disks and spaces.
- For each space, KUMA checks whether the specified storage condition is satisfied.
- If the condition is satisfied (for example, if the space contains that exceed their retention time, or if the size of the storage has reached or exceeded limit specified in the condition), KUMA transfers all partitions with the oldest date to cold storage disks or deletes these partitions if no cold storage disk is configured or if it is configured incorrectly. This action is repeated while the configured storage condition remains satisfied in the space; for example, if after deleting partitions for a date, the storage size still exceeds the maximum size specified in the condition.
KUMA generates audit events when data transfer starts and ends, or when data is removed.
- If retention time is configured in KUMA, whenever partitions are transferred to cold storage disks, it is checked whether the configured conditions are satisfied on the disk. If events are found on the disk that have been stored for longer than the Event retention time, which is counted from the moment the events were received in KUMA, the solution deletes these events or all partitions for the oldest date.
KUMA generates audit events when it deletes data.
If the ClickHouse cluster disks are 95% full, the biggest partitions are automatically moved to the cold storage disks. This can happen more often than once per hour.
During data transfer, the storage service remains operational, and its status stays green in the Resources → Active services section of the KUMA web console. When you hover over the status icon, a message is displayed about the data transfer. When a cold storage disk is removed, the storage service has the yellow status.
Special considerations for storing and accessing events
- When using HDFS disks for cold storage, protect your data in one of the following ways:
- Configure a separate physical interface in the VLAN, where only HDFS disks and the ClickHouse cluster are located.
- Configure network segmentation and traffic filtering rules that exclude direct access to the HDFS disk or interception of traffic to the disk from ClickHouse.
- Events located in the ClickHouse cluster and on the cold storage disks are equally available in the KUMA web console. For example, when you search for events or view events related to alerts.
- You can disable the storage of events or audit events on cold storage disks. To do so, specify the following in storage settings:
- If you do not want to store events on cold storage disks, do one of the following:
- If in the Storage condition options field, you have a gigabyte or percentage based storage condition selected, in the Event retention time, specify
0. - If in the Storage condition options field, you have a storage condition in days, in the Event retention time field, specify the same number of days as in the Storage condition options field.
- If in the Storage condition options field, you have a gigabyte or percentage based storage condition selected, in the Event retention time, specify
- If you do not want to store audit events on cold storage disks, in the Cold storage period for audit events field, specify
0(days).
- If you do not want to store events on cold storage disks, do one of the following:
Special considerations for using HDFS disks
- Before connecting HDFS disks, create directories for each node of the ClickHouse cluster on them in the following format:
<HDFS disk host>/<shard ID>/<replica ID>. For example, if a cluster consists of two nodes containing two replicas of the same shard, the following directories must be created:- hdfs://hdfs-example-1:9000/clickhouse/1/1/
- hdfs://hdfs-example-1:9000/clickhouse/1/2/
Events from the ClickHouse cluster nodes are migrated to the directories with names containing the IDs of their shard and replica. If you change these node settings without creating a corresponding directory on the HDFS disk, events may be lost during migration.
- HDFS disks added to storage operate in the JBOD mode. This means that if one of the disks fails, access to the storage will be lost. When using HDFS, take high availability into account and configure RAID, as well as storage of data from different replicas on different devices.
- The speed of event recording to HDFS is usually lower than the speed of event recording to local disks. The speed of accessing events in HDFS, as a rule, is significantly lower than the speed of accessing events on local disks. When using local disks and HDFS disks at the same time, the data is written to them in turn.
- HDFS is used only as distributed file data storage of ClickHouse. Compression mechanisms of ClickHouse, not HDFS, are used to compress data.
- The ClickHouse server must have write access to the corresponding HDFS storage.
Removing cold storage disks
Before physically disconnecting cold storage disks, remove these disks from the storage settings.
To remove a disk from the storage settings:
- In the KUMA Console, under Resources → Storages, select the relevant storage.
This opens the storage.
- In the window, in the Disks for cold storage section, in the required disk's group of settings, click Delete disk.
Data from removed disk is automatically migrated to other cold storage disks or, if there are no such disks, to the ClickHouse cluster. While data is being migrated, the status icon of the storage turns yellow and an hourglass icon is displayed. Audit events are generated when data transfer starts and ends.
- After event migration is complete, the disk is automatically removed from the storage settings. It can now be safely disconnected.
Removed disks can still contain events. If you want to delete them, you can manually delete the data partitions using the DROP PARTITION command.
If the cold storage disk specified in the storage settings has become unavailable (for example, out of order), this may lead to errors in the operation of the storage service. In this case, create a disk with the same path (for local disks) or the same address (for HDFS disks) and then delete it from the storage settings.
Page top
Detaching, archiving, and attaching partitions
If you want to optimize disk space and speed up queries in KUMA, you can detach data partitions in ClickHouse, archive partitions, or move partitions to a drive. If necessary, you can later reattach the partitions you need and perform data processing.
Detaching partitions
To detach partitions:
- Determine the shard on all replicas of which you want to detach the partition.
- Get the partition ID using the following command:
sudo /opt/kaspersky/kuma/clickhouse/bin/client.sh -d kuma --multiline --query "SELECT partition, name FROM system.parts;" |grep 20231130In this example, the command returns the partition ID for November 30, 2023.
- One each replica of the shard, detach the partition using the following command and specifying the partition ID:
sudo /opt/kaspersky/kuma/clickhouse/bin/client.sh -d kuma --multiline --query "ALTER TABLE events_local_v2 DETACH PARTITION ID '<partition ID>'"
As a result, the partition is detached on all replicas of the shard. Now you can move the data directory to a drive or archive the partition.
Archiving partitions
To archive detached partitions:
- Find the detached partition in disk subsystem of the server:
sudo find /opt/kaspersky/kuma/clickhouse/data/ -name <ID of the detached partition>\* Change to the 'detached' directory that contains the detached partition, and while in the 'detached' directory, perform the archival:sudo cd <path to the 'detached' directory containing the detached partition>sudo zip -9 -r detached.zip *For example:
sudo cd /opt/kaspersky/kuma/clickhouse/data/store/d5b/d5bdd8d8-e1eb-4968-95bd-d8d8e1eb3968/detached/sudo zip -9 -r detached.zip *
The partition is archived.
Attaching partitions
To attach archived partitions to KUMA:
- Increase the Retention period value.
KUMA deletes data based on the date specified in the Timestamp field, which records the time when the event is received, and based on the Retention period value that you set for the storage.
Before restoring archived data, make sure that the Retention period value overlaps the date in the Timestamp field. If this is not the case, the archived data will be deleted within 1 hour.
- Place the archive partition in the 'detached' section of your storage and unpack the archive:
sudounzip detached.zip -d<path to the 'detached' directory>For example:
sudounzip detached.zip -d/opt/kaspersky/kuma/clickhouse/data/store/d5b/d5bdd8d8-e1eb-4968-95bd-d8d8e1eb3968/detached/ - Run the command to attach the partition:
sudo /opt/kaspersky/kuma/clickhouse/bin/client.sh -d kuma --multiline --query "ALTER TABLE events_local_v2 ATTACH PARTITION ID '<partition ID>'"Repeat the steps of unpacking the archive and attaching the partition on each replica of the shard.
As a result, the archived partition is attached and its events are again available for search.
Page top
Creating a set of resources for a storage
In the KUMA Console, a storage service is created based on the set of resources for the storage.
To create a set of resources for a storage in the KUMA Console:
- In the KUMA Console, under Resources → Storages, click Add storage.
This opens the Create storage window.
- On the Basic settings tab, in the Storage name field, enter a unique name for the service you are creating. The name must contain 1 to 128 Unicode characters.
- In the Tenant drop-down list, select the tenant that will own the storage.
- In the Tags drop-down list, select the tags for the resource set that you are creating.
The list includes all available tags created in the tenant of the resource and in the Shared tenant. You can find a tag in the list by typing its name in the field. If the tag you entered does not exist, you can press Enter or click Add to create it.
- You can optionally add up to 256 Unicode characters describing the service in the Description field.
- In the Storage condition options field, select an event storage condition in the ClickHouse cluster for the storage, which, when satisfied, will cause events to be transferred to cold storage disks or deleted if cold storage is not configured or is configured incorrectly. The condition is applied to the default space and to events from deleted spaces.
By default, ClickHouse moves events to cold storage disks or deletes them if more than 97% of the storage is full. KUMA also applies an additional 365 days storage condition when creating a storage. You can configure custom storage conditions for more stable performance of the storage.
To set the storage condition, do one of the following:
- If you want to limit the storage period for events, select Days from the drop-down list, and in the field, specify the maximum event storage period (in days) in the ClickHouse hot storage cluster.
After the specified period, events are automatically transferred to cold storage disks or deleted from the ClickHouse cluster, starting with the partitions with the oldest date. The minimum value is 1. The default value is 365.
- If you want to limit the maximum storage size, select GB from the drop-down list, and in the field, specify the maximum storage size in gigabytes.
When the storage reaches the specified size, events are automatically transferred to cold storage disks or deleted from the ClickHouse cluster, starting with the partitions with the oldest date. The minimum value and default value is 1.
- If you want to limit the storage size to a percentage of disk space that is available to the storage (according to VictoriaMetrics), select Percentage from the drop-down list, and in the field, specify the maximum storage size as a percentage of the available disk space. In this case, the condition can also be triggered when the disk space available to the storage is decreased.
When the storage reaches the specified percentage of disk space available to it, events are automatically transferred to cold storage disks or deleted from the ClickHouse cluster, starting with the partitions with the oldest date. Possible values: 1 to 95. The default value is 80. If you want to use percentages for all storage spaces, the sum total of percentages in the conditions of all spaces may not exceed 95, but we recommend specifying a limit of at most 90% for the entire storage or for individual spaces.
We do not recommend specifying small percentage values because this increases the probability of data loss in the storage.
For [OOTV] Storage, the default event storage period is 2 days. If you want to use this storage, you can change the event storage condition for it, if necessary.
- If you want to limit the storage period for events, select Days from the drop-down list, and in the field, specify the maximum event storage period (in days) in the ClickHouse hot storage cluster.
- If you want to use an additional storage condition, click Add storage condition and specify an additional storage condition as described in step 6.
The maximum number of conditions is two, and you can combine only conditions the following types:
- Days and storage size in GB
- Days and storage size as a percentage
If you want to delete a storage condition, click the X icon next to this condition.
- In the Audit retention period field, specify the period, in days, to store audit events. The minimum value and default value is
365. - If cold storage is required, specify the event storage term:
- Event retention time specifies the total KUMA event storage duration in days, counting from the moment when the event is received. When the specified period expires, events are automatically deleted from the cold storage disk. The default value is 0.
The event retention time is calculated as the sum of the event retention time in the ClickHouse hot storage cluster until the condition specified in the Storage condition options setting is triggered, and the event retention time on the cold storage disk. After one of storage conditions is triggered, the data partition for the earliest date is moved to the cold storage disk, and there it remains until the event retention time in KUMA expires.
Depending on the specified storage condition, the resulting retention time is as follows:
- If you specified a storage condition in days, the Event retention time must be strictly greater than the number of days specified in the storage condition. You can calculate the cold storage duration for events as the Event retention time minus the number of days specified in the Storage condition options setting.
If you do not want to store events on the cold storage disk, you can specify the same number of days in the Event retention time field as in the storage condition.
- If you specified the storage condition in terms of disk size (absolute or percentage), the minimum value of the Event retention time is 1. The cold storage duration for events is calculated as Event retention time minus the number of days from the receipt of the event to triggering of the condition and the disk partition filling up, but until the condition is triggered, calculating an exact duration is impossible. In this case, we recommend specifying a relatively large value for Event retention time to avoid events being deleted.
If you do not want to store events on the cold storage disk, you can set Event retention time to 0.
- If you specified a storage condition in days, the Event retention time must be strictly greater than the number of days specified in the storage condition. You can calculate the cold storage duration for events as the Event retention time minus the number of days specified in the Storage condition options setting.
- Audit cold retention period—the number of days to store audit events. The minimum value is 0.
The Event retention time and Audit cold retention period settings become available only after at least one cold storage disk has been added.
- Event retention time specifies the total KUMA event storage duration in days, counting from the moment when the event is received. When the specified period expires, events are automatically deleted from the cold storage disk. The default value is 0.
- If you want to change ClickHouse settings, in the ClickHouse configuration override field, paste the lines with settings from the ClickHouse configuration XML file /opt/kaspersky/kuma/clickhouse/cfg/config.xml. Specifying the root elements <yandex>, </yandex> is not required. Settings passed in this field are used instead of the default settings.
Example:
<merge_tree>
<parts_to_delay_insert>600</parts_to_delay_insert>
<parts_to_throw_insert>1100</parts_to_throw_insert>
</merge_tree>
- Use the Debug toggle switch to specify whether resource logging must be enabled. If you want to only log errors for all KUMA components, disable debugging. If you want to get detailed information in the logs, enable debugging.
- If necessary, in the ClickHouse cluster nodes section, add ClickHouse cluster nodes to the storage.
There can be multiple nodes. You can add nodes by clicking the Add node button or remove nodes by clicking the X icon of the relevant node.
Available settings:
- In the FQDN field, enter the fully qualified domain name of the node that you want to add. For example,
kuma-storage-cluster1-server1.example.com. - In the Shard ID, Replica ID, and Keeper ID fields, specify the role of the node in the ClickHouse cluster. The shard and keeper IDs must be unique within the cluster, the replica ID must be unique within the shard. The following example shows how to populate the ClickHouse cluster nodes section for a storage with dedicated keepers in a distributed installation. You can adapt the example to suit your needs.
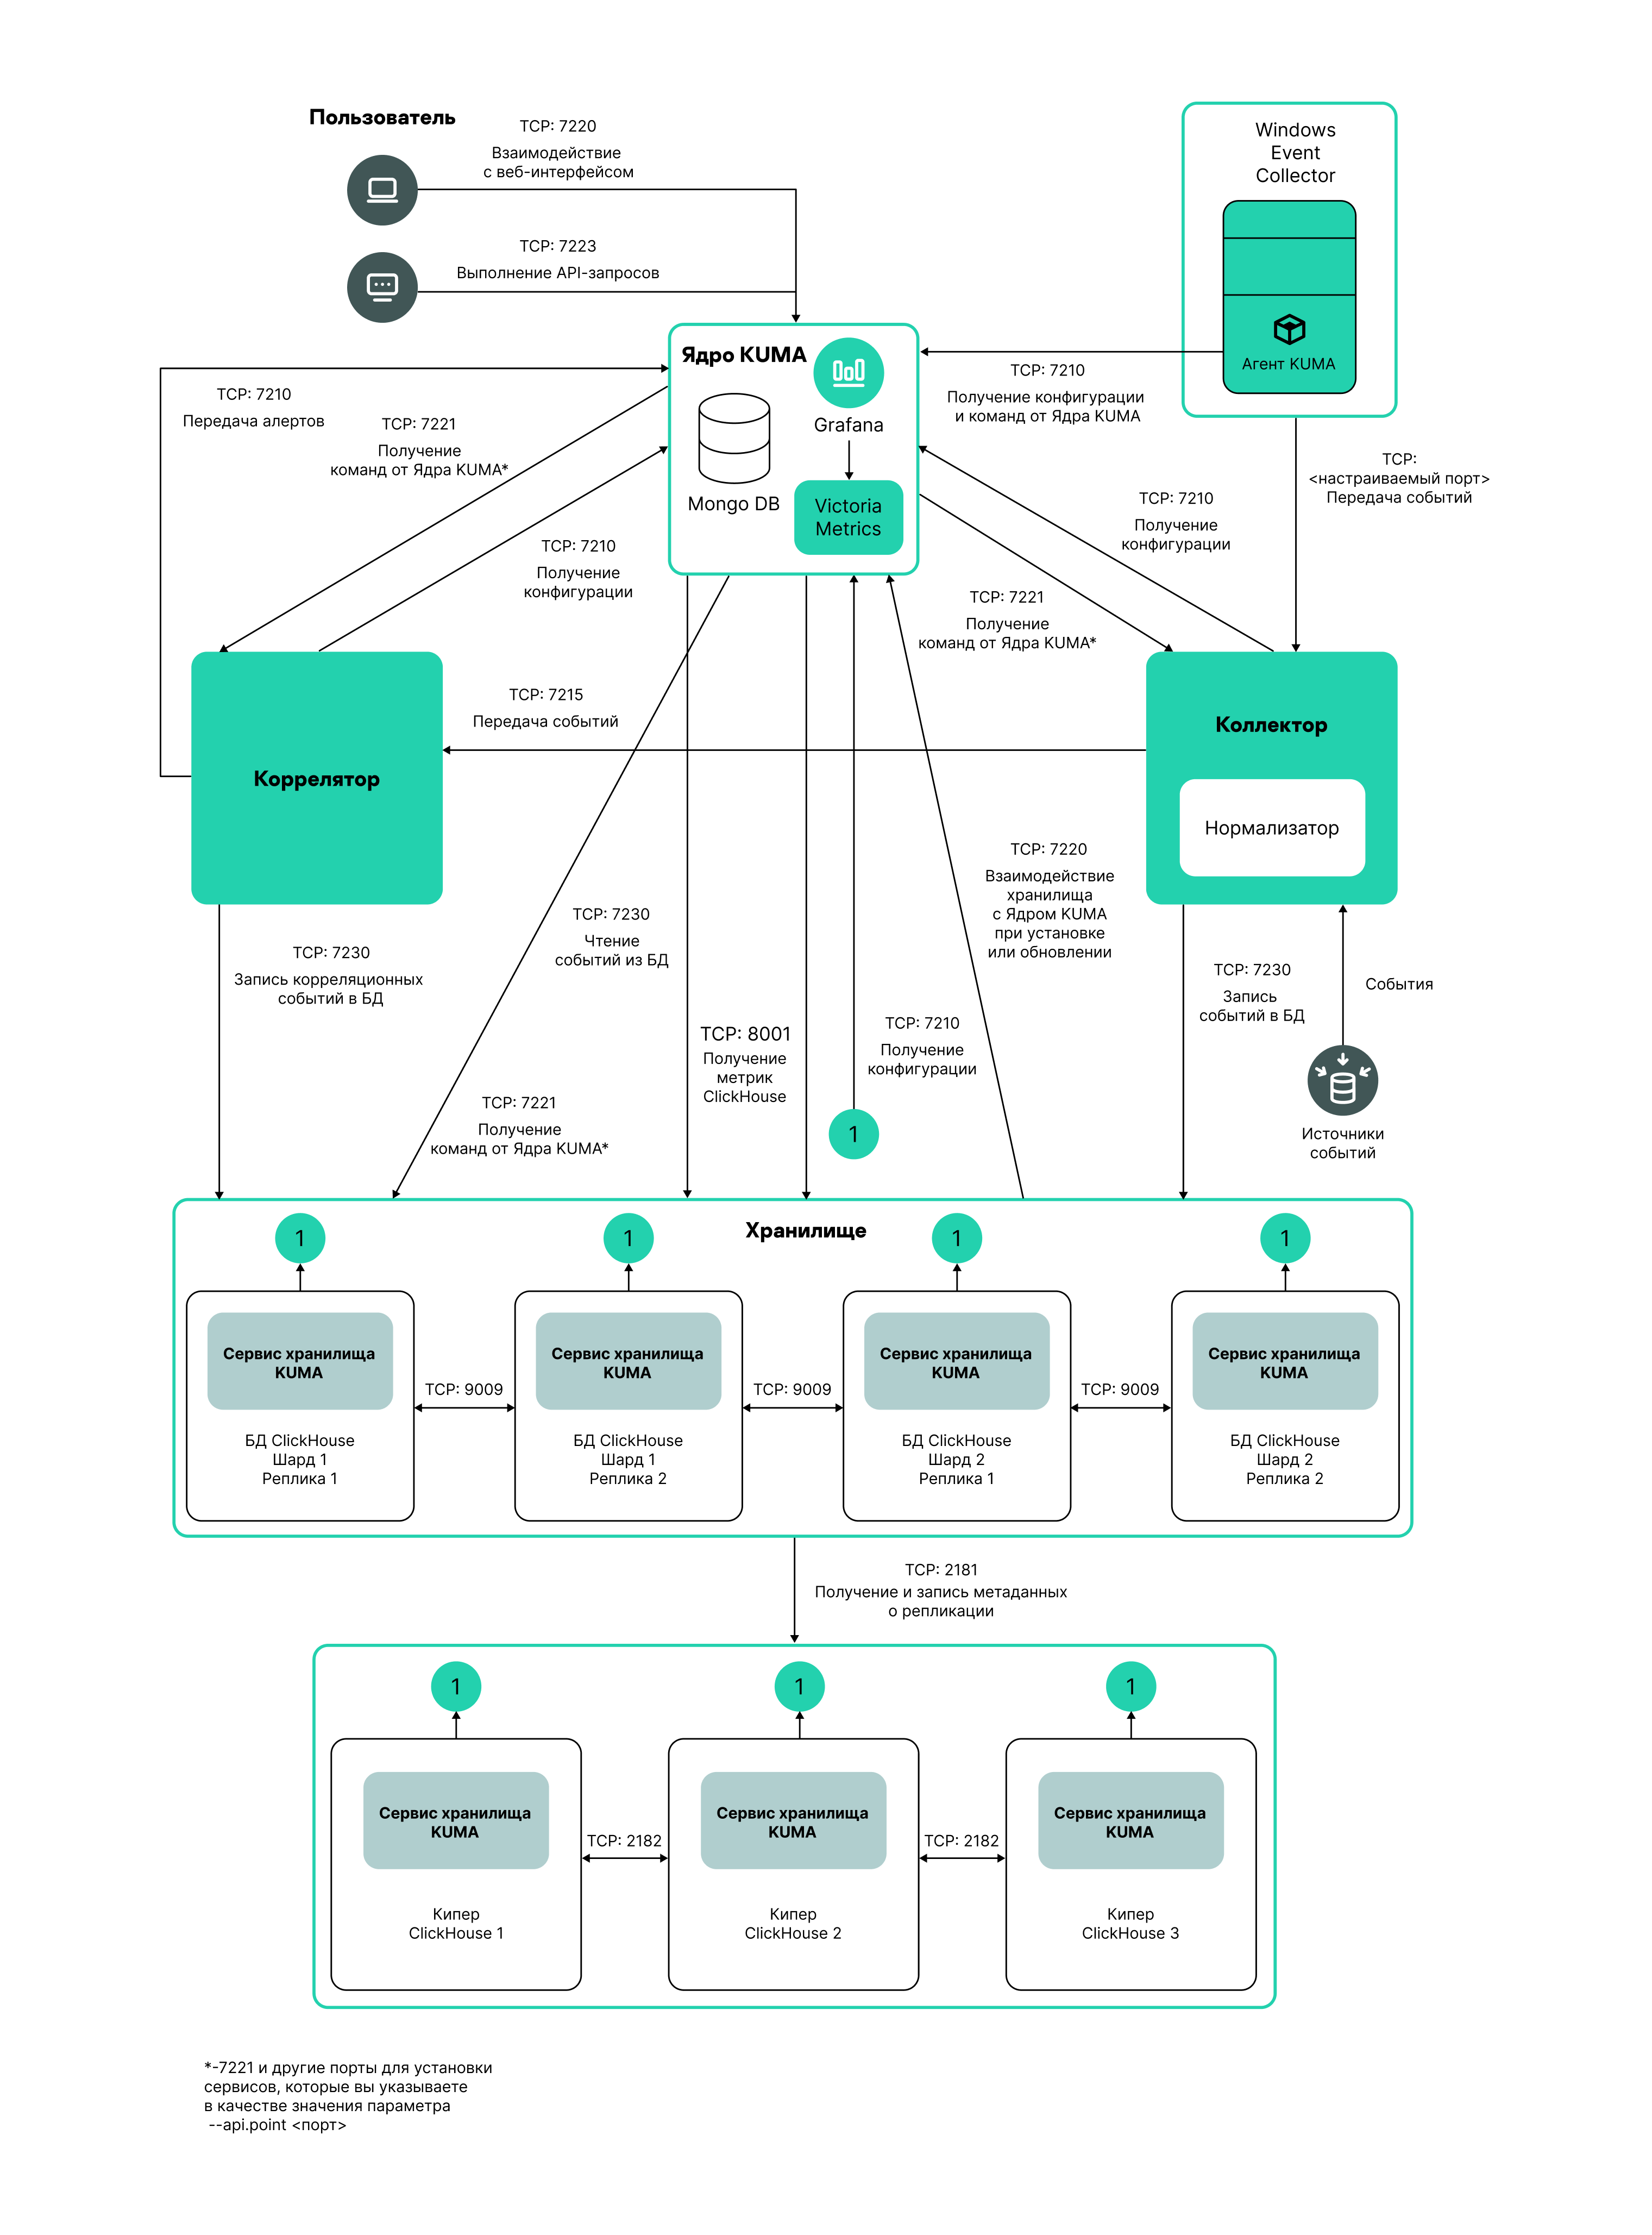
Distributed Installation diagram
Example:
ClickHouse cluster nodes
FQDN: kuma-storage-cluster1-server1.example.com
Shard ID: 0
Replica ID: 0
Keeper ID: 1
FQDN: kuma-storage-cluster1server2.example.com
Shard ID: 0
Replica ID: 0
Keeper ID: 2
FQDN: kuma-storage-cluster1server3.example.com
Shard ID: 0
Replica ID: 0
Keeper ID: 3
FQDN: kuma-storage-cluster1server4.example.com
Shard ID: 1
Replica ID: 1
Keeper ID: 0
FQDN: kuma-storage-cluster1server5.example.com
Shard ID: 1
Replica ID: 2
Keeper ID: 0
FQDN: kuma-storage-cluster1server6.example.com
Shard ID: 2
Replica ID: 1
Keeper ID: 0
FQDN: kuma-storage-cluster1server7.example.com
Shard ID: 2
Replica ID: 2
Keeper ID: 0
- In the FQDN field, enter the fully qualified domain name of the node that you want to add. For example,
- If necessary, in the Spaces section, add spaces to the storage to distribute the stored events.
There can be multiple spaces. You can add spaces by clicking the Add space button or remove spaces by clicking the X icon of the relevant space.
Available settings:
- In the Name field, specify a name for the space containing 1 to 128 Unicode characters.
- In the Storage condition options field, select an event storage condition in the ClickHouse cluster for the space, which, when satisfied, will cause events to be transferred to cold storage disks or deleted if cold storage is not configured or is configured incorrectly. KUMA applies the 365 days storage condition when a space is added.
To set the storage condition for a space, do one of the following:
- If you want to limit the storage period for events, select Days from the drop-down list, and in the field, specify the maximum event storage period (in days) in the ClickHouse hot storage cluster.
After the specified period, events are automatically transferred to cold storage disks or deleted from the ClickHouse cluster, starting with the partitions with the oldest date. The minimum value is 1. The default value is 365.
- If you want to limit the maximum storage space size, select GB from the drop-down list, and in the field, specify the maximum space size in gigabytes.
When the space reaches the specified size, events are automatically transferred to cold storage disks or deleted from the ClickHouse cluster, starting with the partitions with the oldest date. The minimum value and default value is 1.
- If you want to limit the space size to a percentage of disk space that is available to the storage (according to VictoriaMetrics), select Percentage from the drop-down list, and in the field, specify the maximum space size as a percentage of the size of the disk available to the storage. In this case, the condition can also be triggered when the disk space available to the storage is decreased.
When the space reaches the specified percentage of disk space available to the storage, events are automatically transferred to cold storage disks or deleted from the ClickHouse cluster, starting with the partitions with the oldest date. Possible values: 1 to 95. The default value is 80. If you want to use percentages for all storage spaces, the sum total of percentages in the conditions of all spaces may not exceed 95, but we recommend specifying a limit of at most 90% for the entire storage or for individual spaces.
We do not recommend specifying small percentage values because this increases the probability of data loss in the storage.
When using size as the storage condition, you must ensure that the total size of all spaces specified in the storage conditions does not exceed the physical size of the storage, otherwise an error will be displayed when starting the service.
In storage conditions with a size limitation, use the same units of measure for all spaces of a storage (only gigabytes or only percentage values). Otherwise, if the condition is specified as a percentage for one space, and in gigabytes for another space, the storage may overflow due to mismatch of values, leading to data loss.
- If you want to limit the storage period for events, select Days from the drop-down list, and in the field, specify the maximum event storage period (in days) in the ClickHouse hot storage cluster.
- If you want to make a space inactive if it is outdated and no longer relevant, select the Read only check box.
This prevents events from going into that space. To make the space active again, clear the Read only check box. This check box is cleared by default.
- If necessary, in the Event retention time field, specify the total KUMA event storage duration in days, counting from the moment when the event is received. When the specified period expires, events are automatically deleted from the cold storage disk. The default value is 0.
The event retention time is calculated as the sum of the event retention time in the ClickHouse hot storage cluster until the condition specified in the Storage condition options setting is triggered, and the event retention time on the cold storage disk. After one of storage conditions is triggered, the data partition for the earliest date is moved to the cold storage disk, and there it remains until the event retention time in KUMA expires.
Depending on the specified storage condition, the resulting retention time is as follows:
- If you specified a storage condition in days, the Event retention time must be strictly greater than the number of days specified in the storage condition. The cold storage duration for events is calculated as the Event retention time minus the number of days specified in the Storage condition options setting.
If you do not want to store events from this space on the cold storage disk, you can specify the same number of days in the Event retention time field as in the storage condition.
- If you specified the storage condition in terms of disk size (absolute or percentage), the minimum value of the Event retention time is 1. The cold storage duration for events is calculated as Event retention time minus the number of days from the receipt of the event to triggering of the condition and the disk partition filling up, but until the condition is triggered, calculating an exact duration is impossible. In this case, we recommend specifying a relatively large value for Event retention time to avoid events being deleted.
If you do not want to store events from this space on the cold storage disk, you can set Event retention time to 0.
The Event retention time setting becomes available only after adding at least one cold storage disk.
- If you specified a storage condition in days, the Event retention time must be strictly greater than the number of days specified in the storage condition. The cold storage duration for events is calculated as the Event retention time minus the number of days specified in the Storage condition options setting.
- In the Filter settings section, you can specify conditions to identify events that will be put into this space. To create a new filter, in the Filter drop-down list, select an existing filter or Create new.
Creating a filter in resources
To create a filter:
- In the Filter drop-down list, select Create new.
- If you want to keep the filter as a separate resource, select the Save filter check box. In this case, you will be able to use the created filter in various services. This check box is cleared by default.
- If you selected the Save filter check box, enter a name for the created filter resource in the Name field. Maximum length of the name: 128 Unicode characters.
- In the Conditions settings block, specify the conditions that the events must meet:
- Click the Add condition button.
- In the Left operand and Right operand drop-down lists, specify the search parameters. Depending on the data source selected in the Right operand field, there may be fields of additional parameters for identifying the value to be passed to the filter. For example, when you select active list, you must specify the name of the active list, the entry key, and the entry key field.
- In the operator drop-down list, select an operator.
- If you want the operator to be case-insensitive, select the do not match case check box. The selection of this check box does not apply to the InSubnet, InActiveList, InCategory or InActiveDirectoryGroup operators. This check box is cleared by default.
- If you want to add a negative condition, select If not from the If drop-down list.
You can add multiple conditions or a group of conditions.
- If you have added multiple conditions or groups of conditions, choose a selection condition (and, or, not) by clicking the AND button.
- If you want to add existing filters that are selected from the Select filter drop-down list, click the Add filter button. You can view the nested filter settings by clicking the
 button.
After the service is created, you can view and delete spaces in the storage resource settings.
There is no need to create a separate space for audit events. Events of this type (Type=4) are automatically placed in a separate Audit space with a storage term of at least 365 days. This space cannot be edited or deleted from the KUMA Console.
- If necessary, in the Disks for cold storage section, add to the storage the disks where you want to transfer events from the ClickHouse cluster for long-term storage.
There can be multiple disks. You can add disks by clicking the Add disk button and remove them by clicking the Delete disk button.
Available settings:
- In the FQDN drop-down list, select the type of domain name of the disk you are connecting:
- Local—for the disks mounted in the operating system as directories.
- HDFS—for the disks of the Hadoop Distributed File System.
- In the Name field, specify the disk name. The name must contain 1 to 128 Unicode characters.
- If you select the Local domain name type for the disk, specify the absolute directory path of the mounted local disk in the Path field. The path must begin and end with a "/" character.
- If you select HDFS domain name type for the disk, specify the path to HDFS in the Host field. For example,
hdfs://hdfs1:9000/clickhouse/.
- In the FQDN drop-down list, select the type of domain name of the disk you are connecting:
- Go to the Advanced settings tab and fill in the following fields:
- In the Buffer size field, enter the buffer size in bytes at which events must be sent to the database. The default value is 64 MB. No maximum value is configured. If the virtual machine has less free RAM than the specified Buffer size, KUMA sets the limit to 128 MB.
- In the Buffer flush interval field, enter the time in seconds for which KUMA waits for the buffer to fill up. If the buffer is not full, but the specified time has passed, KUMA sends events to the database. The default value is 1 second.
- In the Disk buffer size limit field, enter a value in bytes. The disk buffer is used to temporarily store events that could not be sent for further processing or storage. If the disk space allocated for the disk buffer is exhausted, events are rotated as follows: new events replace the oldest events written to the buffer. The default value is 10 GB.
- Use the Disk buffer toggle switch to enable or disable the disk buffer. By default, the disk buffer is enabled.
- Use the Write to local database table toggle switch to enable or disable writing to the local database table. Writing is disabled by default.
If enabled, data is written only on the host on which the storage is located. We recommend using this functionality only if you have configured balancing on the collector and/or correlator — at step 6. Routing, in the Advanced settings section, the URL selection policy field is set to Round robin.
If you disable writing, the data is distributed across the shards of the cluster.
- If necessary, use the Debug toggle switch to enable logging of service operations.
- You can use the Create dump periodically toggle switch at the request of Technical Support to generate resource (CPU, RAM, etc.) utilization reports in the form of dumps.
- In the Dump settings field, you can specify the settings to be used when creating dumps. The specifics of filling in this field must be provided by Technical Support.
The set of resources for the storage is created and is displayed under Resources → Storages. Now you can create a storage service.
Page top
Creating a storage service in the KUMA Console
When a set of resources is created for a storage, you can proceed to create a storage service in KUMA.
To create a storage service in the KUMA Console:
- In the KUMA Console, under Resources → Active services, click Add service.
- In the opened Choose a service window, select the set of resources that you just created for the storage and click Create service.
The storage service is created in the KUMA Console and is displayed under Resources → Active services. Now storage services must be installed to each node of the ClickHouse cluster by using the service ID.
Page top
Installing a storage in the KUMA network infrastructure
To create a storage:
- Log in to the server where you want to install the service.
- Execute the following command:
sudo /opt/kaspersky/kuma/kuma storage --core https://<KUMA Core server FQDN>:<port used by KUMA Core for internal communication (port 7210 by default)> --id <service ID copied from the KUMA web console> --installExample:
sudo /opt/kaspersky/kuma/kuma storage --core https://kuma.example.com:7210 --id XXXXX --installWhen deploying several KUMA services on the same host, during the installation process you must specify unique ports for each component using the
--api.port <port>parameter. The following setting values are used by default:--api.port 7221. - Repeat steps 1–2 for each storage node.
Only one storage service can be installed on a host.
The storage is installed.
Page top
Creating a correlator
A correlator consists of two parts: one part is created inside the KUMA Console, and the other part is installed on the network infrastructure server intended for processing events.
Actions in the KUMA Console
A correlator is created in the KUMA Console by using the Installation Wizard, which combines the necessary resources into a set of resources for the correlator. Upon completion of the Wizard, the service is automatically created based on this set of resources.
To create a correlator in the KUMA Console:
Start the Correlator Installation Wizard:
- In the KUMA Console, under Resources, click Create correlator.
- In the KUMA Console, under Resources → Correlators, click Add correlator.
As a result of completing the steps of the Wizard, a correlator service is created in the KUMA Console.
A resource set for a correlator includes the following resources:
- Correlation rules
- Enrichment rules (if required)
- Response rules (if required)
- Destinations (normally one for sending events to a storage)
These resources can be prepared in advance, or you can create them while the Installation Wizard is running.
Actions on the KUMA correlator server
If you are installing the correlator on a server that you intend to use for event processing, you need to run the command displayed at the last step of the Installation Wizard on the server. When installing, you must specify the identifier automatically assigned to the service in the KUMA Console, as well as the port used for communication.
Testing the installation
After creating a correlator, it is recommended to make sure that it is working correctly.
Starting the Correlator Installation Wizard
To start the Correlator Installation Wizard:
- In the KUMA Console, under Resources, click Add correlator.
- In the KUMA Console, under Resources → Correlators, click Add correlator.
Follow the instructions of the Wizard.
Aside from the first and last steps of the Wizard, the steps of the Wizard can be performed in any order. You can switch between steps by using the Next and Previous buttons, as well as by clicking the names of the steps in the left side of the window.
After the Wizard completes, a resource set for the correlator is created in the KUMA Console under Resources → Correlators, and a correlator service is added under Resources → Active services.
Step 1. General correlator settings
This is a required step of the Installation Wizard. At this step, you specify the main settings of the correlator: the correlator name and the tenant that will own it.
To specify the general settings of the correlator:
- On the Basic settings tab, fill in the following fields:
- In the Name field, enter a unique name for the service you are creating. The name must contain 1 to 128 Unicode characters.
- In the Tenant drop-down list, select the tenant that will own the correlator. The tenant selection determines what resources will be available when the collector is created.
- If you return to this window from another subsequent step of the Installation Wizard and select another tenant, you will have to manually edit all the resources that you have added to the service. Only resources from the selected tenant and shared tenant can be added to the service.
- If required, specify the number of processes that the service can run concurrently in the Workers field. By default, the number of worker processes is the same as the number of vCPUs on the server where the service is installed.
- You can optionally add up to 256 Unicode characters describing the service in the Description field.
- On the Advanced settings tab, fill in the following fields:
- If necessary, use the Debug toggle switch to enable logging of service operations.
- You can use the Create dump periodically toggle switch at the request of Technical Support to generate resource (CPU, RAM, etc.) utilization reports in the form of dumps.
- In the Dump settings field, you can specify the settings to be used when creating dumps. The specifics of filling in this field must be provided by Technical Support.
General settings of the correlator are specified. Proceed to the next step of the Installation Wizard.
Page top
Step 2. Global variables
If tracking values in event fields, active lists, or dictionaries is not enough to cover some specific security scenarios, you can use global and local variables. You can use them to perform various actions on the values received by the correlators by implementing complex logic for threat detection. Variables can be assigned a specific function and then queried from correlation rules as if they were ordinary event fields, with the triggered function result received in response.
To add a global variable in the correlator,
click the Add variable button and specify the following parameters:
- In the Variable window, enter the name of the variable.
- In the Value window, enter the variable function.
When entering functions, you can use autocomplete as a list of hints with possible function names, their brief description and usage examples. You can select a function from the list and insert it together with its list of arguments into the input field.
To display the list of all hints in the field, press Ctrl+Space. Press Enter to select a function from the list. Press Tab to go to the next argument in the list of arguments of the selected function.
The global variable is added. It can be queried from correlation rules by adding the $ character in front of the variable name. There can be multiple variables. Added variables can be edited or deleted by using the  icon.
icon.
Proceed to the next step of the Installation Wizard.
Page top
Step 3. Correlation
This is an optional but recommended step of the Installation Wizard. On the Correlation tab of the Installation Wizard, select or create correlation rules. These resources define the sequences of events that indicate security-related incidents. When these sequences are detected, the correlator creates a correlation event and an alert.
If you have added global variables to the correlator, all added correlation rules can query them.
Correlation rules that are added to the set of resources for the correlator are displayed in the table with the following columns:
- Correlation rules—name of the correlation rule resource.
- Type—type of correlation rule: standard, simple, operational. The table can be filtered based on the values of this column by clicking the column header and selecting the relevant values.
- Actions—list of actions that will be performed by the correlator when the correlation rule is triggered. These actions are indicated in the correlation rule settings. The table can be filtered based on the values of this column by clicking the column header and selecting the relevant values.
Available values:
- Output—correlation events created by this correlation rule are transmitted to other correlator resources: enrichment, response rule, and then to other KUMA services.
- Edit active list—the correlation rule changes the active lists.
- Loop to correlator—the correlation event is sent to the same correlation rule for reprocessing.
- Categorization—the correlation rule changes asset categories.
- Event enrichment—the correlation rule is configured to enrich correlation events.
- Do not create alert—when a correlation event is created as a result of a correlation rule triggering, no alert is created for that. If you do not want to create an alert when a correlation rule is triggered, but you still want to send a correlation event to the storage, select the Output and No alert check boxes. If you select only the No alert check box, a correlation event is not saved in the storage.
- Shared resource—the correlation rule or the resources used in the correlation rule are located in a shared tenant.
You can use the Search field to search for a correlation rule. Added correlation rules can be removed from the set of resources by selecting the relevant rules and clicking Delete.
Selecting a correlation rule opens a window with its settings, which can be edited and then saved by clicking Save. If you click Delete in this window, the correlation rule is unlinked from the set of resources.
Use the Move up and Move down buttons to change the position of the selected correlation rules in the table. It affects their execution sequence when events are processed. Using the Move operational to top button, you can move correlation rules of the operational type to the beginning of the correlation rules list.
To link the existing correlation rules to the set of resources for the correlator:
- Click Link.
The resource selection window opens.
- Select the relevant correlation rules and click OK.
The correlation rules will be linked to the set of resources for the correlator and will be displayed in the rules table.
To create a new correlation rule in a set of resources for a correlator:
- Click Add.
The correlation rule creation window opens.
- Specify the correlation rule settings and click Save.
The correlation rule will be created and linked to the set of resources for the correlator. It is displayed in the correlation rules table and in the list of resources under Resources → Correlation rules.
Proceed to the next step of the Installation Wizard.
Page top
Step 4. Enrichment
This is an optional step of the Installation Wizard. On the Enrichment tab of the Installation Wizard, you can select or create enrichment rules and indicate which data from which sources you want to add to correlation events that the correlator creates. There can be more than one enrichment rule. You can add them by clicking the Add button and can remove them by clicking the button.
To add an existing enrichment rule to a set of resources:
- Click Add.
This opens the enrichment rule settings block.
- In the Enrichment rule drop-down list, select the relevant resource.
The enrichment rule is added to the set of resources for the correlator.
To create a new enrichment rule in a set of resources:
- Click Add.
This opens the enrichment rule settings block.
- In the Enrichment rule drop-down list, select Create new.
- In the Source kind drop-down list, select the source of data for enrichment and define its corresponding settings:
- constant
- dictionary
- event
- template
- dns
- cybertrace
This type of enrichment is deprecated, we recommend using cybertrace-http instead.
This type of enrichment is used to add information from CyberTrace data streams to event fields.
Available settings:
- URL (required)—in this field, you can specify the URL of a CyberTrace server to which you want to send requests. The default CyberTrace port is 9999.
- Number of connections—maximum number of connections to the CyberTrace server that can be simultaneously established by KUMA. By default, this value is equal to the number of vCPUs of the KUMA Core server.
- RPS—maximum number of requests sent to the server per second. The default value is
1,000. - Timeout—amount of time to wait for a response from the CyberTrace server, in seconds. The default value is
30. - Maximum number of events in the enrichment queue—maximum number of events stored in the enrichment queue for re-sending. The default value is 1,000,000,000.
- Mapping (required)—this settings block contains the mapping table for mapping KUMA event fields to CyberTrace indicator types. The KUMA field column shows the names of KUMA event fields, and the CyberTrace indicator column shows the types of CyberTrace indicators.
Available types of CyberTrace indicators:
- ip
- url
- hash
In the mapping table, you must provide at least one string. You can use the Add row button to add a string, and can use the
button to remove a string.
- cybertrace-http
- timezone
- Use the Debug toggle switch to indicate whether or not to enable logging of service operations. Logging is disabled by default.
- In the Filter section, you can specify conditions to identify events that will be processed using the enrichment rule. You can select an existing filter from the drop-down list or create a new filter.
Creating a filter in resources
To create a filter:
- In the Filter drop-down list, select Create new.
- If you want to keep the filter as a separate resource, select the Save filter check box. In this case, you will be able to use the created filter in various services. This check box is cleared by default.
- If you selected the Save filter check box, enter a name for the created filter resource in the Name field. Maximum length of the name: 128 Unicode characters.
- In the Conditions settings block, specify the conditions that the events must meet:
- Click the Add condition button.
- In the Left operand and Right operand drop-down lists, specify the search parameters. Depending on the data source selected in the Right operand field, there may be fields of additional parameters for identifying the value to be passed to the filter. For example, when you select active list, you must specify the name of the active list, the entry key, and the entry key field.
- In the operator drop-down list, select an operator.
- If you want the operator to be case-insensitive, select the do not match case check box. The selection of this check box does not apply to the InSubnet, InActiveList, InCategory or InActiveDirectoryGroup operators. This check box is cleared by default.
- If you want to add a negative condition, select If not from the If drop-down list.
You can add multiple conditions or a group of conditions.
- If you have added multiple conditions or groups of conditions, choose a selection condition (and, or, not) by clicking the AND button.
- If you want to add existing filters that are selected from the Select filter drop-down list, click the Add filter button. You can view the nested filter settings by clicking the button.
The new enrichment rule was added to the set of resources for the correlator.
Proceed to the next step of the Installation Wizard.
Page top
Step 5. Response
This is an optional step of the Installation Wizard. On the Response tab of the Installation Wizard, you can select or create response rules and indicate which actions must be performed when the correlation rules are triggered. There can be multiple response rules. You can add them by clicking the Add button and can remove them by clicking the button.
To add an existing response rule to a set of resources:
- Click Add.
The response rule settings window opens.
- In the Response rule drop-down list, select the relevant resource.
The response rule is added to the set of resources for the correlator.
To create a new response rule in a set of resources:
- Click Add.
The response rule settings window opens.
- In the Response rule drop-down list, select Create new.
- In the Type drop-down list, select the type of response rule and define its corresponding settings:
- KSC response—response rules for automatically launching the tasks on Open Single Management Platform assets. For example, you can configure automatic startup of a virus scan or database update.
Tasks are automatically started when KUMA is integrated with Open Single Management Platform. Tasks are run only on assets that were imported from Open Single Management Platform.
- Run script—response rules for automatically running a script. For example, you can create a script containing commands to be executed on the KUMA server when selected events are detected.
The script file is stored on the server where the correlator service using the response resource is installed: /opt/kaspersky/kuma/correlator/<Correlator ID>/scripts.
The
kumauser of this server requires the permissions to run the script. - KEDR response—response rules for automatically creating prevention rules, starting network isolation, or starting the application on Kaspersky Endpoint Detection and Response and Open Single Management Platform assets.
Automatic response actions are carried out when KUMA is integrated with Kaspersky Endpoint Detection and Response.
- Response via KICS/KATA—response rules for automatically starting tasks on KICS for Networks assets. For example, you can change the asset status in KICS for Networks.
Tasks are automatically started when KUMA is integrated with KICS for Networks.
- Response via Active Directory—response rules for changing the permissions of Active Directory users. For example, block a user.
Tasks are started if integration with Active Directory is configured.
- KSC response—response rules for automatically launching the tasks on Open Single Management Platform assets. For example, you can configure automatic startup of a virus scan or database update.
- In the Workers field, specify the number of processes that the service can run simultaneously.
By default, the number of workers is the same as the number of virtual processors on the server where the service is installed.
This field is optional.
- In the Filter section, you can specify conditions to identify events that will be processed using the response rule. You can select an existing filter from the drop-down list or create a new filter.
Creating a filter in resources
To create a filter:
- In the Filter drop-down list, select Create new.
- If you want to keep the filter as a separate resource, select the Save filter check box. In this case, you will be able to use the created filter in various services. This check box is cleared by default.
- If you selected the Save filter check box, enter a name for the created filter resource in the Name field. Maximum length of the name: 128 Unicode characters.
- In the Conditions settings block, specify the conditions that the events must meet:
- Click the Add condition button.
- In the Left operand and Right operand drop-down lists, specify the search parameters. Depending on the data source selected in the Right operand field, there may be fields of additional parameters for identifying the value to be passed to the filter. For example, when you select active list, you must specify the name of the active list, the entry key, and the entry key field.
- In the operator drop-down list, select an operator.
- If you want the operator to be case-insensitive, select the do not match case check box. The selection of this check box does not apply to the InSubnet, InActiveList, InCategory or InActiveDirectoryGroup operators. This check box is cleared by default.
- If you want to add a negative condition, select If not from the If drop-down list.
You can add multiple conditions or a group of conditions.
- If you have added multiple conditions or groups of conditions, choose a selection condition (and, or, not) by clicking the AND button.
- If you want to add existing filters that are selected from the Select filter drop-down list, click the Add filter button. You can view the nested filter settings by clicking the button.
The new response rule was added to the set of resources for the correlator.
Proceed to the next step of the Installation Wizard.
Page top
Step 6. Routing
This is an optional step of the Installation Wizard. On the Routing tab of the Installation Wizard, you can select or create destinations with settings indicating the forwarding destination of events created by the correlator. Events from a correlator are usually redirected to storage so that they can be saved and later viewed if necessary. Events can be sent to other locations as needed. There can be more than one destination point.
To add an existing destination to a set of resources for a correlator:
- In the Add destination drop-down list, select the type of destination resource you want to add:
- Select Storage if you want to configure forwarding of processed events to the storage.
- Select Correlator if you want to configure forwarding of processed events to a correlator.
- Select Other if you want to send events to other locations.
This type of resource includes correlator and storage services that were created in previous versions of the program.
The Add destination window opens where you can specify parameters for events forwarding.
- In the Destination drop-down list, select the necessary destination.
The window name changes to Edit destination, and it displays the settings of the selected resource. The resource can be opened for editing in a new browser tab using the
button. - Click Save.
The selected destination is displayed on the Installation Wizard tab. A destination resource can be removed from the resource set by selecting it and clicking Delete in the opened window.
To add a new destination to a set of resources for a correlator:
- In the Add destination drop-down list, select the type of destination resource you want to add:
- Select Storage if you want to configure forwarding of processed events to the storage.
- Select Correlator if you want to configure forwarding of processed events to a correlator.
- Select Other if you want to send events to other locations.
This type of resource includes correlator and storage services that were created in previous versions of the program.
The Add destination window opens where you can specify parameters for events forwarding.
- Specify the settings on the Basic settings tab:
- In the Destination drop-down list, select Create new.
- In the Name field, enter a unique name for the destination resource. The name must contain 1 to 128 Unicode characters.
- Use the Disabled toggle button to specify whether events will be sent to this destination. By default, sending events is enabled.
- Select the Type of the destination:
- Select storage if you want to configure forwarding of processed events to the storage.
- Select correlator if you want to configure forwarding of processed events to a correlator.
- Select nats-jetstream, tcp, http, kafka, or file if you want to configure sending events to other locations.
- Specify the URL to which events should be sent in the hostname:<API port> format.
You can specify multiple destination addresses using the URL button for all types except nats-jetstream and file.
- For the nats-jetstream and kafka types, use the Topic field to specify which topic the data should be written to. The topic must contain Unicode characters. The Kafka topic is limited to 255 characters.
- If necessary, specify the settings on the Advanced settings tab. The available settings vary based on the selected destination resource type:
- Compression is a drop-down list where you can enable Snappy compression. By default, compression is disabled.
- Proxy is a drop-down list for proxy server selection.
- The Buffer size field is used to set buffer size (in bytes) for the destination. The default value is 1 MB, and the maximum value is 64 MB.
- Timeout field is used to set the timeout (in seconds) for another service or component response. The default value is
30. - Disk buffer size limit field is used to specify the size of the disk buffer in bytes. The default size is 10 GB.
- Cluster ID is the ID of the NATS cluster.
- TLS mode is a drop-down list where you can specify the conditions for using TLS encryption:
- Disabled (default)—do not use TLS encryption.
- Enabled—encryption is enabled, but without verification.
- With verification—use encryption with verification that the certificate was signed with the KUMA root certificate. The root certificate and key of KUMA are created automatically during program installation and are stored on the KUMA Core server in the folder /opt/kaspersky/kuma/core/certificates/.
When using TLS, it is impossible to specify an IP address as a URL.
- URL selection policy is a drop-down list in which you can select a method for determining which URL to send events to if several URLs have been specified:
- Any. Events are sent to one of the available URLs as long as this URL receives events. If the connection is broken (for example, the receiving node is disconnected) a different URL will be selected as the events destination.
- Prefer first. Events are sent to the first URL in the list of added addresses. If it becomes unavailable, events are sent to the next available node in sequence. When the first URL becomes available again, events start to be sent to it again.
- Balanced means that packages with events are evenly distributed among the available URLs from the list. Because packets are sent either on a destination buffer overflow or on the flush timer, this URL selection policy does not guarantee an equal distribution of events to destinations.
- Delimiter is used to specify the character delimiting the events. By default,
\nis used. - Path—the file path if the file destination type is selected.
- Buffer flush interval—this field is used to set the time interval (in seconds) at which the data is sent to the destination. The default value is
100. - Workers—this field is used to set the number of services processing the queue. By default, this value is equal to the number of vCPUs of the KUMA Core server.
- You can set health checks using the Health check path and Health check timeout fields. You can also disable health checks by selecting the Health Check Disabled check box.
- Debug—a toggle switch that lets you specify whether resource logging must be enabled. By default, this toggle switch is in the Disabled position.
- The Disk buffer disabled drop-down list is used to enable or disable the use of a disk buffer. By default, the disk buffer is disabled.
- In the Filter section, you can specify the conditions to define events that will be processed by this resource. You can select an existing filter from the drop-down list or create a new filter.
Creating a filter in resources
To create a filter:
- In the Filter drop-down list, select Create new.
- If you want to keep the filter as a separate resource, select the Save filter check box. In this case, you will be able to use the created filter in various services. This check box is cleared by default.
- If you selected the Save filter check box, enter a name for the created filter resource in the Name field. Maximum length of the name: 128 Unicode characters.
- In the Conditions settings block, specify the conditions that the events must meet:
- Click the Add condition button.
- In the Left operand and Right operand drop-down lists, specify the search parameters. Depending on the data source selected in the Right operand field, there may be fields of additional parameters for identifying the value to be passed to the filter. For example, when you select active list, you must specify the name of the active list, the entry key, and the entry key field.
- In the operator drop-down list, select an operator.
- If you want the operator to be case-insensitive, select the do not match case check box. The selection of this check box does not apply to the InSubnet, InActiveList, InCategory or InActiveDirectoryGroup operators. This check box is cleared by default.
- If you want to add a negative condition, select If not from the If drop-down list.
You can add multiple conditions or a group of conditions.
- If you have added multiple conditions or groups of conditions, choose a selection condition (and, or, not) by clicking the AND button.
- If you want to add existing filters that are selected from the Select filter drop-down list, click the Add filter button. You can view the nested filter settings by clicking the button.
- Click Save.
The created destination is displayed on the Installation Wizard tab. A destination resource can be removed from the resource set by selecting it and clicking Delete in the opened window.
Proceed to the next step of the Installation Wizard.
Page top
Step 7. Setup validation
This is the required, final step of the Installation Wizard. At this step, KUMA creates a service resource set, and the Services are created automatically based on this set:
- The set of resources for the correlator is displayed under Resources → Correlators. It can be used to create new correlator services. When this set of resources changes, all services that operate based on this set of resources will start using the new parameters after the services restart. To do so, you can use the Save and restart services and Save and update service configurations buttons.
A set of resources can be modified, copied, moved from one folder to another, deleted, imported, and exported, like other resources.
- Services are displayed in Resources → Active services. The services created using the Installation Wizard perform functions inside the KUMA program. To communicate with external parts of the network infrastructure, you need to install similar external services on the servers and assets intended for them. For example, an external correlator service should be installed on a server intended to process events, external storage services should be installed on servers with a deployed ClickHouse service, and external agent services should be installed on Windows assets that must both receive and forward Windows events.
To finish the Installation Wizard:
- Click Create and save service.
The Setup validation tab of the Installation Wizard displays a table of services created based on the set of resources selected in the Installation Wizard. The lower part of the window shows examples of commands that you must use to install external equivalents of these services on their intended servers and assets.
For example:
/opt/kaspersky/kuma/kuma correlator --core https://kuma-example:<port used for communication with the KUMA Core> --id <service ID> --api.port <port used for communication with the service> --install
The "kuma" file can be found inside the installer in the /kuma-ansible-installer/roles/kuma/files/ directory.
The port for communication with the KUMA Core, the service ID, and the port for communication with the service are added to the command automatically. You should also ensure the network connectivity of the KUMA system and open the ports used by its components if necessary.
- Close the Wizard by clicking Save.
The correlator service is created in KUMA. Now the service must be installed on the server intended for processing events.
Page top
Installing a correlator in a KUMA network infrastructure
A correlator consists of two parts: one part is created inside the KUMA Console, and the other part is installed on the network infrastructure server intended for processing events. The second part of the correlator is installed in the network infrastructure.
To install a correlator:
- Log in to the server where you want to install the service.
- Execute the following command:
sudo /opt/kaspersky/kuma/kuma correlator --core https://<FQDN of the KUMA Core server:<port used by KUMA Core for internal communication (port 7210 is used by default)> --id <service ID copied from the KUMA Console> --api.port <port used for communication with the installed component> --installExample:
sudo /opt/kaspersky/kuma/kuma correlator --core https://kuma.example.com:7210 --id XXXX --api.port YYYY --installYou can copy the correlator installation command at the last step of the Installation Wizard. It automatically specifies the address and port of the KUMA Core server, the identifier of the correlator to be installed, and the port that the correlator uses for communication. Before installation, ensure the network connectivity of KUMA components.
When deploying several KUMA services on the same host, during the installation process you must specify unique ports for each component using the
--api.port <port>parameter. The following setting values are used by default:--api.port 7221.
The correlator is installed. You can use it to analyze events for threats.
Page top
Validating correlator installation
To verify that the correlator is ready to receive events:
- In the KUMA Console, open Resources → Active services.
- Make sure that the correlator you installed has the green status.
If the events that are fed into the correlator contain events that meet the correlation rule filter conditions, the events tab will show events with the DeviceVendor=Kaspersky and DeviceProduct=KUMA parameters. The name of the triggered correlation rule will be displayed as the name of these correlation events.
If no correlation events are found
You can create a simpler version of your correlation rule to find possible errors. Use a simple correlation rule and a single Output action. It is recommended to create a filter to find events that are regularly received by KUMA.
When updating, adding, or removing a correlation rule, you must update configuration of the correlator.
When you finish testing your correlation rules, you must remove all testing and temporary correlation rules from KUMA and update configuration of the correlator.
Page top
Creating an event router
An event router is a service that allows you to receive streams of events from collectors and correlators and then distribute the events to specified destinations in accordance with the configured filters.
To have events from the collector sent to the event router, you must create an 'eventRouter' destination resource with the address of the event router and link the resource to the collectors that you want to send events to the event router.
The event router receives events on the API port, just like storage and correlator destinations.
You can create a router in the Resources section.
Using an event router lets you reduce the utilization of links, which is important for low-bandwidth and busy links.
Possible use cases:
Collector — Router in the data center
The collector sends events to an event router in the data center, and the event router sends the events to the specified destinations: correlator and storage.
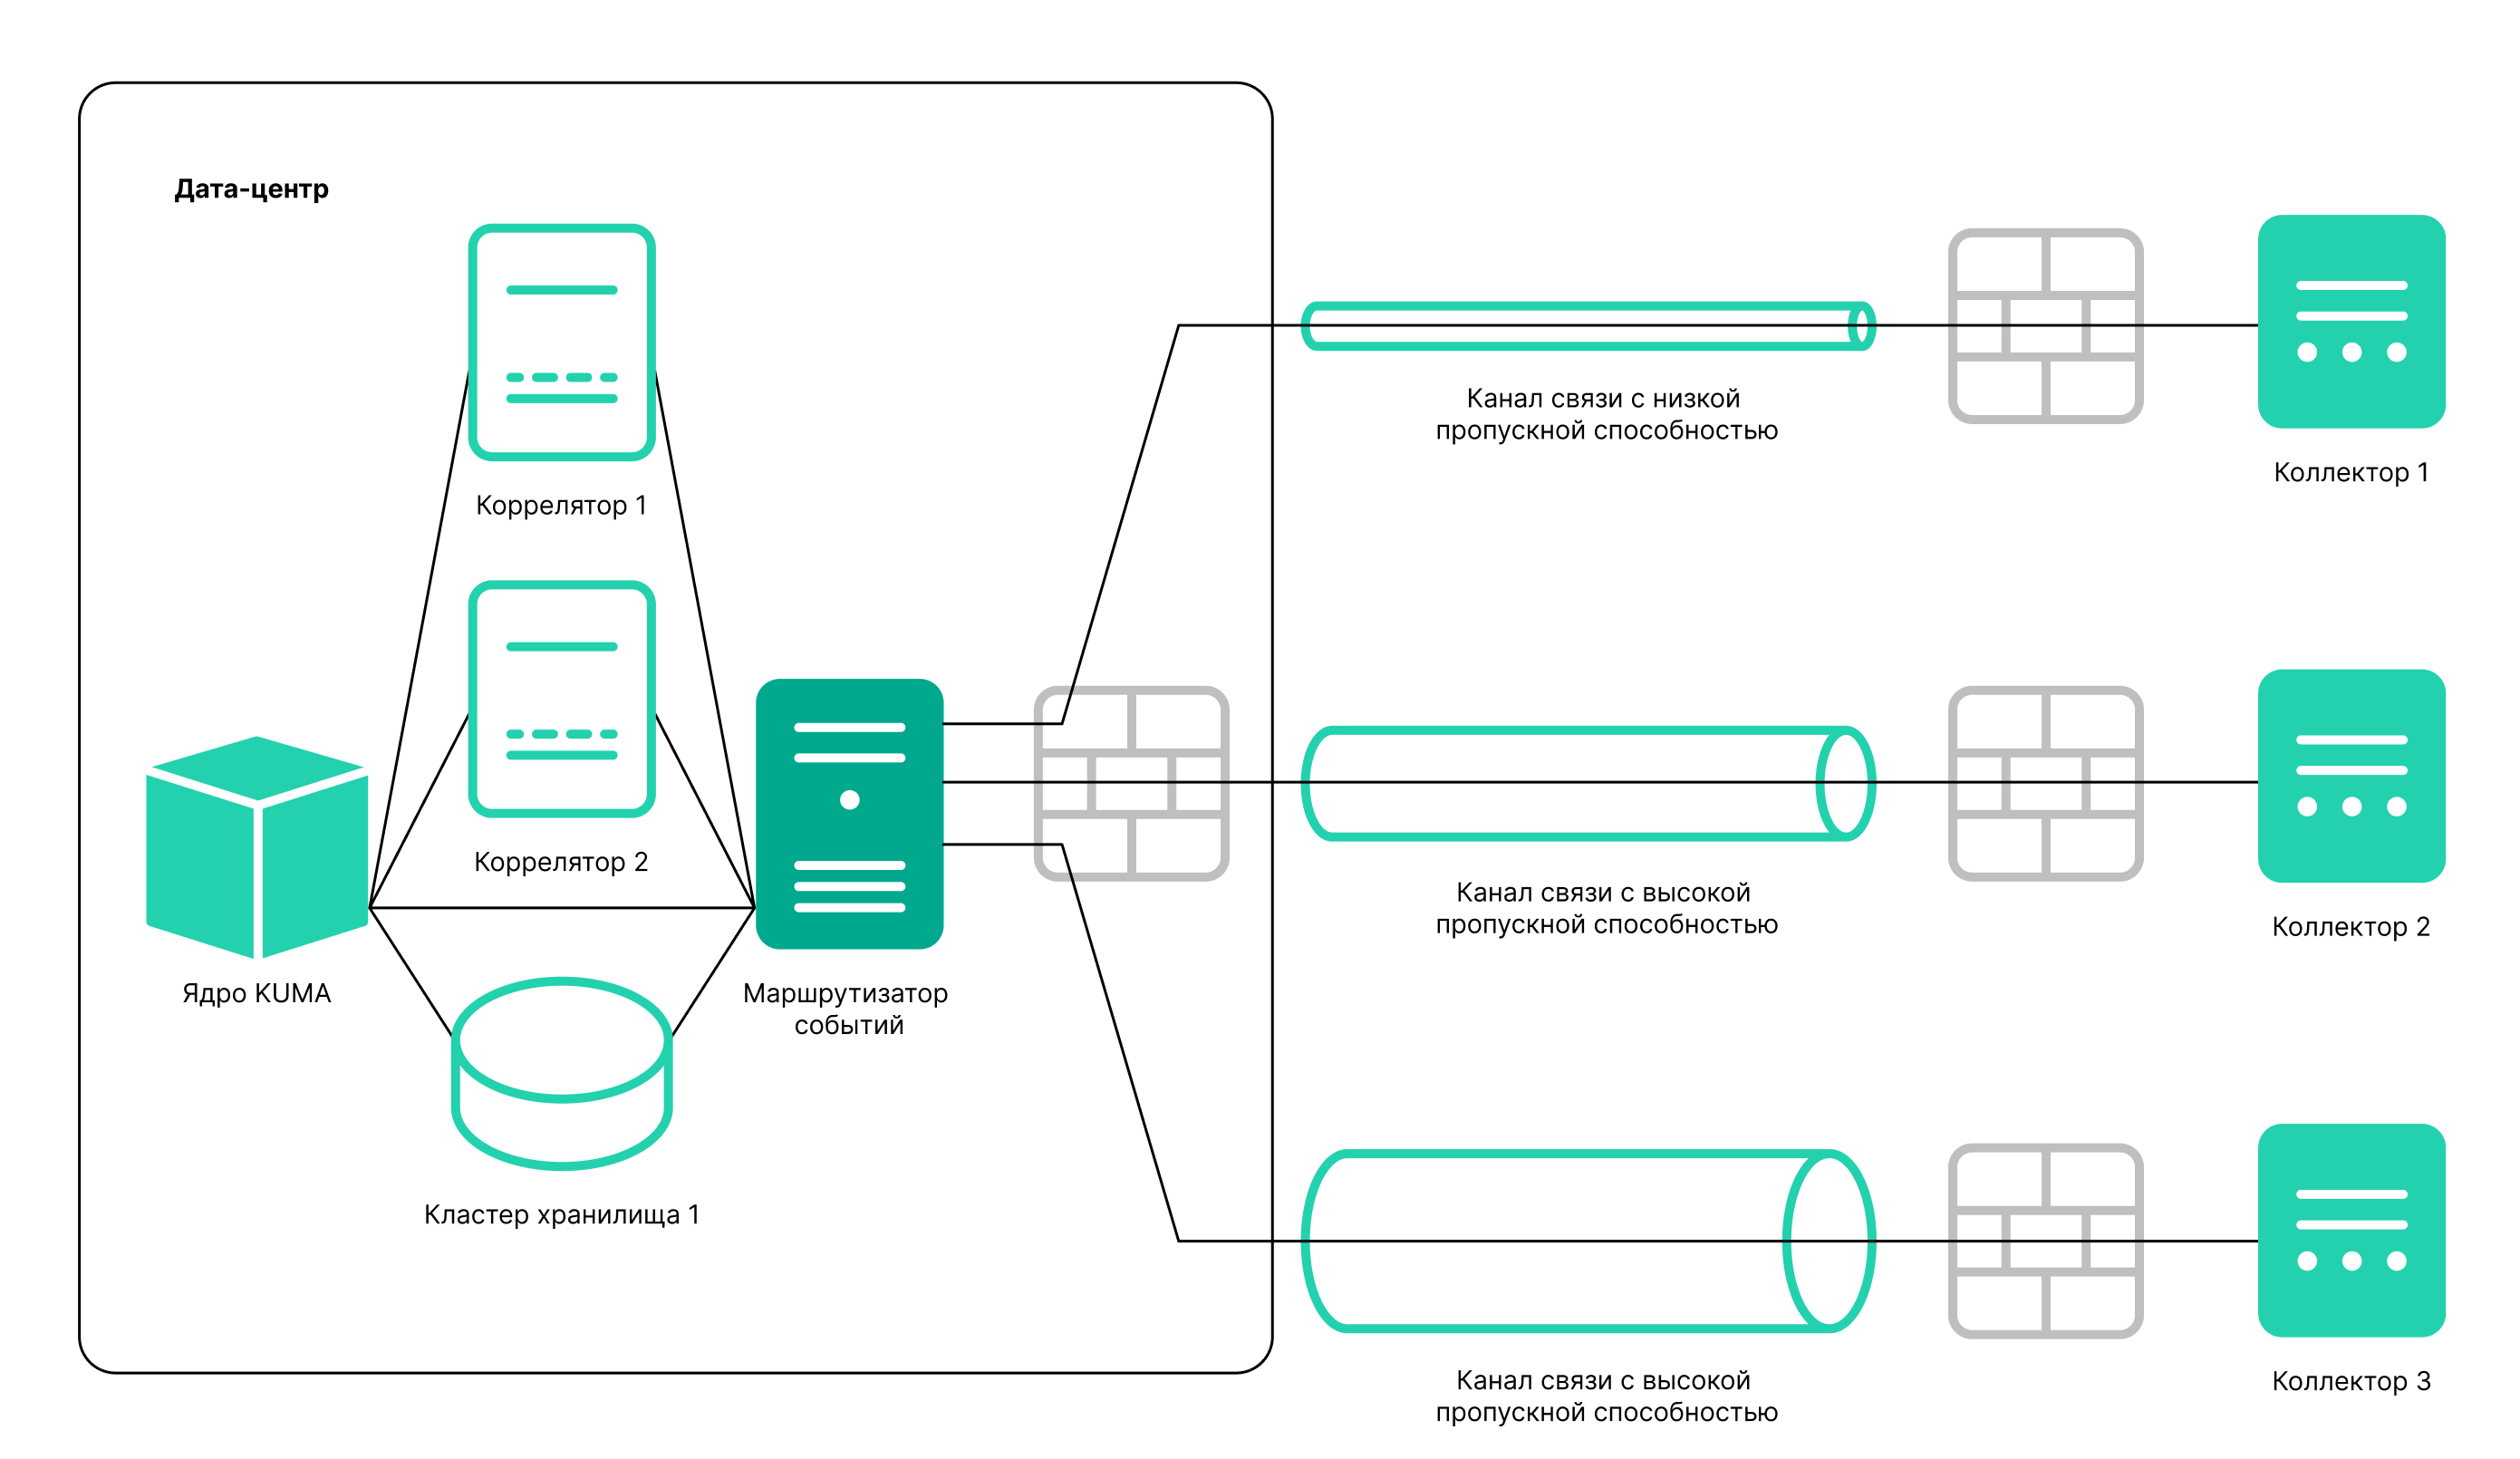
Preconditions:
- KUMA 3.2 collectors are configured at the branch offices.
- The data center has the capacity to install an event router.
- KUMA 3.2 is installed in the data center.
Steps:
- In the data center:
- Create the Event router service.
- Create storage and correlator destination points and specify them in the Event router.
- In the Event router on the Advanced settings tab, configure a filter to send events to storage and/or correlator. For example, "DeviceCustomString = correlator" or "DeviceCustomString = storage".
- Configure enrichment.
- In the collectors at branch offices:
- Create a destination of the eventRouter type.
- Specify the URL of the event router in the data center of the branch office.
- If eventRouter replaces previously configured destinations, you can delete them.
Postcondition:
- Collectors at the branch offices are configured.
- The event router in the data center is configured.
Connections of branch offices to the data center have been optimized: for each collector, you no longer need to configure events to be sent both to storage and to the correlator in the data center. This halves the load on the link.
Routing to the storage and the correlator is performed within the data center.
Multiple collectors send events to the event router at the branch office, and the event router at the branch office sends events to the router in the data center, where events are then sent to the specified destinations, that is, correlators and storage.
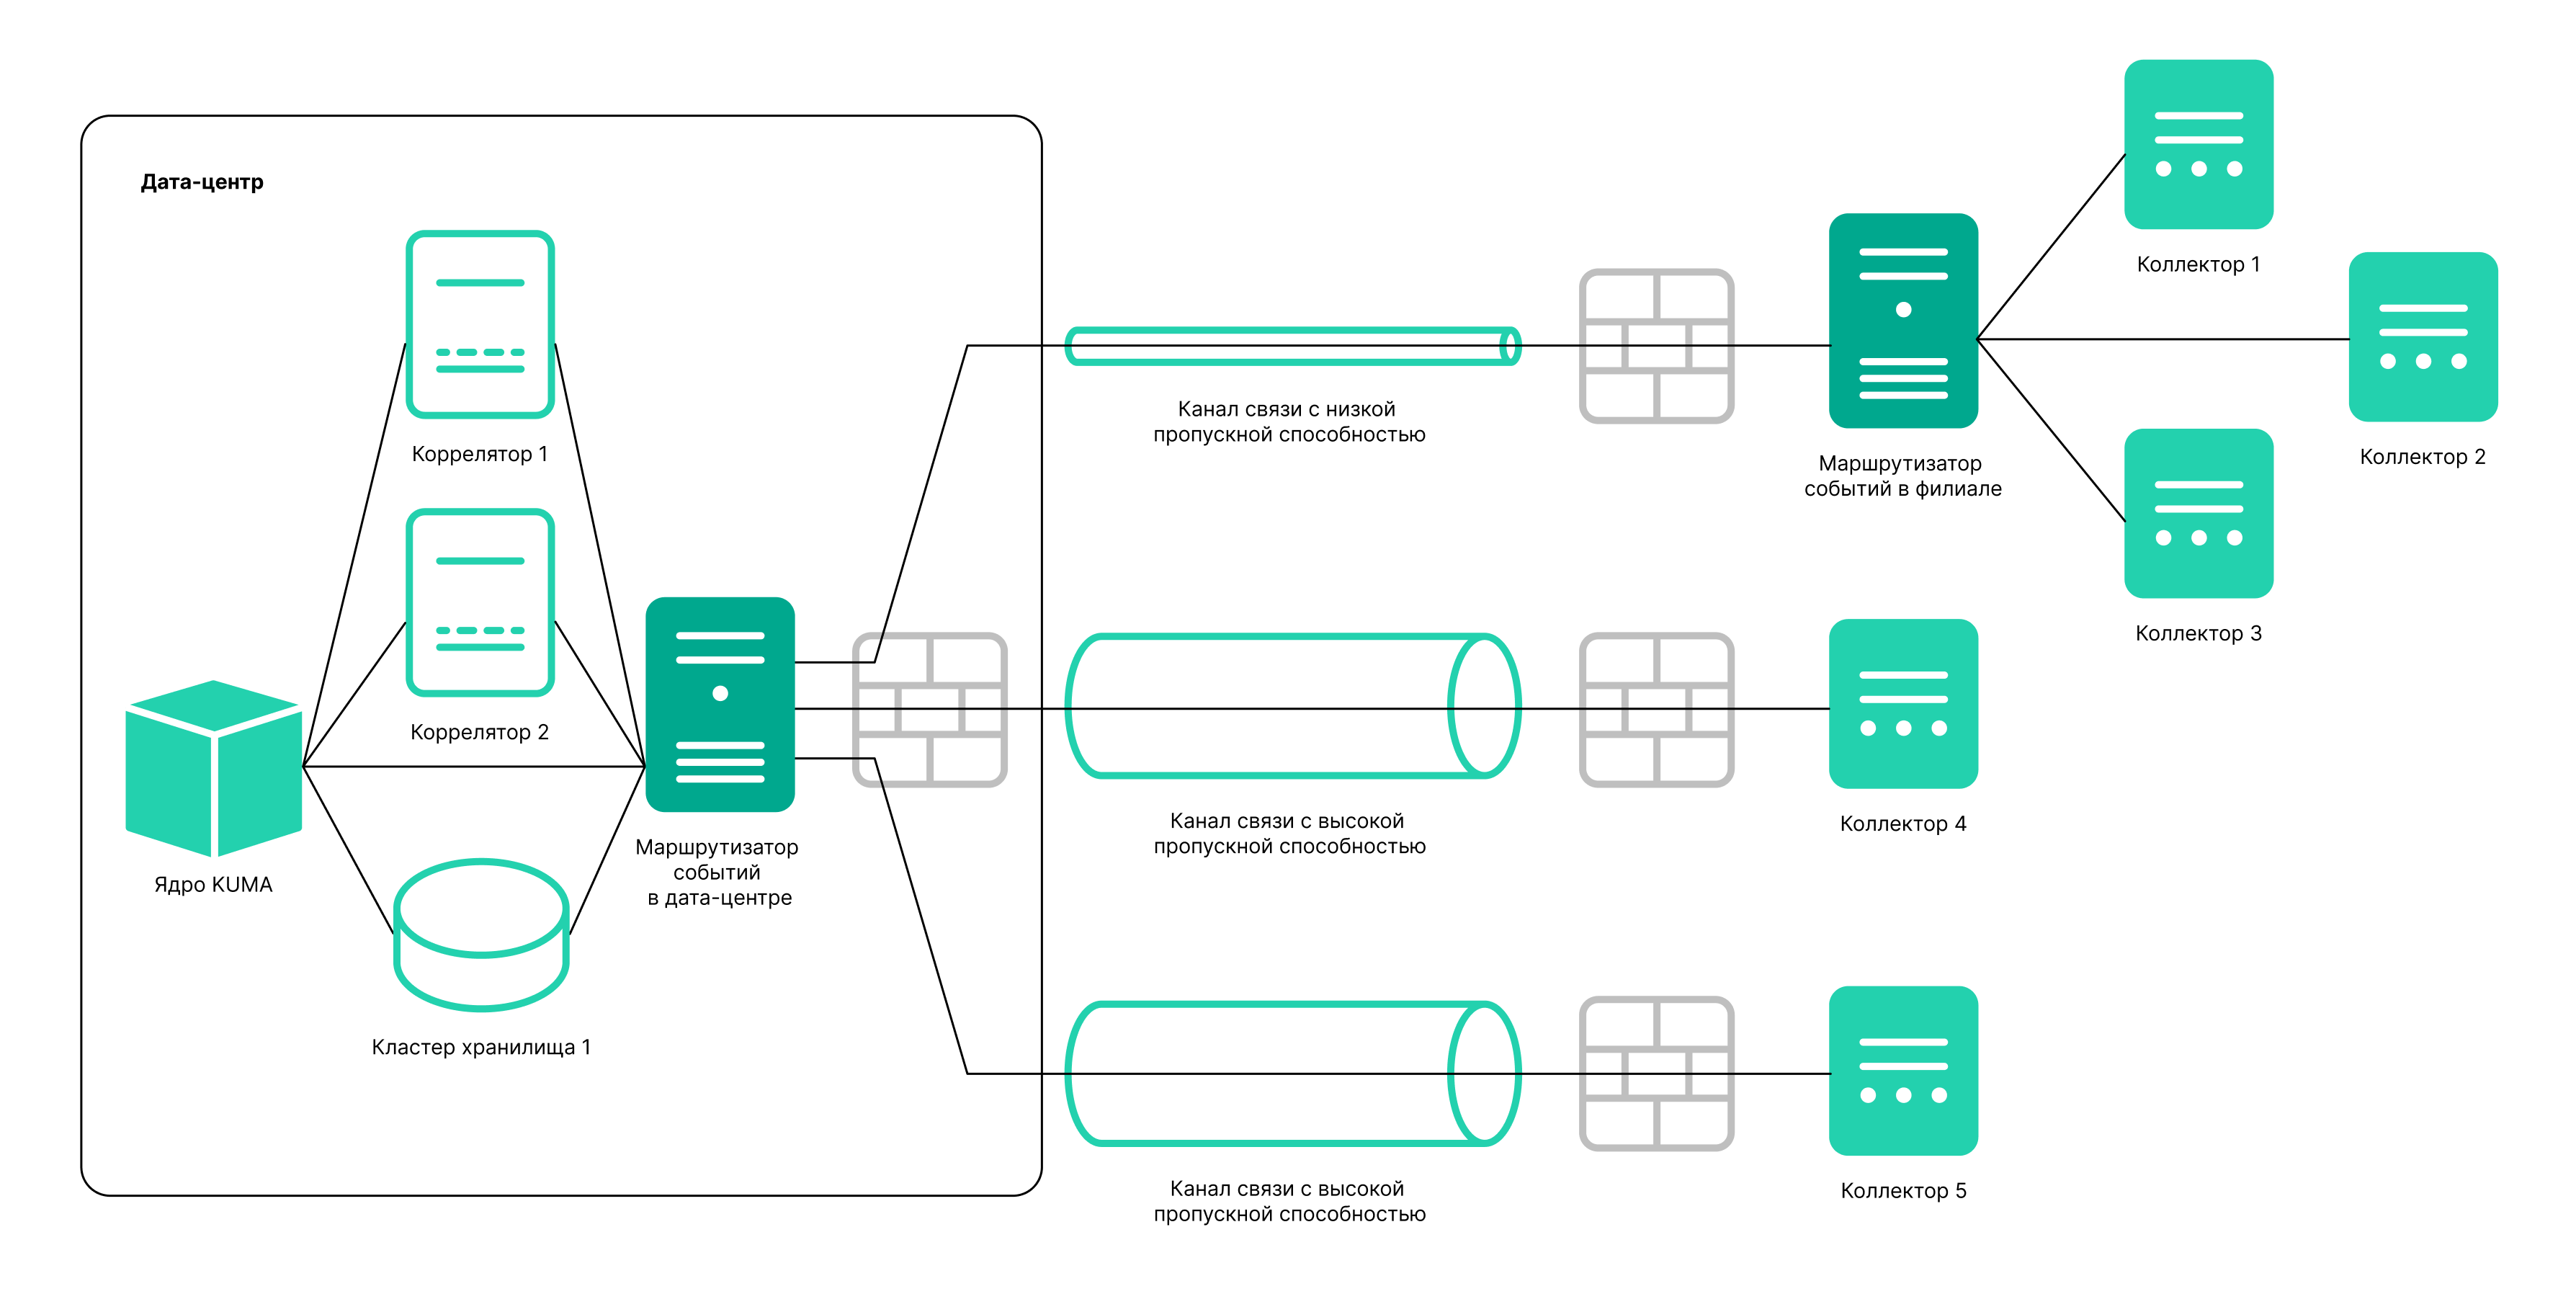
Preconditions:
- KUMA 3.2 collectors are configured at the branch offices.
- The data center has the capacity to install an event router.
- KUMA 3.2 is installed in the data center.
Steps:
- In the data center:
- Create the Event router service.
- Create storage and correlator destination points and specify them in the Event router.
- In the Event router on the Advanced settings tab, configure a filter to send events to storage and/or correlator. For example, "DeviceCustomString = correlator" or "DeviceCustomString = storage".
- At the branch office:
- Create the Event router service.
- Create a destination of the eventRouter type and specify the URL of the Event router in the data center.
- In the collectors at branch offices:
- Create a destination of the eventRouter type and specify the URL of the Event router at the branch office.
- If eventRouter replaces previously configured destinations, you can delete them.
Postcondition:
- Collectors at the branch offices are configured.
- The event router in the data center and the event router at the branch office are configured.
The connections of branch offices with the data center are optimized: in each collector, you no longer need to configure events to be sent to the data center; it is enough to collect all events on the router and send it to the data center as one stream.
The event router must be installed on a Linux device. Only a user with the General Administrator role can create the service. You can create a service in any tenant; the tenant relation does not impose any restrictions.
You can use the following metrics to get information about the service performance:
- IO
- Process
- OS
As with other resources, the following audit events are generated for the event router in KUMA:
- Resource was successfully added
- Resource was successfully updated
- Resource was successfully deleted
Installing an event router involves two steps:
- Create the event router service in the KUMA Console using the Installation Wizard.
- Install the event router service on the server.
Starting the event router installation wizard
To start the event router installation wizard:
- In the KUMA Console, in the Resources section, click Event routers.
- This opens the Event routers window; in that window, click Add.
Follow the instructions of the installation wizard.
Step 1. General settings of the event router
This is a required step of the Installation Wizard. At this step, you specify the main settings of the event router: its name and the tenant that will own it.
To specify the general settings of the event router:
- On the Basic settings tab, fill in the following fields:
- In the Name field, enter a unique name for the service you are creating. The name must contain 1 to 128 Unicode characters.
- In the Tenant drop-down list, select the tenant that will own the event router. An event router belonging to a tenant is organizational in nature and does not impose any restrictions.
- If necessary, specify the number of processes that the service can run concurrently in the Handlers field. By default, the number of handlers is the same as the number of vCPUs on the server where the service is installed.
- You can optionally add up to 4000 Unicode characters describing the service in the Description field.
- On the Advanced settings tab, fill in the following fields:
- If necessary, use the Debug toggle switch to enable logging of service operations.
- You can use the Create dump periodically toggle switch at the request of Technical Support to generate resource (CPU, RAM, etc.) utilization reports in the form of dumps.
- In the Dump settings field, you can specify the settings to be used when creating dumps. The specifics of filling in this field must be provided by Technical Support.
General settings of the event router are specified. Proceed to the next step of the Installation Wizard.
Page top
Step 2. Routing
This is a required step of the Installation Wizard. We recommend sending events to at least two destinations: to the correlator for analysis and to the storage for storage. You can also select another event router as the destination.
To specify the settings of the destination to which you want the event router to send events received from collectors:
- In the Routing step of the installation wizard, click Add.
- This opens the Create destination window; in that window, specify the following settings:
- On the Basic settings tab, in the Name field, enter a unique name for the destination. The name must contain 1 to 128 Unicode characters.
- You can use the State toggle switch to enable or disable the service as needed.
- In the Type drop-down list, select the type of the destination. The following values are available:
- On the Advanced settings tab, specify the values of parameters. The set of parameters that can be configured depends on the type of the destination selected on the Basic settings tab. For detailed information about parameters and their values, click the link for each type of destination in paragraph "c." of these instructions.
The created destination is displayed on the Installation Wizard tab. A destination resource can be removed from the resource set by selecting it and clicking Delete in the opened window.
Routing is configured. You can proceed to the next step of the installation wizard.
Page top
Step 3. Setup validation
This is the required, final step of the Installation Wizard.
To create an event router in the installation wizard:
- Click Create and save service.
The lower part of the window displays the command that you must use to install the router on the server.
Example command:
/opt/kaspersky/kuma/kuma eventrouter --core https://kuma-example:<
port used for communication with the KUMA Core> --id <event router service ID> --api.port <port used for communication with the service> --installThe port for communication with the KUMA Core, the service ID, and the port for communication with the service are added to the command automatically. You must also ensure the network connectivity of KUMA and open the ports used by its components, if necessary.
- Close the Wizard by clicking Save.
The service is installed in the KUMA Console. You can now proceed with installing the service in the KUMA network infrastructure.
Page top
Installing the event router on the server
To install the event router on the server:
- Log in to the server where you want to install the event router service.
- Create the /opt/kaspersky/kuma/ folder.
- Copy the "kuma" file to the "/opt/kaspersky/kuma/" directory. The file is located inside the installer in the "/kuma-ansible-installer/roles/kuma/files/" directory.
- Make sure the kuma file has sufficient rights to run. If the file is not executable, make it executable:
sudo chmod +x /opt/kaspersky/kuma/kuma - Place the LICENSE file from the /kuma-ansible-installer/roles/kuma/files/ directory in the /opt/kaspersky/kuma/ directory and accept the license by running the following command:
sudo /opt/kaspersky/kuma/kuma license - Create the 'kuma' user:
sudo useradd --system kuma && usermod -s /usr/bin/false kuma - Make the 'kuma' user the owner of the /opt/kaspersky/kuma directory and all files inside the directory:
sudo chown -R kuma:kuma /opt/kaspersky/kuma/ - Add the KUMA event router port to firewall exclusions.
For the program to run correctly, ensure that the KUMA components are able to interact with other components and programs over the network via the protocols and ports specified during the installation of the KUMA components.
- Execute the following command:
sudo /opt/kaspersky/kuma/kuma eventrouter --core https://<FQDN of the KUMA Core server>:<port used by KUMA Core server for internal communication (port 7210 by default)> --id <service ID copied from the KUMA web console> --api.port <port used for communication with the installed component> --installExample:
sudo /opt/kaspersky/kuma/kuma eventrouter --core https://kuma.example.com:7210 --id XXXX --api.port YYYY --install
The event router is installed on the server. You can use it to receive events from collectors and relay the events to specified destinations.
Page top
Creating a collector
A collector receives raw events from event sources, performs normalization, and sends processed events to their destinations. The maximum size of an event that can be processed by the KUMA collector is 4 MB.
If you are using the SMB license, and both the hourly average EPS and the daily average EPS allowed by the license is exceeded for a collector, the collector stops receiving events and is displayed with a red status and a notification about the EPS limit being exceeded. The user with the General Administrator role gets a notification about the EPS limit being exceeded and the collector being stopped. Every hour, the hourly average EPS value is recalculated and compared with the EPS limit in the license. If the hourly average is under the limit, the restrictions on the collector are lifted, and the collector resumes receiving and processing events.
Installing a collector involves two steps:
- Create the collector in the KUMA Console using the Installation Wizard. In this step, you specify the general collector settings to be applied when installing the collector on the server.
- Install the collector on the network infrastructure server on which you want to receive events.
Actions in the KUMA Console
The creation of a collector in the KUMA Console is carried out by using the Installation Wizard. This Wizard combines the required resources into a set of resources for a collector. Upon completion of the Wizard, the service itself is automatically created based on this set of resources.
To create a collector in the KUMA Console,
Start the Collector Installation Wizard:
- In the KUMA Console, in the Resources section, click Add event source button.
- In the KUMA Console in the Resources → Collectors section click Add collector button.
As a result of completing the steps of the Wizard, a collector service is created in the KUMA Console.
A resource set for a collector includes the following resources:
- Connector
- Normalizer (at least one)
- Filters (if required)
- Aggregation rules (if required)
- Enrichment rules (if required)
- Destinations (normally two are defined for sending events to the correlator and storage)
These resources can be prepared in advance, or you can create them while the Installation Wizard is running.
Actions on the KUMA Collector Server
When installing the collector on the server that you intend to use for receiving events, run the command displayed at the last step of the Installation Wizard. When installing, you must specify the identifier automatically assigned to the service in the KUMA Console, as well as the port used for communication.
Testing the installation
After creating a collector, you are advised to make sure that it is working correctly.
Starting the Collector Installation Wizard
A collector consists of two parts: one part is created inside the KUMA Console, and the other part is installed on the network infrastructure server intended for receiving events. The Installation Wizard creates the first part of the collector.
To start the Collector Installation Wizard:
- In the KUMA Console, in the Resources section, click Add event source.
- In the KUMA Console in the Resources → Collectors section click Add collector.
Follow the instructions of the Wizard.
Aside from the first and last steps of the Wizard, the steps of the Wizard can be performed in any order. You can switch between steps by using the Next and Previous buttons, as well as by clicking the names of the steps in the left side of the window.
After the Wizard completes, a resource set for a collector is created in the KUMA Console under Resources → Collectors, and a collector service is added under Resources → Active services.
Step 1. Connect event sources
This is a required step of the Installation Wizard. At this step, you specify the main settings of the collector: its name and the tenant that will own it.
To specify the general settings of the collector:
- On the Basic settings tab, fill in the following fields:
- In the Collector name field, enter a unique name for the service you are creating. The name must contain 1 to 128 Unicode characters.
When certain types of collectors are created, agents named "agent: <Collector name>, auto created" are also automatically created together with the collectors. If this type of agent was previously created and has not been deleted, it will be impossible to create a collector named <Collector name>. If this is the case, you will have to either specify a different name for the collector or delete the previously created agent.
- In the Tenant drop-down list, select the tenant that will own the collector. The tenant selection determines what resources will be available when the collector is created.
If you return to this window from another subsequent step of the Installation Wizard and select another tenant, you will have to manually edit all the resources that you have added to the service. Only resources from the selected tenant and shared tenant can be added to the service.
- If required, specify the number of processes that the service can run concurrently in the Workers field. By default, the number of worker processes is the same as the number of vCPUs on the server where the service is installed.
- You can optionally add up to 256 Unicode characters describing the service in the Description field.
- In the Collector name field, enter a unique name for the service you are creating. The name must contain 1 to 128 Unicode characters.
- On the Advanced settings tab, fill in the following fields:
- If necessary, use the Debug toggle switch to enable logging of service operations. Error messages of the collector service are logged even when debug mode is disabled. The log can be viewed on the machine where the collector is installed, in the /opt/kaspersky/kuma/collector/<collector ID>/log/collector directory.
- You can use the Create dump periodically toggle switch at the request of Technical Support to generate resource (CPU, RAM, etc.) utilization reports in the form of dumps.
- In the Dump settings field, you can specify the settings to be used when creating dumps. The specifics of filling in this field must be provided by Technical Support.
General settings of the collector are specified. Proceed to the next step of the Installation Wizard.
Page top
Step 2. Transport
This is a required step of the Installation Wizard. On the Transport tab of the Installation Wizard, select or create a connector and in its settings, specify the source of events for the collector service.
To add an existing connector to a resource set,
select the name of the required connector from the Connector drop-down list.
The Transport tab of the Installation Wizard displays the settings of the selected connector. You can open the selected connector for editing in a new browser tab using the button.
To create a new connector:
- Select Create new from the Connector drop-down list.
- In the Type drop-down list, select the connector type and specify its settings on the Basic settings and Advanced settings tabs. The available settings depend on the selected type of connector:
- tcp
- udp
- netflow
- sflow
- nats-jetstream
- kafka
- http
- sql
- file
- 1c-log
- 1c-xml
- diode
- ftp
- nfs
- wmi
- wec
- etw
- snmp
- snmp-trap
- kata\edr
- vmware
- elastic
When using the tcp or udp connector type at the normalization stage, IP addresses of the assets from which the events were received will be written in the DeviceAddress event field if it is empty.
When using a wmi, wec, or etw connector, agents are automatically created for receiving Windows events.
It is recommended to use the default encoding (UTF-8), and to apply other settings only if bit characters are received in the fields of events.
Making KUMA collectors to listen on ports up to 1,000 requires running the service of the relevant collector with root privileges. To do this, after installing the collector, add the line
AmbientCapabilities = CAP_NET_BIND_SERVICEto its systemd configuration file in the [Service] section.
The systemd file is located in the /usr/lib/systemd/system/kuma-collector-<collector ID>.service directory.
The connector is added to the resource set of the collector. The created connector is only available in this resource set and is not displayed in the web interface Resources → Connectors section.
Proceed to the next step of the Installation Wizard.
Page top
Step 3. Event parsing
This is a required step of the Installation Wizard. On the Event parsing tab of the Installation Wizard, click the + Add event parsing button to open the Basic event parsing window, and in that window, in the Normalizer drop-down list, select or create a normalizer. In normalizer settings, define the rules for converting raw events into normalized events. You can add multiple event parsing rules to the normalizer to implement complex event processing logic. You can test the normalizer using test events.
When you create a new normalizer in the Installation Wizard, the default normalizer is saved in the resource set for the collector. You cannot use the created normalizer in other collectors. You can select the Save normalizer check box to create the normalizer as a separate resource. This will make the normalizer available for selection in other collectors of the tenant.
If, when editing the settings of a resource set of a collector, you edit or delete conversions in a normalizer connected to the resource set of the collector, the edits will not be saved, and the normalizer itself may be corrupted. If you need to modify conversions in a normalizer that is already part of a service, the changes must be made directly in the normalizer under Resources → Normalizers in the web interface.
Adding a normalizer to a resource set
To add a normalizer to a resource set:
- Click the + Add event parsing button.
This opens the Basic event parsing window with the normalizer settings. By default, the Normalization scheme tab is selected.
- In the Normalizer drop-down list, select a normalizer. You can select a normalizer that belongs to the tenant of the collector or to the common tenant.
The normalizer settings are displayed.
If you want to edit the settings of the normalizer, in the Normalizer drop-down list, click the pencil
 icon next to the name of the normalizer to open the Edit normalizer window, and in that window, click the dark circle. This opens the Basic event parsing window with the normalizer settings. If you want to edit additional parsing settings, in the Edit normalizer window, hover over the dark circle and click the plus symbol that appears. This opens the Additional event parsing with settings of the additional parsing. For more details on configuring the additional parsing of events, see the Creating the structure of event normalization rules section below.
 - Click OK.
The normalizer is added and displayed as a dark circle on the Event parsing tab of the Installation Wizard. You can click the dark circle to view the settings of the normalizer.
To create a new normalizer in the collector:
- Click the + Add event parsing button.
This opens the Basic event parsing window with the normalizer settings. By default, the Normalization scheme tab is selected.
- If you want to create the normalizer as a separate resource, select the Save normalizer check box. If the check box is selected, the normalizer becomes available for selection in other collectors of the tenant. This check box is cleared by default.
- In the Name field, enter a unique name for the normalizer. Maximum length of the name: 128 Unicode characters.
- In the Parsing method drop-down list, select the type of events to receive. Depending on the selected value, you can use the predefined event field matching rules or define rules manually. When you select some parsing methods, additional settings may become available that you must specify.
Available parsing methods:
- json
- cef
- regexp
This parsing method is used to create custom rules for processing data in a format using regular expressions.
You must add a regular expression (RE2 syntax) with named capturing groups to the field under Normalization. The name of the capturing group and its value are considered the field and value of the raw event that can be converted to an event field in KUMA format.
To add event handling rules:
- If necessary, copy an example of the data you want to process to the Event examples field. We recommend completing this step.
- In the field under Normalization, add a RE2 regular expression with named capturing groups, for example,
"(?P<name>regexp)". The regular expression added to the field under Normalization must exactly match the event. When designing the regular expression, we recommend using special characters that match the starting and ending positions of the text:^,$.You can add multiple regular expressions or remove regular expressions. To add a regular expression, click Add regular expression. To remove a regular expression, click the delete icon
next to it. - Click the Copy field names to the mapping table button.
Capture group names are displayed in the KUMA field column of the Mapping table. You can select the corresponding KUMA field in the column opposite each capturing group. If you followed the CEF format when naming the capturing groups, you can use automatic CEF mapping by selecting the Use CEF syntax for normalization check box.
Event handling rules are added.
- syslog
- csv
- kv
- xml
This parsing method is used to process XML data in which each object, including nested objects, occupies a single line in a file. Files are processed line by line.
If you want to send the raw event for advanced normalization, at each nesting level in the Advanced event parsing window, select Yes in the Keep raw event drop-down list.
If you select this parsing method, under XML attributes, you can specify the key XML attributes to be extracted from tags. If an XML structure has multiple XML attributes with different values in the same tag, you can identify the necessary value by specifying the key of the value in the Source column of the Mapping table.
To add key XML attributes:
- Click + Add field.
- This opens a window; in that window, specify the path to the XML attribute.
You can add multiple XML attributes or remove XML attributes. To remove an individual XML attribute, click the delete icon
next to it. To remove all XML attributes, click Reset.If XML key attributes are not specified, then in the course of field mapping the unique path to the XML value will be represented by a sequence of tags.
Tag numbering
Starting with KUMA 2.1.3, you can use automatic tag numbering in XML events. This lets you parse an event with the identical tags or unnamed tags, such as
<Data>.As an example, we will number the tags of the
EventDataattribute of the Microsoft Windows PowerShell event ID 800.To parse events with identical tags or unnamed tags, you need to configure tag numbering and data mapping for numbered tags with KUMA event fields.
KUMA 3.0.x supports using XML attributes and tag numbering at the same time in the same extra normalizer. If an XML attribute contains unnamed tags or identical tags, we recommend using tag numbering. If the XML attribute contains only named tags, we recommend using XML attributes.
To use XML attributes and tag numbering in extra normalizers, you must sequentially enable the Keep raw event setting in each extra normalizer along the path that the event follows to the target extra normalizer, and in the target extra normalizer itself.
For an example of how tag numbering works, you can refer to the MicrosoftProducts normalizer. The Keep raw event setting is enabled sequentially in both AD FS and 424 extra normalizers.
To set up the parsing of events with unnamed or identical tags:
- Open an existing normalizer or create a new normalizer.
- In the Basic event parsing window of the normalizer, in the Parsing method drop-down list, select xml.
- In the Tag numbering field, click + Add field.
- In the displayed field, enter the full path to the tag to whose elements you want to assign a number, for example,
Event.EventData.Data. The first tag gets number 0. If the tag is empty, for example,<Data />, it is also assigned a number. - To configure data mapping, under Mapping, click + Add row and do the following:
- In the displayed row, in the Source field, enter the full path to the tag and the index of the tag. For example, for the Microsoft Windows PowerShell event ID 800 from the example above, the full paths to tags and tag indices are as follows:
Event.EventData.Data.0,Event.EventData.Data.1,Event.EventData.Data.2and so on.
- In the KUMA field drop-down list, select the field in the KUMA event that will receive the value from the numbered tag after parsing.
- In the displayed row, in the Source field, enter the full path to the tag and the index of the tag. For example, for the Microsoft Windows PowerShell event ID 800 from the example above, the full paths to tags and tag indices are as follows:
- Save changes in one of the following ways:
- If you created a new normalizer, click Save.
- If you edited an existing normalizer, in the collector to which the normalizer is linked, click Update configuration.
Parsing is configured.
- netflow
- netflow5
- netflow9
- sflow5
- ipfix
- sql. This parsing method becomes available only if at the Transport step of the Installation Wizard you specified a connector of the sql type.
- In the Keep raw event drop-down list, specify whether you want to store the original raw event in the re-created normalized event.
- Don't save—do not save the raw event. This value is selected by default.
- Only errors—save the raw event in the
Rawfield of the normalized event if errors occurred when parsing it. You can use this value to debug the service. In this case, an event having a non-emptyRawfield indicates problems. - Always—always save the raw event in the
Rawfield of the normalized event.
- In the Keep extra fields drop-down list, choose whether you want to store the raw event fields in the normalized event if no mapping is configured for them (see step 8 of these instructions):
- No. This value is selected by default.
- Yes. The original event fields are saved in the
Extrafield of the normalized event.
- If necessary, provide an example of the data you want to process to the Event examples field. We recommend completing this step.
- In the Mapping table, configure the mapping of raw event fields to KUMA event fields:
- Click + Add row.
You can add multiple table rows or delete table rows. To delete a table row, select the check box next to it and click the Delete button.
- In the Source column, specify the name of the raw event field that you want to map to the KUMA event field.
For details about the field name format, refer to the Normalized event data model article. For a description of the mapping, refer to the Mapping fields of predefined normalizers article.
If you want to create rules for modifying the fields of the original event before writing to the KUMA event fields, click the settings
 icon next to the field name to open the Conversion window, and in that window, click + Add conversion. You can reorder the rules or delete the rules. To reorder rules, use the reorder
  icons. To delete a rule, click the delete
  icon next to it.
If at the Transport step of the Installation Wizard, you specified a connector of the file type, you can pass the name or path of the file being processed by the collector to the KUMA event field. To do this, in the Source column, specify one of the following values:
$kuma_fileSourceNameto pass the name of the file being processed by the collector in the KUMA event field.$kuma_fileSourcePathto pass the path to the file being processed by the collector in the KUMA event field.
When you use a file connector, the new variables in the normalizer will only work with destinations of the internal type.
- In the KUMA field column, select a KUMA event field from the drop-down list. You can find the KUMA event field by typing its name. If the name of the KUMA event field begins with
DeviceCustom*orFlex*, enter a unique custom label in the Label field, if necessary.
If you want KUMA to enrich events with asset information, and the asset information to be available in the alert card when a correlation rule is triggered, in the Mapping table, configure a mapping of host address and host name fields depending on the purpose of the asset. For example, you can configure a mapping for SourceAddress and SourceHostName, or DestinationAddress and DestinationHostName KUMA event fields. As a result of enrichment, the event card includes a SourceAssetID or DestinationAssetID KUMA event field, and a link to the asset card. As a result of enrichment, asset information is also available in the alert card.
If you have loaded data into the Event examples field, the table will have an Examples column containing examples of values carried over from the raw event field to the KUMA event field.
- Click + Add row.
- Click OK.
The normalizer is created and displayed as a dark circle on the Event parsing tab of the Installation Wizard. You can click the dark circle to view the settings of the normalizer. If you want to edit additional parsing settings, hover over the dark circle and click the plus symbol that appears. This opens the Additional event parsing with settings of the additional parsing. For more details on configuring the additional parsing of events, see the Creating the structure of event normalization rules section below.
Enriching normalized events with additional data
You can create enrichment rules in the normalizer to add extra data to created normalized events. Enrichment rules are stored in the normalizer in which they were created.
To add enrichment rules to the normalizer:
- Select the main or additional normalization rule to open a window, and in that window, select the Enrichment tab.
- Click the + Add enrichment button.
The enrichment rule settings section is displayed. You can add multiple enrichment rules or delete enrichment rules. To delete an enrichment rule, click the delete
icon next to it. - In the Source kind drop-down list, select the type of the enrichment source. When you select some enrichment source types, additional settings may become available that you must specify.
Available Enrichment rule source types:
- constant
- dictionary
- table
This type of enrichment is used if you need to add a value from the dictionary of the Table type.
When this enrichment type is selected in the Dictionary name drop-down list, select the dictionary for providing the values. In the Key fields group of settings, click the Add field button to select the event fields whose values are used for dictionary entry selection.
In the Mapping table, configure the dictionary fields to provide data and the event fields to receive data:
- In the Dictionary field column, select the dictionary field. The available fields depend on the selected dictionary resource.
- In the KUMA field column, select the event field to which the value is written. For some of the selected fields (
*custom*and*flex*), in the Label column, you can specify a name for the data written to them.
New table rows can be added by clicking the Add new element button. Columns can be deleted by clicking the
button. - event
This type of enrichment is used when you need to write a value from another event field to the current event field. Available enrichment type settings are listed in the table below.
Available enrichment type settings
Setting
Description
Target field
The KUMA event field that you want to populate with the data.
Source field
The event field whose value is written to the target field.
Clicking
 opens the Conversion window, in which you can click Add conversion to create rules for modifying the source data before writing them to the KUMA event fields. You can reorder and delete created rules. To change the position of a rule, click next to it. To delete a rule, click next to it.
When using enrichment of events that have event selected as the Source kind and the extended event schema fields are used as arguments, the following special considerations apply:
- If the source extended event schema field has the "Array of strings" type, and the target extended event schema field has the "String" type, the values are written to the target extended event schema field in TSV format.
Example: The
SA.StringArrayextended event schema field contains values:"string1","string2","string3". An event enrichment operation is performed. The result of the event enrichment operation is written to theDeviceCustomString1extended event schema field. TheDeviceCustomString1extended event schema field contains values:["string1", "string2", "string3"]. - If the source and target extended event schema fields have the "Array of strings" type, values of the source extended event schema field are added to the values of the target extended event schema field, and the "
," character is used as the delimiter character.Example: The
SA.StringArrayOnefield of the extended event scheme contains the["string1","string2","string3"]values, and theSA.StringArrayTwofield of the extended event scheme contains the["string4", "string5", "string6"]values. An event enrichment operation is performed. The result of the event enrichment operation is written to theSA.StringArrayTwofield of the extended event scheme. TheSA.StringArrayTwoextended event schema field contains values:["string4", "string5", "string6", "string1", "string2", "string3"].
- If the source extended event schema field has the "Array of strings" type, and the target extended event schema field has the "String" type, the values are written to the target extended event schema field in TSV format.
- template
- In the Target field drop-down list, select the KUMA event field to which you want to write the data. You cannot select a value if in the Source kind drop-down list, you selected table.
- If you want to enable details in the normalizer log, enable the Debug toggle switch. The toggle switch is turned off by default.
- Click OK.
The event enrichment rules with additional data are added to the normalizer into the selected parsing rule.
Configuring parsing linked to IPv4 addresses
If at the Transport step of the Installation Wizard, you specified a connector of the udp, tcp, or http type, you can forward events from multiple IPv4 addresses from sources of different types to the same collector, and have the collector apply the specified normalizers. To do this, you need to specify several IPv4 addresses and select the normalizer that you want to apply to events coming from the specified IPv4 addresses. The following types of normalizers are available: json, cef, regexp, syslog, csv, kv, and xml.
If you select a connector type other than udp, tcp, or http in a collector with configured normalizers and linking to IPv4 addresses, the Parsing settings tab is no longer displayed, and only the first of the previously specified normalizers is specified on the Event parsing tab of the Installation Wizard. The Parsing settings tab is hidden immediately, and the changes are applied after the resource is saved. If you want to restore the previous settings, exit the Installation Wizard without saving.
For normalizers of the Syslog and regexp types, you can use of a chain of normalizers. In this case, you can specify additional normalization conditions depending on the value of the DeviceProcessName field. The difference from extra normalization is that you can specify shared normalizers.
To configure parsing with linking to IPv4 addresses:
- Select the Parsing settings tab and click the + Event source button.
A group of parsing settings is displayed. You can add multiple parsings or delete parsings. To remove a parsing, click the delete
icon next to it. - In the IP address(es) field, enter the IPv4 address from which events will be sent. You can specify multiple IP addresses separated by commas. The length of the IPv4 address list is unlimited; however, we recommend limiting the number of IPv4 addresses to keep the load on the collector balanced. You must specify a value in this field if you want to apply multiple normalizers in one collector.
The IPv4 address must be unique for each normalizer. KUMA checks the uniqueness of IPv4 addresses, and if you specify the same IPv4 address for different normalizers, the
Field must be uniquemessage is displayed.If you want to send all events to the same normalizer without specifying IPv4 addresses, we recommend creating a separate collector. To improve performance, we recommend creating a separate collector with one normalizer if you want to apply the same normalizer to events from a large number of IPv4 addresses.
- In the Normalizer drop-down list, create or select a normalizer. You can click the arrow icon next to the drop-down list to select the Parsing schemas tab.
Normalization will be triggered if at the Transport step of the Installation Wizard, you specified a connector of the udp, tcp, or http type. For a http connector, you must specify the header of the event source. Taking into account the available connectors, the following normalizer types are available for automatic source recognition: json, cef, regexp, syslog, csv, kv, and xml.
- If you selected a normalizer of the Syslog or regexp type, and you want to add a conditional normalization, click the + Add conditional normalization button. Conditional normalization is available if in the Mapping table of the main normalizer, you configured the mapping of the source event field to the DeviceProcessName KUMA event field. Under Condition, in the DeviceProcessName field, specify a process name, and in the drop-down list, create or select a normalizer. You can specify multiple combinations of the DeviceProcessName KUMA event field and a normalizer. Normalization is performed until the first match.
Parsing with linking to IPv4 addresses is configured.
Creating a structure of event normalization rules
To implement complex event processing logic, you can add multiple event parsing rules to the normalizer. Events are switched between the parsing rules depending on the specified conditions. Events are processed sequentially in accordance with the creation order of the parsing rules. The event processing path is displayed as arrows.
To create an additional parsing rule:
- Create a normalizer. For more information on creating normalizers, see the Adding a normalizer to a resource set section earlier in this article.
The created normalizer is displayed as a dark circle on the Event parsing tab of the Installation Wizard.
- Hover over the dark circle and click the plus sign that appears.
- In the Additional event parsing window that opens, configure the additional event parsing rule:
- Extra normalization conditions tab:
If you want to send a raw event for extra normalization, select Yes in the Keep raw event drop-down list. The default value is No. We recommend passing a raw event to normalizers of json and xml types. If you want to send a raw event for extra normalization to the second, third, etc nesting levels, at each nesting level, select Yes in the Keep raw event drop-down list.
To send only the events with a specific field to the additional normalizer, specify the field in the Field to pass into normalizer field.
On this tab, you can define other conditions that must be satisfied for the event to be sent for additional parsing.
- Normalization scheme tab:
On this tab, you can configure event processing rules, similar to the main normalizer settings. The Keep raw event setting is not available. The Event examples field displays the values specified when the normalizer was created.
- Enrichment tab:
On this tab, you can configure enrichment rules for events. For more details on configuring enrichment rules, see the Enriching normalized events with additional data section earlier in this article.
- Extra normalization conditions tab:
- Click OK.
An additional parsing rule is added to the normalizer and displayed as a dark box. The dark box specifies the conditions that trigger the additional parsing rule.
You can do the following:
- You can chick the additional parsing rule to edit its settings.
- You can find an additional parsing rule by entering its name in the field in the upper part of the window.
- Create a new additional parsing rule. To do this, hover over the additional parsing rule and click on the plus icon that appears.
- Delete an additional parsing rule. To do this, hover over the additional parsing rule and click on the trash can icon.
Proceed to the next step of the Installation Wizard.
Page top
Step 4. Filtering events
This is an optional step of the Installation Wizard. The Event filtering tab of the Installation Wizard allows you to select or create a filter whose settings specify the conditions for selecting events. You can add multiple filters to the collector. You can swap the filters by dragging them by the icon as well as delete them. Filters are combined by the AND operator.
When configuring filters, we recommend to adhere to the chosen normalization scheme. In filters, use only KUMA service fields and the fields that you specified in the normalizer in the Mapping and Enrichment sections. For example, if the DeviceAddress field is not used in normalization, avoid using the DeviceAddress field in a filter because such filtering will not work.
To add an existing filter to a collector resource set,
Click the Add filter button and select the required filter from the Filter drop-down menu.
To add a new filter to the collector resource set:
- Click the Add filter button and select Create new from the Filter drop-down menu.
- If you want to keep the filter as a separate resource, select the Save filter check box. This can be useful if you decide to reuse the same filter across different services. This check box is cleared by default.
- If you selected the Save filter check box, enter a name for the created filter in the Name field. The name must contain 1 to 128 Unicode characters.
- In the Conditions section, specify the conditions that must be met by the filtered events:
- The Add condition button is used to add filtering conditions. You can select two values (two operands, left and right) and assign the operation you want to perform with the selected values. The result of the operation is either True or False.
- In the operator drop-down list, select the function to be performed by the filter.
In this drop-down list, you can select the do not match case check box if the operator should ignore the case of values. This check box is ignored if the InSubnet, InActiveList, InCategory, and InActiveDirectoryGroup operators are selected. This check box is cleared by default.
- In the Left operand and Right operand drop-down lists, select where the data to be filtered will come from. As a result of the selection, Advanced settings will appear. Use them to determine the exact value that will be passed to the filter. For example, when choosing active list you will need to specify the name of the active list, the entry key, and the entry key field.
- You can use the If drop-down list to choose whether you need to create a negative filter condition.
Conditions can be deleted using the
button. - In the operator drop-down list, select the function to be performed by the filter.
- The Add group button is used to add groups of conditions. Operator AND can be switched between AND, OR, and NOT values.
A condition group can be deleted using the
button. - By clicking Add filter, you can add existing filters selected in the Select filter drop-down list to the conditions. You can click to navigate to a nested filter.
A nested filter can be deleted using the
button.
- The Add condition button is used to add filtering conditions. You can select two values (two operands, left and right) and assign the operation you want to perform with the selected values. The result of the operation is either True or False.
The filter has been added.
Proceed to the next step of the Installation Wizard.
Page top
Step 5. Event aggregation
This is an optional step of the Installation Wizard. The Event aggregation tab of the Installation Wizard allows you to select or create aggregation rules whose settings specify the conditions for aggregating events of the same type. You can add multiple aggregation rules to the collector.
To add an existing aggregation rule to a set of collector resources,
click Add aggregation rule and select Aggregation rule in the drop-down list.
To add a new aggregation rule to a set of collector resources:
- Click the Add aggregation rule button and select Create new from the Aggregation rule drop-down menu.
- Enter the name of the newly created aggregation rule in the Name field. The name must contain 1 to 128 Unicode characters.
- In the Threshold field, specify how many events must be accumulated before the aggregation rule triggers and the events are aggregated. The default value is
100. - In the Triggered rule lifetime field, specify how long (in seconds) the collector must accumulate events to be aggregated. When this time expires, the aggregation rule is triggered and a new aggregation event is created. The default value is
60. - In the Identical fields section, use the Add field button to select the fields that will be used to identify the same types of events. Selected events can be deleted using the buttons with a cross icon.
- In the Unique fields section, you can click Add field to select the fields that will disqualify events from aggregation even if the events contain fields listed in the Identical fields section. Selected events can be deleted using the buttons with a cross icon.
- In the Sum fields section, you can use the Add field button to select the fields whose values will be summed during the aggregation process. Selected events can be deleted using the buttons with a cross icon.
- In the Filter section, you can specify the conditions to define events that will be processed by this resource. You can select an existing filter from the drop-down list or create a new filter.
Creating a filter in resources
To create a filter:
- In the Filter drop-down list, select Create new.
- If you want to keep the filter as a separate resource, select the Save filter check box. In this case, you will be able to use the created filter in various services. This check box is cleared by default.
- If you selected the Save filter check box, enter a name for the created filter resource in the Name field. Maximum length of the name: 128 Unicode characters.
- In the Conditions settings block, specify the conditions that the events must meet:
- Click the Add condition button.
- In the Left operand and Right operand drop-down lists, specify the search parameters. Depending on the data source selected in the Right operand field, there may be fields of additional parameters for identifying the value to be passed to the filter. For example, when you select active list, you must specify the name of the active list, the entry key, and the entry key field.
- In the operator drop-down list, select an operator.
- If you want the operator to be case-insensitive, select the do not match case check box. The selection of this check box does not apply to the InSubnet, InActiveList, InCategory or InActiveDirectoryGroup operators. This check box is cleared by default.
- If you want to add a negative condition, select If not from the If drop-down list.
You can add multiple conditions or a group of conditions.
- If you have added multiple conditions or groups of conditions, choose a selection condition (and, or, not) by clicking the AND button.
- If you want to add existing filters that are selected from the Select filter drop-down list, click the Add filter button. You can view the nested filter settings by clicking the button.
Aggregation rule added. You can delete it using the button.
Proceed to the next step of the Installation Wizard.
Page top
Step 6. Event enrichment
This is an optional step of the Installation Wizard. On the Event enrichment tab of the Installation Wizard, you can specify which data from which sources should be added to events processed by the collector. Events can be enriched with data obtained using enrichment rules or LDAP.
Rule-based enrichment
There can be more than one enrichment rule. You can add them by clicking the Add enrichment button and can remove them by clicking the button. You can use existing enrichment rules or create rules directly in the Installation Wizard.
To add an existing enrichment rule to a set of resources:
- Click Add enrichment.
This opens the enrichment rules settings block.
- In the Enrichment rule drop-down list, select the relevant resource.
The enrichment rule is added to the set of resources for the collector.
To create a new enrichment rule in a set of resources:
- Click Add enrichment.
This opens the enrichment rules settings block.
- In the Enrichment rule drop-down list, select Create new.
- In the Source kind drop-down list, select the source of data for enrichment and define its corresponding settings:
- constant
- dictionary
- event
- template
- dns
- cybertrace
This type of enrichment is deprecated, we recommend using cybertrace-http instead.
This type of enrichment is used to add information from CyberTrace data streams to event fields.
Available settings:
- URL (required)—in this field, you can specify the URL of a CyberTrace server to which you want to send requests. The default CyberTrace port is 9999.
- Number of connections—maximum number of connections to the CyberTrace server that can be simultaneously established by KUMA. By default, this value is equal to the number of vCPUs of the KUMA Core server.
- RPS—maximum number of requests sent to the server per second. The default value is
1,000. - Timeout—amount of time to wait for a response from the CyberTrace server, in seconds. The default value is
30. - Maximum number of events in the enrichment queue—maximum number of events stored in the enrichment queue for re-sending. The default value is 1,000,000,000.
- Mapping (required)—this settings block contains the mapping table for mapping KUMA event fields to CyberTrace indicator types. The KUMA field column shows the names of KUMA event fields, and the CyberTrace indicator column shows the types of CyberTrace indicators.
Available types of CyberTrace indicators:
- ip
- url
- hash
In the mapping table, you must provide at least one string. You can use the Add row button to add a string, and can use the
button to remove a string.
- cybertrace-http
- timezone
- geographic data
This type of enrichment is used to add IP address geographic data to event fields. Learn more about linking IP addresses to geographic data.
When this type is selected, in the Mapping geographic data to event fields settings block, you must specify from which event field the IP address will be read, select the required attributes of geographic data, and define the event fields in which geographic data will be written:
- In the Event field with IP address drop-down list, select the event field from which the IP address is read. Geographic data uploaded to KUMA is matched against this IP address.
You can use the Add event field with IP address button to specify multiple event fields with IP addresses that require geographic data enrichment. You can delete event fields added in this way by clicking the Delete event field with IP address button.
When the
SourceAddress,DestinationAddress, andDeviceAddressevent fields are selected, the Apply default mapping button becomes available. You can use this button to add preconfigured mapping pairs of geographic data attributes and event fields. - For each event field you need to read the IP address from, select the type of geographic data and the event field to which the geographic data should be written.
You can use the Add geodata attribute button to add field pairs for Geodata attribute – Event field to write to. You can also configure different types of geographic data for one IP address to be written to different event fields. To delete a field pair, click
 .
.- In the Geodata attribute field, select which geographic data corresponding to the read IP address should be written to the event. Available geographic data attributes: Country, Region, City, Longitude, Latitude.
- In the Event field to write to, select the event field which the selected geographic data attribute must be written to.
You can write identical geographic data attributes to different event fields. If you configure multiple geographic data attributes to be written to the same event field, the event will be enriched with the last mapping in the sequence.
- In the Event field with IP address drop-down list, select the event field from which the IP address is read. Geographic data uploaded to KUMA is matched against this IP address.
- Use the Debug toggle switch to indicate whether or not to enable logging of service operations. Logging is disabled by default.
- In the Filter section, you can specify conditions to identify events that will be processed by the enrichment rule resource. You can select an existing filter from the drop-down list or create a new filter.
Creating a filter in resources
To create a filter:
- In the Filter drop-down list, select Create new.
- If you want to keep the filter as a separate resource, select the Save filter check box. In this case, you will be able to use the created filter in various services. This check box is cleared by default.
- If you selected the Save filter check box, enter a name for the created filter resource in the Name field. Maximum length of the name: 128 Unicode characters.
- In the Conditions settings block, specify the conditions that the events must meet:
- Click the Add condition button.
- In the Left operand and Right operand drop-down lists, specify the search parameters. Depending on the data source selected in the Right operand field, there may be fields of additional parameters for identifying the value to be passed to the filter. For example, when you select active list, you must specify the name of the active list, the entry key, and the entry key field.
- In the operator drop-down list, select an operator.
- If you want the operator to be case-insensitive, select the do not match case check box. The selection of this check box does not apply to the InSubnet, InActiveList, InCategory or InActiveDirectoryGroup operators. This check box is cleared by default.
- If you want to add a negative condition, select If not from the If drop-down list.
You can add multiple conditions or a group of conditions.
- If you have added multiple conditions or groups of conditions, choose a selection condition (and, or, not) by clicking the AND button.
- If you want to add existing filters that are selected from the Select filter drop-down list, click the Add filter button. You can view the nested filter settings by clicking the button.
The new enrichment rule was added to the set of resources for the collector.
LDAP enrichment
To enable enrichment using LDAP:
- Click Add enrichment with LDAP data.
This opens the settings block for LDAP enrichment.
- In the LDAP accounts mapping settings block, use the New domain button to specify the domain of the user accounts. You can specify multiple domains.
- In the LDAP mapping table, define the rules for mapping KUMA fields to LDAP attributes:
- In the KUMA field column, indicate the KUMA event field which data should be compared to LDAP attribute.
- In the LDAP attribute column, specify the attribute that must be compared with the KUMA event field. The drop-down list contains standard attributes and can be augmented with custom attributes.
- In the KUMA event field to write to column, specify in which field of the KUMA event the ID of the user account imported from LDAP should be placed if the mapping was successful.
You can use the Add row button to add a string to the table, and can use the
button to remove a string. You can use the Apply default mapping button to fill the mapping table with standard values.
Event enrichment rules for data received from LDAP were added to the group of resources for the collector.
If you add an enrichment to an existing collector using LDAP or change the enrichment settings, you must stop and restart the service.
Proceed to the next step of the Installation Wizard.
Page top
Step 7. Routing
This is an optional step of the Installation Wizard. On the Routing tab of the Installation Wizard, you can select or create destinations with settings indicating the forwarding destination of events processed by the collector. Typically, events from the collector are routed to two points: to the correlator to analyze and search for threats; and to the storage, both for storage and so that processed events can be viewed later. If necessary, events can be sent elsewhere, for example, to the event router. In that case, select the 'internal' connector at the Transport step. There can be more than one destination point.
To add an existing destination to a collector resource set:
- In the Routing step of the installation wizard, click Add.
- This opens the Create destination window; in that window, select the type of destination you want to add.
- In the Destination drop-down list, select the necessary destination.
The window name changes to Edit destination, and it displays the settings of the selected resource. To open the settings of a destination for editing in a new browser tab, click
. - Click Save.
The selected destination is displayed on the Installation Wizard tab. A destination resource can be removed from the resource set by selecting it and clicking Delete in the opened window.
To add a new destination resource to a collector resource set:
- In the Routing step of the installation wizard, click Add.
- This opens the Create destination window; in that window, specify the following settings:
- On the Basic settings tab, in the Name field, enter a unique name for the destination. The name must contain 1 to 128 Unicode characters.
- You can use the State toggle switch to enable or disable the service as needed.
- In the Type drop-down list, select the type of the destination. The following values are available:
- On the Advanced settings tab, specify the values of parameters. The set of parameters that can be configured depends on the type of the destination selected on the Basic settings tab. For detailed information about parameters and their values, click the link for each type of destination in paragraph "c." of these instructions.
The created destination is displayed on the Installation Wizard tab. A destination resource can be removed from the resource set by selecting it and clicking Delete in the opened window.
Proceed to the next step of the Installation Wizard.
Page top
Step 8. Setup validation
This is the required, final step of the Installation Wizard. At this step, KUMA creates a service resource set, and the Services are created automatically based on this set:
- The set of resources for the collector is displayed under Resources → Collectors. It can be used to create new collector services. When this set of resources changes, all services that operate based on this set of resources will start using the new parameters after the services restart. To do so, you can use the Save and restart services and Save and update service configurations buttons.
A set of resources can be modified, copied, moved from one folder to another, deleted, imported, and exported, like other resources.
- Services are displayed in Resources → Active services. The services created using the Installation Wizard perform functions inside the KUMA program. To communicate with external parts of the network infrastructure, you need to install similar external services on the servers and assets intended for them. For example, an external collector service should be installed on a server intended as an events recipient, external storage services should be installed on servers that have a deployed ClickHouse service, and external agent services should be installed on the Windows assets that must both receive and forward Windows events.
To finish the Installation Wizard:
- Click Create and save service.
The Setup validation tab of the Installation Wizard displays a table of services created based on the set of resources selected in the Installation Wizard. The lower part of the window shows examples of commands that you must use to install external equivalents of these services on their intended servers and assets.
For example:
/opt/kaspersky/kuma/kuma collector --core https://kuma-example:<port used for communication with the KUMA Core> --id <service ID> --api.port <port used for communication with the service> --install
The "kuma" file can be found inside the installer in the /kuma-ansible-installer/roles/kuma/files/ directory.
The port for communication with the KUMA Core, the service ID, and the port for communication with the service are added to the command automatically. You should also ensure the network connectivity of the KUMA system and open the ports used by its components if necessary.
- Close the Wizard by clicking Save collector.
The collector service is created in KUMA. Now the service must be installed on the server intended for receiving events.
If a wmi, wec, or etw connector was selected for collectors, you must also install the automatically created KUMA agents.
Page top
Installing a collector in a KUMA network infrastructure
A collector consists of two parts: one part is created in the KUMA Console, and the other part is installed on the network infrastructure server intended for receiving events. The second part of the collector is installed in the network infrastructure.
To install a collector:
- Log in to the server where you want to install the service.
- Execute the following command:
sudo /opt/kaspersky/kuma/kuma collector --core https://<FQDN of the KUMA Core server>:<port used by KUMA Core for internal communication (port 7210 is used by default)> --id <service ID copied from the KUMA Console> --api.port <port used for communication with the installed component>Example:
sudo /opt/kaspersky/kuma/kuma collector --core https://test.kuma.com:7210 --id XXXX --api.port YYYYIf errors are detected as a result of the command execution, make sure that the settings are correct. For example, the availability of the required access level, network availability between the collector service and the Core, and the uniqueness of the selected API port. After fixing errors, continue installing the collector.
If no errors were found, and the collector status in the KUMA Console is changed to green, stop the command execution and proceed to the next step.
The command can be copied at the last step of the installer wizard. The address and port of the KUMA Core server, the identifier of the collector to be installed, and the port that the collector uses for communication are automatically specified in the command.
When deploying several KUMA services on the same host, during the installation process you must specify unique ports for each component using the
--api.port <port>parameter. The following setting values are used by default:--api.port 7221.Before installation, ensure the network connectivity of KUMA components.
- Run the command again by adding the
--installkey:sudo /opt/kaspersky/kuma/kuma collector --core https://<KUMA Core server FQDN>:<port used by KUMA Core server for internal communication (port 7210 by default)> --id <service ID copied from the KUMA Console> --api.port <port used for communication with the installed component> --installExample:
sudo /opt/kaspersky/kuma/kuma collector --core https://kuma.example.com:7210 --id XXXX --api.port YYYY --install - Add KUMA collector port to firewall exclusions.
For the program to run correctly, ensure that the KUMA components are able to interact with other components and programs over the network via the protocols and ports specified during the installation of the KUMA components.
The collector is installed. You can use it to receive data from an event source and forward it for processing.
Page top
Validating collector installation
To verify that the collector is ready to receive events:
- In the KUMA Console, open Resources → Active services.
- Make sure that the collector you installed has the green status.
If the status of the collector is not green, view the log of this service on the machine where it is installed, in the /opt/kaspersky/kuma/collector/<collector ID>/log/collector directory. Errors are logged regardless of whether debug mode is enabled or disabled.
If the collector is installed correctly and you are sure that data is coming from the event source, the table should display events when you search for events associated with the collector.
To check for normalization errors using the Events section of the KUMA Console:
- Make sure that the Collector service is running.
- Make sure that the event source is providing events to the KUMA.
- Make sure that you selected Only errors in the Keep raw event drop-down list of the Normalizer resource in the Resources section of the KUMA Console.
- In the Events section of KUMA, search for events with the following parameters:
ServiceID = <ID of the collector to be checked>Raw != ""
If any events are found with this search, it means that there are normalization errors and they should be investigated.
To check for normalization errors using the Grafana Dashboard:
- Make sure that the Collector service is running.
- Make sure that the event source is providing events to the KUMA.
- Open the Metrics section and follow the KUMA Collectors link.
- See if the Errors section of the Normalization widget displays any errors.
If there are any errors, it means that there are normalization errors and they should be investigated.
For collectors that use WEC, WMI, or ETW connectors as the transport, make sure that a unique port is used for connecting to the agent. This port is specified in the Transport section of Collector Installation Wizard.
Page top
Ensuring uninterrupted collector operation
An uninterrupted event stream from the event source to KUMA is important for protecting the network infrastructure. Continuity can be ensured though automatic forwarding of the event stream to a larger number of collectors:
- On the KUMA side, two or more identical collectors must be installed.
- On the event source side, you must configure control of event streams between collectors using third-party server load management tools, such as rsyslog or nginx.
With this configuration of the collectors in place, no incoming events will be lost if the collector server is unavailable for any reason.
Please keep in mind that when the event stream switches between collectors, each collector will aggregate events separately.
If the KUMA collector fails to start, and its log includes the "panic: runtime error: slice bounds out of range [8:0]" error:
- Stop the collector.
sudo systemctl stop kuma-collector-<collector ID> - Delete the DNS enrichment cache files.
sudo rm -rf /opt/kaspersky/kuma/collector/<collector ID>/cache/enrichment/DNS-* - Delete the event cache files (disk buffer). Run the command only if you can afford to jettison the events in the disk buffers of the collector.
sudo rm -rf /opt/kaspersky/kuma/collector/<collector ID>/buffers/* - Start the collector service.
sudo systemctl start kuma-collector-<collector ID>
Event stream control using rsyslog
To enable rsyslog event stream control on the event source server:
- Create two or more identical collectors that you want to use to ensure uninterrupted reception of events.
- Install rsyslog on the event source server (see the rsyslog documentation).
- Add rules for forwarding the event stream between collectors to the configuration file /etc/rsyslog.conf:
*. * @@ <main collector server FQDN>: <port for incoming events>$ActionExecOnlyWhenPreviousIsSuspended on*. * @@ <backup collector server FQDN>: <port for incoming events>$ActionExecOnlyWhenPreviousIsSuspended off - Restart rsyslog by running the following command:
systemctl restart rsyslog.
Event stream control is now enabled on the event source server.
Page top
Event stream control using nginx
To control the event stream using nginx, you need to create and configure an nginx server to receive events from the event source and then forward these to collectors.
To enable nginx event stream control on the event source server:
- Create two or more identical collectors that you want to use to ensure uninterrupted reception of events.
- Install nginx on the server intended for event stream control.
- Installation command in Oracle Linux 8.6:
$sudo dnf install nginx - Installation command in Ubuntu 20.4:
$sudo apt-get install nginxWhen installing from sources, you must compile with the parameter
-with-streamoption:
$ sudo ./configure -with-stream -without-http_rewrite_module -without-http_gzip_module
- Installation command in Oracle Linux 8.6:
- On the nginx server, add the stream module to the nginx.conf configuration file that contains the rules for forwarding the stream of events between collectors.
With a large number of active services and users, you may need to increase the limit of open files in the nginx.conf settings. For example:
worker_rlimit_nofile 1000000;events {worker_connections 20000;}# worker_rlimit_nofile is the limit on the number of open files (RLIMIT_NOFILE) for workers. This is used to raise the limit without restarting the main process.# worker_connections is the maximum number of connections that a worker can open simultaneously. - Restart nginx by running the following command:
systemctl restart nginx - On the event source server, forward events to the nginx server.
Event stream control is now enabled on the event source server.
Nginx Plus may be required to fine-tune balancing, but certain balancing methods, such as Round Robin and Least Connections, are available in the base version of nginx.
For more details on configuring nginx, please refer to the nginx documentation.
Page top
Predefined collectors
The predefined collectors listed in the table below are included in the KUMA distribution kit.
Predefined collectors
Name |
Description |
|---|---|
[OOTB] CEF |
Collects CEF events received over the TCP protocol. |
[OOTB] KSC |
Collects events from Open Single Management Platform over the Syslog TCP protocol. |
[OOTB] KSC SQL |
Collects events from Open Single Management Platform using an MS SQL database query. |
[OOTB] Syslog |
Collects events via the Syslog protocol. |
[OOTB] Syslog-CEF |
Collects CEF events that arrive over the UDP protocol and have a Syslog header. |
Creating an agent
A KUMA agent consists of two parts: one part is created inside the KUMA Console, and the second part is installed on a server or on an asset in the network infrastructure.
An agent is created in several steps:
- Creating a set of resources for the agent in the KUMA Console
- Creating an agent service in the KUMA Console
- Installing the server portion of the agent to the asset that will forward messages
A KUMA agent for Windows assets can be created automatically when you create a collector with the wmi, wec, or etw transport type. Although the set of resources and service of these agents are created in the Collector Installation Wizard, they must still be installed to the asset that will be used to forward a message. In a manually created agent, a connector of the etw type can be used in only one connection. If you configure multiple connections in a manually created etw agent, the status of the etw agent status is green, but events are not transmitted and an error is logged in the etw agent log.
Multiple agents can be installed on a device; the version of all such agents must be the same.
If an older version of the agent is already installed on the device where you want to create an agent, you must first stop the installed agent (remove the agent from a Windows device or restart the agent service on a Linux device), and then you can proceed to create a new agent. However, if the version of the installed agents is the same as the version of the agent that you want to create, stopping the agents is not necessary.
When creating and running an agent whose version is 3.0.1 or later, you must accept the terms and conditions of the End User License Agreement.
Creating a set of resources for an agent
In the KUMA Console, an agent service is created based on the set of resources for an agent that unites connectors and destinations.
To create a set of resources for an agent in the KUMA Console:
- In the KUMA Console, under Resources → Agents, click Add agent.
This opens the agent creation window. The left part of the window displays tabs with base settings of the agent and connections. The Base settings tab is active.
- On the Base settings tab:
- In the Agent name field, enter a unique name for the created service. The name must contain 1 to 128 Unicode characters.
- In the Tenant drop-down list, select the tenant that will own the storage.
- If you want to enable logging of service operations, enable the Debug toggle switch.
- If you want to view the names of services or addresses of hosts from which the event came, enable the Trace event route toggle switch.
The Trace event route toggle switch is available if at least one internal destination is specified in the connections. By default, the toggle switch is Disabled.
When using the tcp, udp, http, wec, wmi, or etw connector type at the normalization stage, IP addresses of the assets from which the events were received are written to the DeviceAddress event field if it is empty.
- You can optionally add up to 256 Unicode characters describing the service in the Description field.
- Go to the tab of an existing connection or create a connection by clicking the Add button in the lower part of the left pane, then go to the tab of the newly created connection to edit its settings.
By default, a connection named Config #1 is created for a new agent. The name of the connection follows the Config #<number> pattern.
You can create multiple connections for an agent. If necessary, you can manage connections:
- Rename connections
- Duplicate connections
- Delete connections
- If necessary, in the Name of connection field, rename the connection for your convenience when managing it, for example, to be able to figure out from which connection and from which agent events arrived. If you leave the field blank, a name is assigned following the Config #<number> pattern.
The name can contain from 1 to 128 characters. The name can contain only letters and numerals and cannot contain special characters. Leading and trailing spaces are removed. When pasting a name into the field from the clipboard, if the text contains a newline, paragraph, or indentation, these characters are replaced with a space. You can reuse a name for multiple connections within the same agent.
If you have enabled event route tracing, then when viewing event information, the Events section displays the name of the connection from which the event was received.
- In the Connector group of settings, add a connector:
- If you want to select an existing connector, select it from the drop-down list.
- If you want to create a new connector, select Create new in the drop-down list and specify the following settings:
- Specify the connector name in the Name field. The name must contain 1 to 128 Unicode characters.
- In the Type drop-down list, select the connector type and specify its settings on the Basic settings and Advanced settings tabs. The available settings depend on the selected type of connector:
The agent type is determined by the connector that is used in the agent. The only exception is for agents with a destination of the diode type. These agents are considered to be diode agents.
When using the tcp or udp connector type at the normalization stage, IP addresses of the assets from which the events were received will be written in the DeviceAddress event field if it is empty.
The ability to edit previously created wec, wmi, or etw connections in agents, collectors, and connectors is limited. You can change the connection type from wec to wmi or etw and back, but you cannot change the wec, wmi, or etw connection to any other connection type. When editing other connection types, you cannot select the wec, wmi, or etw types. You can create connections without any restrictions on the types of connectors.
When adding an (existing or new) wmi, wec, or etw connector for an agent, the TLS mode and Compression settings are not displayed on the agent, but the values of these settings are stored in the agent's configuration. For a new connector, these settings are disabled by default.
If TLS mode is enabled for an existing connector that is selected in the list, you cannot download the agent configuration file. In this case, to download the configuration file, you must go to the connector resource that is being used on the agent and disable TLS mode.
The connector is added to the selected connection of the agent's set of resources. The created connector is only available in this resource set and is not displayed in the web interface Resources → Connectors section.
- In the Destinations group of settings, add a destination.
- If you want to select an existing destination, select it from the drop-down list.
- If you want to create a new destination, select Create new in the drop-down list and specify the following settings:
- Specify the destination name in the Name field. The name must contain 1 to 128 Unicode characters.
- In the Type drop-down list, select the destination type and specify its settings on the Basic settings and Advanced settings tabs. The available settings depend on the selected type of destination:
- nats-jetstream—used for NATS communications.
- tcp—used for communications over TCP.
- http—used for HTTP communications.
- diode—used to transmit events using a data diode.
- kafka—used for Kafka communications.
- file—used for writing to a file.
- Enable or disable the State toggle switch to enable or disable the sending of events to the destination. This toggle switch is turned on by default.
The advanced settings for an agent destination (such as TLS mode and compression) must match the advanced destination settings for the collector that you want to link to the agent.
There can be more than one destination point. You can add them by clicking the Add destination button and can remove them by clicking the
button. - Repeat steps 3–5 for each agent connection that you want to create.
- Click Save.
The set of resources for the agent is created and displayed under Resources → Agents. Now you can create an agent service in KUMA.
Page top
Managing connections for an agent
You can manage the connections created for the agent by renaming, duplicating, or deleting them.
Renaming a connection
By default, the name of a new connection created in a resource set for an agent follows the Connection <number> pattern. For your convenience when managing connections, you can rename them, for example, to make it clear at a glance from which connection and from which agent an event was received.
To rename a connection:
- In the KUMA Console, in the Resources → Agents section, create a new agent or click an existing agent in the table.
- If necessary, create a connection for the agent by clicking the Add button in the lower part of the left pane.
- Select the connection tab. that you want to rename
- In the Connection name field, edit the name of the connection.
The name can contain from 1 to 128 characters. The name can contain only letters and numerals and cannot contain special characters. Leading and trailing spaces are removed. When pasting a name into the field from the clipboard, if the text contains a newline, paragraph, or indentation, these characters are replaced with a space. You can reuse a name for multiple connections within the same agent.
- Click Save.
The connection is renamed. If you have enabled event route tracing, then when viewing event information, the Events section displays the name of the connection from which the event was received.
Duplicating a connection
If you want to create a connection for an agent based on an existing connection, you can create a copy of the connection with identical settings.
To duplicate a connection:
- In the KUMA Console, in the Resources → Agents section, create a new agent or click an existing agent in the table.
- If necessary, create a connection for the agent by clicking the Add button in the lower part of the left pane.
- Select the connection tab. that you want to duplicate and click the Duplicate button.
A connection is created for the agent with the same settings as the original connection. The new connection is created with one of the following names:
- If the original connection name followed the Connection <number> template, the duplicated connection name also follows this template. The connection is named "Connection <number+1>", where <number> is the number of the last created connection whose name followed the same template.
- If the original connection had been renamed, the new connection gets the same name. You can reuse a name for multiple connections within the same agent.
You can edit the name of the new connection in the Name of connection field on the tab of the connection.
Removing a connection
If the agent has more than one connection, you can delete a connection.
To delete a connection:
- In the KUMA Console, in the Resources → Agents section, create a new agent or click an existing agent in the table.
- If necessary, create a connection for the agent by clicking the Add button in the lower part of the left pane.
- Select the connection tab. that you want to delete and click the Duplicate button.
You cannot restore a deleted connection, but you can recover the version of the agent in which this connection was previously saved through the change history.
Page top
Creating an agent service in the KUMA Console
When a set of resources is created for an agent, you can proceed to create an agent service in KUMA.
To create an agent service in the KUMA Console:
- In the KUMA Console, under Resources → Active services, click Add service.
- In the opened Choose a service window, select the set of resources that was just created for the agent and click Create service.
The agent service is created in the KUMA Console and is displayed under Resources → Active services. Now agent services must be installed to each asset from which you want to forward data to the collector. A service ID is used during installation.
Page top
Installing an agent in a KUMA network infrastructure
When an agent service is created in KUMA, you can proceed to installation of the agent to the network infrastructure assets that will be used to forward data to a collector.
Multiple agents can be installed on a device; the version of all such agents must be the same.
Prior to installation, verify the network connectivity of the system and open the ports used by its components.
Installing a KUMA agent on Linux assets
KUMA agent installed on Linux devices stops when you close the terminal or restart the server. If you do not want to start KUMA agents manually, we recommend installing agents using an application that automatically starts applications whenever the server is restarted, for example, the Supervisor application. If you want to start KUMA agents automatically, specify the automatic start and restart settings in the KUMA configuration file. For more information on configuring automatic starting and restarting, see the official documentation of applications for automatically starting applications.
Example configuration in Supervisor
To install a KUMA agent to a Linux asset:
- On the Linux device on which you want to install the KUMA agent, create directories for the KUMA configuration file and agents, for example:
- /opt/kaspersky/kuma
- /opt/kaspersky/agent
- Place the KUMA configuration file in the directory created for it. The KUMA configuration file can be found inside the installer in the /kuma-ansible-installer/roles/kuma/files directory.
Make sure the kuma file has sufficient rights to run.
- Create the KUMA user:
sudo useradd --system kuma && usermod -s /usr/bin/false kuma - Grant the KUMA user access to the directory with the KUMA configuration file and to all files within the directory:
sudo chown -R kuma:kuma <path to the directory with the KUMA configuration file> - Install the KUMA agent:
sudo /opt/kaspersky/kuma/kuma agent --core https://<KUMA Core server FQDN>:<port used by KUMA Core for internal communication (port 7210 by default)> --id <service ID copied from the KUMA Console> --wd <path to the directory that will contain the files of the installed KUMA agent.If this option is not specified, the files will be stored in the directory where the KUMA file is located> [--accept-eula]You can install two KUMA agents on the same Linux device. In this case, KUMA agents will work in parallel. When installing the second KUMA agent, you need to specify a separate directory for it using the
--wdoption.To run the agent, you need to accept the End User License Agreement. You can add the
--accept-eulaoption to the command to automatically accept the End User License Agreement during KUMA agent installation. This lets you perform the installation non-interactively. If you do not specify this option, you will need to accept or reject the License Agreement manually during the installation of the KUMA agent.Examples of installing the KUMA agent:
- Installing the KUMA agent without automatically accepting the End User License Agreement:
sudo /opt/kaspersky/kuma/kuma agent --core https://kuma.example.com:7210 --id XXXX --wd /opt/kaspersky/kuma/agent/XXXX - Installing the KUMA agent with automatic acceptance of the End User License Agreement:
sudo /opt/kaspersky/kuma/kuma agent --core https://kuma.example.com:7210 --id XXXX --wd /opt/kaspersky/kuma/agent/XXXX --accept-eula
By using the
--accept-eulaoption during the installation of the KUMA agent, you confirm that you agree with and accept the terms and conditions of the End User License Agreement. - Installing the KUMA agent without automatically accepting the End User License Agreement:
- If you chose KUMA installation with the automatic acceptance of the End User License Agreement and want to read the text of the End User License Agreement, or if the text of the End User License Agreement was not automatically provided to you during the installation process, run the following command:
./kuma license --show
The KUMA agent is installed on the Linux device.
You can configure the collector to receive data that the KUMA agent sends to KUMA.
Page top
Installing a KUMA agent on Windows assets
Prior to installing a KUMA agent to a Windows asset, the server administrator must create a user account with the EventLogReaders and Log on as a service permissions on the Windows asset. This user account must be used to start the agent.
If you want to run the agent under a local account, you will need administrator rights and Log on as a service. If you want to perform the collection remotely and only read logs under a domain account, EventLogReaders rights are sufficient.
To install a KUMA agent to a Windows asset:
- Copy the kuma.exe file to a folder on the Windows asset.
C:\Users\<User name>\Desktop\KUMAfolder is recommended for installation.The kuma.exe file is located inside the installer in the /kuma-ansible-installer/roles/kuma/files/ folder.
- Start the Command Prompt on the Windows asset with Administrator privileges and locate the folder containing the kuma.exe file.
- Execute the following command:
kuma agent --core https://<fully qualified domain name of the KUMA Core server>:<port used by the KUMA Core server for internal communications (port 7210 by default)> --id <ID of the agent service that was created in KUMA> --user <name of the user account used to run the agent, including the domain> --install [--accept-eula]To run the agent, you need to accept the End User License Agreement. You can add the
--accept-eulaoption to the command to automatically accept the End User License Agreement during agent installation. This lets you perform the installation non-interactively. If you do not specify this option, you will need to accept or reject the License Agreement manually during the installation of the KUMA agent.Examples:
- Installing the KUMA agent without automatically accepting the End User License Agreement:
kuma agent --core https://kuma.example.com:7210 --id XXXXX --user domain\username --install - Installing the KUMA agent with automatic acceptance of the End User License Agreement:
kuma agent --core https://kuma.example.com:7210 --id XXXXX --user domain\username --install --accept-eula
By using the
--accept-eulaoption during the installation of the KUMA agent, you confirm that you agree with and accept the terms and conditions of the End User License Agreement.You can get help information by executing the
kuma help agentcommand. - Installing the KUMA agent without automatically accepting the End User License Agreement:
- If you started the installation of the agent without automatically accepting the End User License Agreement, during the installation process, you will be prompted to read the text of the End User License Agreement and you will have the opportunity to accept or reject the agreement.
- If you chose installation with the automatic acceptance of the End User License Agreement and want to read the text of the End User License Agreement, or if the text of the End User License Agreement was not automatically provided to you during the installation process, run the following command:
kuma.exe license --showIf you want to accept the End User License Agreement, run the following command and press
y:kuma.exe license - Enter the password of the user account used to run the agent.
The C:\Program Files\Kaspersky Lab\KUMA\agent\<agent ID> folder is created and the KUMA agent service is installed in it. The agent forwards Windows events to KUMA, and you can set up a collector to receive them.
When the agent service is installed, it starts automatically. The service is also configured to restart in case of any failures. The agent can be restarted from the KUMA Console, but only when the service is active. Otherwise, the service needs to be manually restarted on the Windows asset.
Removing a KUMA agent from Windows assets
When configuring services, you can check the configuration for errors before installation by running the agent with the following command:
kuma agent --core https://<fully qualified domain name of the KUMA Core server>:<port used by the KUMA Core server for internal communications (port 7210 by default)> --id <ID of the agent service that was created in KUMA> --user <name of the user account used to run the agent, including the domain>
Automatically created agents
When creating a collector with wec, wmi, or etw connectors, agents are automatically created for receiving Windows events.
Automatically created agents have the following special conditions:
- Automatically created agents can have only one connection.
- Automatically created agents are displayed under Resources → Agents, and
auto createdis indicated at the end of their name. Agents can be reviewed or deleted. - The settings of automatically created agents are defined automatically based on the collector settings from the Connect event sources and Transport sections. You can change the settings only for a collector that has a created agent.
- The description of an automatically created agent is taken from the collector description in the Connect event sources section.
- Debugging of an automatically created agent is enabled and disabled in the Connect event sources section of the collector.
- When deleting a collector with an automatically created agent, you will be prompted to choose whether to delete the collector together with the agent or to just delete the collector. When deleting only the collector, the agent will become available for editing.
- When deleting automatically created agents, the type of collector changes to http, and the connection address is deleted from the URL field of the collector.
- If at least one Windows log name in wec or wmi connector is specified incorrectly, the agent will not receive events from any Windows log listed in the connector. At the same time the agent status will be green. Attempts to receive events will be repeated every 60 seconds, and error messages will be added to the service log.
- If in a connector of the etw type, the session name is specified incorrectly, the wrong provider is specified in the session, or an incorrect method is specified for sending events (to send events correctly, on the Windows Server side, you must specify "Real time" or "File and Real time" mode), events will not arrive from the agent, an error will be recorded in the agent log on Windows, and the status of the agent will be green. At the same time, no attempt will be made to get events every 60 seconds. If you modify session settings on the Windows side, you must restart the etw agent and/or the session for the changes to take effect.
In the KUMA interface, automatically created agents appear at the same time when the collector is created. However, they must still be installed on the asset that will be used to forward a message.
Page top
Update agents
When updating KUMA versions, the WMI, WEC, and ETW agents installed on remote machines must also be updated.
To update the agent, use an administrator account and follow these steps:
- In the KUMA Console, in the Resources → Active services - Agents section, select the agent that you want to update and copy its ID.
You need the ID to install the new agent with the same ID after removing the old agent.
- In Windows, in the Services section, open the agent and click Stop.
- On the command line, go to the folder where the agent is installed and run the command to remove the agent from the server.
kuma.exe agent --id <
ID of agent service that was created in KUMA> --uninstall - Place the new agent in the same folder.
- On the command line, go to the folder with the new agent and from that folder, run the installation command using the agent ID from step 1.
kuma agent --core https://<
fullly qualified domain name of the KUMA Core server>:<port used by the KUMA Core server for internal communications (port 7210 by default)> --id <ID of the agent service that was created in KUMA> --user <name of the user account used to run the agent, including the domain> --install - When installing the updated agent on a device for the first timelicense confirmation is required. During the installation process, you are prompted to read the text of the license and then accept or reject the agreement. If this did not happen automatically, you can use the following command to view the text of the license:
kuma.exe license --showIf you want to accept the license agreement, run the command and press
y:kuma.exe license
The agent is updated.
Page top
Transferring events from isolated network segments to KUMA
Data transfer scenario
Data diodes can be used to transfer events from isolated network segments to KUMA. Data transfer is organized as follows:
- The KUMA agent that is installed on a standalone server, with a diode destination receives events and moves them to a directory from which the data diode will pick up the events.
The agent accumulates events in a buffer until it overflows or for a user-defined period after the last write to disk. The events are then written to a file in the temporary directory of the agent. The file is moved to the directory processed by the data diode; its name is a combination of the file contents hash (SHA-256) and the file creation time.
- The data diode moves files from the isolated server directory to the external server directory.
- A KUMA collector with a diode connector installed on an external server reads and processes events from the files of the directory where the data diode places files.
After all events are read from a file, it is automatically deleted. Before reading events, the contents of files are verified based on the hash in the file name. If the contents fail verification, the file is deleted.
In the described scenario, the KUMA components are responsible for moving events to a specific directory within the isolated segment and for receiving events from a specific directory in the external network segment. The data diode transfers files containing events from the directory of the isolated network segment to the directory of the external network segment.
For each data source within an isolated network segment, you must create its own KUMA collector and agent, and configure the data diode to work with separate directories.
Configuring KUMA components
Configuring KUMA components for transferring data from isolated network segments consists of the following steps:
- Creating a collector service in the external network segment.
At this step, you must create and install a collector to receive and process the files that the data diode will transfer from the isolated network segment. You can use the Collector Installation Wizard to create the collector and all the resources it requires.
At the Transport step, you must select or create a connector of the diode type. In the connector, you must specify the directory to which the data diode will move files from the isolated network segment.
The user "kuma" that runs the collector must have read/write/delete permissions in the directory to which the data diode moves data from the isolated network segment.
- Creating a set of resources for a KUMA agent.
At this step, you must create a set of resources for the KUMA agent that will receive events in an isolated network segment and prepare them for transferring to the data diode. The diode agent resource set has the following requirements:
- The destination in the agent must have the diode type. In this resource, you must specify the directory from which the data diode will move files to the external network segment.
- You cannot select connectors of the sql or netflow types for the diode agent.
- TLS mode must be disabled in the connector of the diode agent.
- Downloading the agent configuration file as JSON file.
- The set of agent resources from a diode-type destination must be downloaded as a JSON file.
- If secret resources were used in the agent resource set, you must manually add the secret data to the configuration file.
- Installing the KUMA agent service in the isolated network segment.
At this step, you must install the agent in an isolated network segment based on the agent configuration file that was created at the previous step. It can be installed to Linux and Windows devices.
Configuring a data diode
The data diode must be configured as follows:
- Data must be transferred atomically from the directory of the isolated server (where the KUMA agent places the data) to the directory of the external server (where the KUMA collector reads the data).
- The transferred files must be deleted from the isolated server.
For information on configuring the data diode, please refer to the documentation for the data diode used in your organization.
Special considerations
When working with isolated network segments, operations with SQL and NetFlow are not supported.
When using the scenario described above, the agent cannot be administered through the KUMA Console because it resides in an isolated network segment. Such agents are not displayed in the list of active KUMA services.
Diode agent configuration file
A created set of agent resources with a diode-type destination can be downloaded as a configuration file. This file is used when installing the agent in an isolated network segment.
To download the configuration file:
In the KUMA Console, under Resources → Agents, select the required set of agent resources with a diode destination and click Download config.
The agent settings configuration is downloaded as a JSON file based on the settings of your browser. Secrets used in the agent resource set are downloaded empty. Their IDs are specified in the file in the "secrets" section. To use a configuration file to install an agent in an isolated network segment, you must manually add secrets to the configuration file (for example, specify the URL and passwords used in the agent connector to receive events).
You must use an access control list (ACL) to configure permissions to access the file on the server where the agent will be installed. File read access must be available to the user account that will run the diode agent.
Below is an example of a diode agent configuration file with a kafka connector.
{ "config": { "id": "<ID of the set of agent resources>", "name": "<name of the set of agent resources>", "proxyConfigs": [ { "connector": { "id": "<ID of the connector. This example shows a kafka-type connector, but other types of connectors can also be used in a diode agent. If a connector is created directly in the set of agent resources, the ID is not defined.>", "name": "<name of the connector>", "kind": "kafka", "connections": [ { "kind": "kafka", "urls": [ "localhost:9093" ], "host": "", "port": "", "secretID": "<ID of the secret>", "clusterID": "", "tlsMode": "", "proxy": null, "rps": 0, "maxConns": 0, "urlPolicy": "", "version": "", "identityColumn": "", "identitySeed": "", "pollInterval": 0, "query": "", "stateID": "", "certificateSecretID": "", "authMode": "pfx", "secretTemplateKind": "", "certSecretTemplateKind": "" } ], "topic": "<kafka topic name>", "groupID": "<kafka group ID>", "delimiter": "", "bufferSize": 0, "characterEncoding": "", "query": "", "pollInterval": 0, "workers": 0, "compression": "", "debug": false, "logs": [], "defaultSecretID": "", "snmpParameters": [ { "name": "", "oid": "", "key": "" } ], "remoteLogs": null, "defaultSecretTemplateKind": "" }, "destinations": [ { "id": "<ID of the destination. If the destination is created directly in the set of agent resources, the ID is not defined.>", "name": "<destination name>", "kind": "diode", "connection": { "kind": "file", "urls": [ "<path to the directory where the destination should place events that the data diode will transmit from the isolated network segment>", "<path to the temporary directory in which events are placed to prepare for data transmission by the diode>" ], "host": "", "port": "", "secretID": "", "clusterID": "", "tlsMode": "", "proxy": null, "rps": 0, "maxConns": 0, "urlPolicy": "", "version": "", "identityColumn": "", "identitySeed": "", "pollInterval": 0, "query": "", "stateID": "", "certificateSecretID": "", "authMode": "", "secretTemplateKind": "", "certSecretTemplateKind": "" }, "topic": "", "bufferSize": 0, "flushInterval": 0, "diskBufferDisabled": false, "diskBufferSizeLimit": 0, "healthCheckPath": "", "healthCheckTimeout": 0, "healthCheckDisabled": false, "timeout": 0, "workers": 0, "delimiter": "", "debug": false, "disabled": false, "compression": "", "filter": null, "path": "" } ] } ], "workers": 0, "debug": false }, "secrets": { "<secret ID>": { "pfx": "<encrypted pfx key>", "pfxPassword": "<password of the encrypted pfx key. The changeit value is exported from KUMA instead of the actual password. In the configuration file, you must manually specify the contents of secrets>" } }, "tenantID": "<ID of the tenant>" } |
Description of secret fields
Secret fields
Field name |
Type |
Description |
|
string |
User name |
|
string |
Password |
|
string |
Token |
|
array of strings |
URL list |
|
string |
Public key (used in PKI) |
|
string |
Private key (used in PKI) |
|
string containing the base64-encoded pfx file |
Base64-encoded contents of the PFX file. In Linux, you can get the base64 encoding of a file by running the following command:
|
|
string |
Password of the PFX |
|
string |
Used in snmp3. Possible values: |
|
string |
Used in snmp1 |
|
string |
Used in snmp3. Possible values: |
|
string |
Used in snmp3. Possible values: |
|
string |
Used in snmp3 |
|
string containing the base64-encoded pem file |
Base64-encoded contents of the PEM file. In Linux, you can get the base64 encoding of a file by running the following command:
|
Installing Linux Agent in an isolated network segment
To install a KUMA agent to a Linux device in an isolated network segment:
- Place the following files on the Linux server in an isolated network segment that will be used by the agent to receive events and from which the data diode will move files to the external network segment:
- Agent configuration file.
You must use an access control list (ACL) to configure access permissions for the configuration file so that only the KUMA user will have file read access.
- Executive file /opt/kaspersky/kuma/kuma (the "kuma" file can located in the installer in the /kuma-ansible-installer/roles/kuma/files/ folder).
- Agent configuration file.
- Execute the following command:
sudo ./kuma agent --cfg <path to the agent configuration file> --wd <path to the directory where the files of the agent being installed will reside. If this flag is not specified, the files will be stored in the directory where the kuma file is located>
The agent service is installed and running on the server in an isolated network segment. It receives events and relays them to the data diode so that they can be sent to an external network segment.
Page top
Installing Windows Agent in an isolated network segment
Prior to installing a KUMA agent to a Windows asset, the server administrator must create a user account with the EventLogReaders and Log on as a service permissions on the Windows asset. This user account must be used to start the agent.
To install a KUMA agent to a Windows device in an isolated network segment:
- Place the following files on the Window server in an isolated network segment that will be used by the agent to receive events and from which the data diode will move files to the external network segment:
- Agent configuration file.
You must use an access control list (ACL) to configure access permissions for the configuration file so that the file can only be read by the user account that will run the agent.
- Kuma.exe executable file. This file can be found inside the installer in the /kuma-ansible-installer/roles/kuma/files/ directory.
It is recommended to use the
C:\Users\<user name>\Desktop\KUMAfolder. - Agent configuration file.
- Start the Command Prompt on the Windows asset with Administrator privileges and locate the folder containing the kuma.exe file.
- Execute the following command:
kuma.exe agent --cfg <path to the agent configuration file> --user <user name that will run the agent, including the domain> --installYou can get installer Help information by running the following command:
kuma.exe help agent - Enter the password of the user account used to run the agent.
The C:\Program Files\Kaspersky Lab\KUMA\agent\<Agent ID> folder is created in which the KUMA agent service is installed. The agent moves events to the folder so that they can be processed by the data diode.
When installing the agent, the agent configuration file is moved to the directory C:\Program Files\Kaspersky Lab\KUMA\agent\<agent ID specified in the configuration file>. The kuma.exe file is moved to the C:\Program Files\Kaspersky Lab\KUMA directory.
When installing an agent, its configuration file must not be located in the directory where the agent is installed.
When the agent service is installed, it starts automatically. The service is also configured to restart in case of any failures.
Removing a KUMA agent from Windows assets
When configuring services, you can check the configuration for errors before installation by running the agent with the following command:
kuma.exe agent --cfg <path to agent configuration file>
Transferring events from Windows machines to KUMA
To transfer events from Windows machines to KUMA, a combination of a KUMA agent and a KUMA collector is used. Data transfer is organized as follows:
- The KUMA agent installed on the machine receives Windows events:
- Using the WEC connector: the agent receives events arriving at the host under a subscription, as well as the server logs.
- Using the WMI connector: the agent connects to remote servers specified in the configuration and receives events.
- Using the ETW connector: the agent connect to the DNS server using the session name and provider specified in the connector settings, and receives events.
- The agent sends events (without preprocessing) to the KUMA collector specified in the destination.
You can configure the agent so that different logs are sent to different collectors.
- The collector receives events from the agent, performs a full event processing cycle, and sends the processed events to the destination.
Receiving events from the WEC agent is recommended when using centralized gathering of events from Windows hosts using Windows Event Forwarding (WEF). The agent must be installed on the server that collects events; it acts as the Windows Event Collector (WEC). We do not recommend installing KUMA agents on every endpoint host from which you want to receive events.
The process of configuring the receipt of events using the WEC Agent is described in detail in the appendix: Configuring receipt of events from Windows devices using KUMA Agent (WEC).
For details about the Windows Event Forwarding technology, please refer to the official Microsoft documentation.
We recommend receiving events using the WMI agent in the following cases:
- If it is not possible to use the WEF technology to implement centralized gathering of events, and at the same time, installation of third-party software (for example, the KUMA agent) on the event source server is prohibited.
- If you need to obtain events from a small number of hosts — no more than 500 hosts per one KUMA agent.
The ETW agent is used only to retrieve events from Windows logs of DNS servers.
For connecting Windows logs as an event source, we recommend using the "Add event source" wizard. When using a wizard to create a collector with WEC or WMI connectors, agents are automatically created for receiving Windows events. You can also manually create the resources necessary for collecting Windows events.
An agent and a collector for receiving Windows events are created and installed in several stages:
- Creating a set of resources for an agent.
Agent connector:
When creating an agent, on the Connection tab, you must create or select a connector of the WEC, WMI, or ETW type.
If at least one Windows log name in a WEC or WMI connector is specified incorrectly, the agent will receive events from all Windows logs listed in the connector, except the problematic log. At the same time the agent status will be green. Attempts to receive events will be repeated every 60 seconds, and error messages will be added to the service log.
Agent destination:
The type of agent destination depends on the data transfer method you use: nats-jetstream, tcp, http, diode, kafka, file.
You must use the
\0value as the destination separator.The advanced settings for the agent destination (such as separator, compression and TLS mode) must match the advanced destination settings for the collector connector that you want to link to the agent.
- Create an agent service in the KUMA Console.
- Installing the KUMA agent on the Windows machine from which you want to receive Windows events.
Before installation, make sure that the system components have access to the network and open the necessary network ports:
- Port 7210, TCP: from server with collectors to the Core.
- Port 7210, TCP: from agent server to the Core.
- The port configured in the URL field when the connector was created: from the agent server to the server with the collector.
- Creating and installing KUMA collector.
When creating a set of collectors, at the Transport step, you must create or select a connector that the collector will use to receive events from the agent. Connector type must match the type of the agent destination.
The advanced settings of the connector (such as delimiter, compression, and TLS mode) must match the advanced settings of the agent destination that you want to link to the agent.
AI score and asset status
The AI score and asset status service can be installed if your license covers the AI module.
The AI service helps with precisely assessing the severity of correlation events generated as a result of correlation rules triggering.
The AI service gets correlation events with a non-empty Affected assets field from the available storage clusters, constructs the expected sequence of events, and trains the AI model. Based on the chain of triggered correlation rules, the AI service calculates whether such a sequence of events is typical for this infrastructure. Non-typical patterns increase the score of the asset.
The AI service calculates the AI score and the Status, which are displayed in the asset card. If you remove the license, the AI score and Status fields are hidden from the asset card. If you add the license again, the values of the AI score and Status fields are shown again.
The score is a number that quantifies how non-typical the activity on the asset is, and whether it is worth paying attention to. Possible values of the Status field: Low, Medium, High, Critical. The score is a number in the range from 0 to 1.
There are four ranges that correspond to statuses:
Low: 0 ≤ score < 0.25
Medium: 0.25 ≤ score < 0.5
High: 0.5 ≤ score < 0.75
Critical: 0.75 ≤ score ≤ 1
You can apply a filter by the AI score and Status fields when searching for assets. You can also set up proactive categorization of assets by the AI score and Status fields, which moves the asset to the category corresponding to the risk level as soon as the AI service assigns a score to the asset.
You can create a structure of multiple categories and automatically populate these with assets in accordance with the calculated risk values.
In the Settings → Asset audit section, you can configure audit events to be generated when an asset is added to a category. Audit events can be taken into account in correlation rules, and you can monitor them on the dashboard and in reports.
To monitor asset category changes on the dashboard, create an Events widget with a query similar to the following:
SELECT count(ID) AS `metric`, formatDateTime(toTimeZone(fromUnixTimestamp64Milli(Timestamp), 'Europe/Moscow'), '%d.%m.%Y %H:%m:%S') AS `value` FROM `events`
where DeviceVendor = 'Kaspersky' and DeviceProduct = 'KUMA' and
DeviceEventCategory = 'Audit assets' and DeviceAction= 'asset added to category'
and DeviceCustomString1 = 'Main/Categorized assets/ML/score>0.5'
GROUP BY Timestamp ORDER BY value LIMIT 250
To monitor the distribution of assets by status on the dashboard, create an Assets by severity widget. The Assets by severity widget is available if the license includes the AI module. The pie chart indicates the numbers of assets grouped by status.
Every time the AI service is restarted, the AI service trains the model from scratch and reassesses the score of the assets mentioned in events of the current day.
The directory specified in the configuration file stores events that the AI service got from KUMA storage clusters for the specified number of days. For example, if the configuration file specifies 12 days, the AI service gets events for the past 12 days. The oldest events are deleted from the directory. The trained model is stored in the same directory.
The model is retrained at midnight UTC. The asset score is reassessed once an hour for all assets that were mentioned in events of the current day (UTC).
Service logs are stored in /var/log/syslog.
Installing and removing the AI score and asset status service
Installing the AI score and asset status service
To install the service:
- Unpack the mlservice-installer-0.1.54.XX.tgz archive that is included in the distribution kit.
The mlservice-installer-0.1.54.XX.tgz archive contains scripts for installing and removing the service, as well as the config.yaml configuration file.
- In the config.yaml configuration file, in the
kuma_addresssetting, specify the FQDN of the host on which KUMA Core is installed and the port on which the KUMA Core is to listen for AI service connections.In a high availability configuration, you must specify port 7226. You can keep default values for the rest of the settings. After installation, the service starts with the settings specified in the config.yaml file.
- If you want to install the service on a remote host, specify the address of the remote host in the inventory.yaml file and make sure you have network access. By default, the service is installed on the local host as specified in inventory.yaml.
- Get the Core certificate in the KUMA Console: in the Administrator menu, click REST API CA certificate. The certificate is downloaded to your default download directory.
- Save the KUMA Core certificate file in the roles/mlservice/files directory under the installer directory.
- Change to the directory with the service files and from that directory, run the following command:
./install <path to inventory.yaml> - If you accept the terms and conditions of the EULA, press
Y. If you do not accept the terms and conditions of the EULA, you cannot proceed with the installation of the service. You can find the file with the text of the EULA in the mlservice-installer/eula directory. - The installer generates the necessary certificate and key during the installation process and places these in the directories specified in the config.yaml configuration file. You must upload the certificate to KUMA.
In the KUMA Console, in the Settings → AI service section, in the AI score and asset status window, fill in the following fields:
- In the URL field, specify the FQDN of the host on which the KUMA Core is installed and port on which the KUMA Core is to listen for the AI service. For example, <FQDN of the host on which KUMA Core is installed>:7226 The port number must match the port number specified in the configuration file. Make sure the port is not being used by other applications.
For a KUMA installation in high availability configuration, the URL field is not displayed in the interface, the port value is taken from the KUMA_APPRAISER_AI_API_PORT environment variable and the port is opened for all IP addresses of the KUMA Core host.
- In the Certificate drop-down list, select Create new to open the Create secret window; in that window, specify Certificate as the secret type and upload the certificate from the directory specified in the config.yaml configuration file.
- Move the Disabled toggle switch to the inactive position. By default, the toggle switch is on.
- Click Save.
Immediately after installation, the service will make attempts to connect to KUMA for 15 minutes with 1-minute intervals. If no certificate is added in the KUMA Console, the connection will fail and the service will stop. In this case, you can add a certificate and restart the AI service; the service will make new attempts to connect.
After saving the settings, get the log of the Core server and make sure it does not contain the "<port number>: bind: address already in use" error
- In the URL field, specify the FQDN of the host on which the KUMA Core is installed and port on which the KUMA Core is to listen for the AI service. For example, <FQDN of the host on which KUMA Core is installed>:7226 The port number must match the port number specified in the configuration file. Make sure the port is not being used by other applications.
The AI service is installed.
Removing the AI score and asset status service
To remove the AI service, change to the directory with the AI service files, and from that directory, run the following:
./uninstall <path to inventory.yaml>
Settings of the AI score and asset status service
Available AI service settings
Setting |
Description |
|---|---|
|
Path to the directory that contains the certificate generated by the installer. Default path: /opt/kaspersky/mlservice/service.crt You can specify a different path. In this case, make sure that the user that starts the service has access to the specified directory. |
|
Path to the directory that contains the key generated by the installer. Default path: /opt/kaspersky/mlservice/service.key You can specify a different path. In this case, make sure that the user that starts the service has access to the specified directory. |
|
FQDN of the host on which the KUMA Core is installed and port on which the KUMA Core is to listen for the AI service. To install in a high availability configuration, you must specify port 7226. Example: <FQDN of the host on which KUMA Core is installed>:7226
|
|
Path to the directory where the KUMA Core certificate is located. Default path: /opt/kaspersky/mlservice/core-external-ca.cert |
|
Path to the directory where the service is to place received correlation events. Default path: /var/mlservice/events |
|
Path to the directory where the service is to place the trained model. Default path: /var/mlservice/models |
|
The number of days for which you want to get correlation events that involve your assets from the available storage clusters in order to train the model. The default setting is 12 days. This means that the directory will contain events for the past <N> days. The oldest events are deleted. |
|
Overlap time. When events for assessing the scores of assets are downloaded on a schedule, they are retrieved from the time of the last downloaded event for the current day minus the value of the events_overlap_in_seconds setting. The default value is 60 seconds. Example: the time when the last event was received is 8:58. The starting time for the next batch of events to be downloaded is 8:57. |
Analyze using KIRA
In KUMA, you can use Kaspersky Investigation and Response Assistant (KIRA) to analyze the command that triggered the correlation rule. The command is written to the event field if normalization is configured to write the command to the event field. You can view the command in the event card or the correlation event card and click Analyze using KIRA in the upper part of the event card to send a request to KIRA. KIRA performs deobfuscation and displays the cached result of the previous request for the command if such a request was performed earlier. This helps investigate alerts and incidents. The analysis results are kept in cache for 14 days and are available for repeated viewing. Each time a request is sent, an audit event is generated.
This functionality is available in the RU region if the following conditions are satisfied:
- An active license covering the AI module is available.
If the license has expired, the analysis results remain available through tasks during the lifetime of the cache, that is, for 14 days from the moment the result is cached.
- A certificate was uploaded when configuring the KIRA integration. You can get the certificate file in PFX format, packed in the <customer name>.ZIP archive, and the password for the certificate from Technical Support.
- The user has one of the following roles with corresponding access rights: General administrator, Administrator, Tier 2 analyst, Tier 1 analyst, and Junior analyst. Only a user with the General administrator role can configure the integration.
Configuring integration with KIRA
To configure integration with KIRA:
- Get a license with the AI module and activate in KUMA.
- In the KUMA Console, go to the Settings → AI services section and in the AI services window, go to the KIRA tab.
- On the KIRA tab, in the Certificate drop-down list, click Select file and upload the certificate file in PFX format, packed into the <customer name>.ZIP archive.
- In the Certificate password field, enter the password.
- If necessary, in the Proxy server drop-down list, select a previously created resource or create a new resource.
- Click Save.
After clicking Save, you are prompted to accept the terms of use of the service. If you do not accept the terms of use, you cannot proceed to save settings and use the functionality.
After saving the settings, the available number of tokens is displayed. The allowance is reset every day.
If you want to disable this functionality, turn on the Disable toggle switch.
Integration is configured, you can proceed to the analysis. Analysis is available for all events: new and previously received.
Page top
Analyzing using KIRA
After configuring the integration, you can analyze commands using KIRA.
To perform an analysis:
- Go to the card of the event or correlation event and on the toolbar in the event card, in the Analyze using KIRA drop-down list, select the field whose value you want to analyze.
This opens the Analyze using KIRA window.
- This opens the Analyze using KIRA window, displaying the command to be analyzed. You can do the following:
- If the command is obfuscated, it is de-obfuscated automatically without spending tokens. If you want to analyze the command in obfuscated form, in the Actions drop-down list, select Revert to original string. If necessary, you can de-obfuscate the string again.
- If you want to know in advance how many tokens will be spent on analysis, in the Actions drop-down list, select Calculate size in tokens. Number of tokens for analysis = number of tokens to send a request + number of tokens to produce a response.
- To analyze the command, click the Analyze button.
If you have enough tokens, the analysis and the Request to KIRA task are started.
Processing the request may take 30 seconds or longer.
Tokens are expended even if the request returns an error saying that the requested topic is in the deny list; the information about remaining tokens is also updated.
The command is analyzed.
The result of the analysis is available in the same Analyze using KIRA window: the output, a brief summary, and a detailed analysis. You can also view the result in a separate window by clicking View result in the pop-up notification. This opens a separate KIRA result window, from which you can also click the link to Go to event. After the analysis is completed, the Result is displayed on the KIRA analysis tab in the event card and is available for viewing by all users with access to the Analyze using KIRA functionality.
You can also view the result of the analysis in the Task manager section in the properties of the Request to KIRA task. You can click the name of the task to select one of the following commands in the context menu:
- View result shows the results of the task from the cache to any user with access to KIRA tasks; no tokens are expended.
- Restart performed the analysis disregarding the data of the previous analysis stored in the cache; the analysis expends tokens.
Possible errors of the Analyze using KIRA task
Possible errors
HTTP code |
Description |
400 |
Invalid client certificate. |
404 |
Error in request. |
401 |
Missing certificate information. Please contact Technical Support. |
403 |
Daily limit of tokens exhausted. |
413 |
Maximum number of tokens for request reached. Make the request smaller. |
500 |
Unknown error of the service. |
502 |
KIRA service unavailable. |
503 |
Error getting access token in service. |
Other |
Unknown error. |
No code |
Error while processing the request. |
Configuring event sources
This section provides information on configuring the receipt of events from various sources.
Configuring receipt of Auditd events
KUMA lets you monitor and audit the Auditd events on Linux devices.
Before configuring event receiving, make sure to create a new KUMA collector for the Auditd events.
Configuring the receipt of Auditd events proceeds in stages:
- Configuring the KUMA collector for receiving Auditd events.
- Configuring the event source server.
- Verifying receipt of Auditd events by the KUMA collector.
You can verify that the Auditd event source server is configured correctly by searching for related events in the KUMA Console.
Configuring the KUMA collector for receiving Auditd events
At the Transport step, make the Auditd option active.
After creating a collector, in order to configure event receiving using rsyslog, you must install a collector on the network infrastructure server intended for receiving events.
For details on installing the KUMA collector, refer to the Installing collector in the network infrastructure section.
Page top
Configuring the event source server
The rsyslog service is used to transmit events from the server to the KUMA collector.
To configure transmission of events from the server to the collector:
- Make sure that the rsyslog service is installed on the event source server. For this purpose, execute the following command:
systemctl status rsyslog.serviceIf the rsyslog service is not installed on the server, install it by executing the following command:
yum install rsyslogsystemctl enable rsyslog.servicesystemctl start rsyslog.service - Edit the audit.service configuration file /etc/audit/auditd.conf and change the value of the
name_formatparameter toNONE:name_format=NONEAfter editing the settings, restart the auditd service:
sudo systemctl restart auditd.service - In the /etc/rsyslog.d directory, create the audit.conf file with the following content, depending on your protocol:
- To send events over TCP:
$ModLoad imfile$InputFileName /var/log/audit/audit.log$InputFileTag tag_audit_log:$InputFileStateFile audit_log$InputFileSeverity info$InputFileFacility local6$InputRunFileMonitor*.* @@<KUMA collector IP address>:<KUMA collector port>For example:*.* @@192.1.3.4:5858 To send events over UDP:$ModLoad imfile$InputFileName /var/log/audit/audit.log$InputFileTag tag_audit_log:$InputFileStateFile audit_log$InputFileSeverity info$InputFileFacility local6$InputRunFileMonitortemplate(name="AuditFormat" type="string" string="<%PRI%>%TIMESTAMP:::date-rfc3339% %HOSTNAME% %syslogtag% %msg%\n")*.* @<KUMA collector IP address>:<KUMA collector port>For example:*.* @192.1.3.4:5858;AuditFormat
- To send events over TCP:
- Save the changes to the audit.conf file.
- Restart the rsyslog service by executing the following command:
systemctl restart rsyslog.service
The event source server is configured. Data about events is transmitted from the server to the KUMA collector.
Page top
Configuring receipt of KATA/EDR events
You can configure the receipt of Kaspersky Anti Targeted Attack Platform events in the KUMA
.Before configuring event receipt, make sure to create a KUMA collector for the KATA/EDR events.
When creating a collector in the KUMA Console, make sure that the port number matches the port specified in step 4c of Configuring export of Kaspersky Anti Targeted Attack Platform events to KUMA, and that the connector type corresponds to the type specified in step 4d.
To receive Kaspersky Anti Targeted Attack Platform events using Syslog, in the collector Installation wizard, at the Event parsing step, select the [OOTB] KATA normalizer.
Configuring the receipt of KATA/EDR events proceeds in stages:
- Configuring the forwarding of KATA/EDR events
- Installing the KUMA collector in the network infrastructure
- Verifying receipt of KATA/EDR events in the KUMA collector
You can verify that the KATA/EDR event source server is configured correctly by searching for related events in the KUMA Console. Kaspersky Anti Targeted Attack Platform events are displayed as KATA in the table with search results.
Configuring export of KATA/EDR events to KUMA
To configure export of events from Kaspersky Anti Targeted Attack Platform to KUMA:
- In a browser on any computer with access to the Central Node server, enter the IP address of the server hosting the Central Node component.
A window for entering Kaspersky Anti Targeted Attack Platform user credentials opens.
- In the user credentials entry window, select the Local administrator check box and enter the Administrator credentials.
- Go to the Settings → SIEM system section.
- Specify the following settings:
- Select the Activity log and Detections check boxes.
- In the Host/IP field, enter the IP address or host name of the KUMA collector.
- In the Port field, specify the port number to connect to the KUMA collector.
- In the Protocol field, select TCP or UDP from the list.
- In the Host ID field, specify the server host ID to be indicated in the SIEM systems log as a detection source.
- In the Alert frequency field, enter the interval for sending messages: from 1 to 59 minutes.
- Enable TLS encryption, if necessary.
- Click Apply.
Export of Kaspersky Anti Targeted Attack Platform events to KUMA is configured.
Page top
Creating KUMA collector for receiving KATA/EDR events
After configuring the event export settings, you must create a collector for Kaspersky Anti Targeted Attack Platform events in the KUMA Console.
For details on creating a KUMA collector, refer to Creating a collector.
When creating a collector in the KUMA Console, make sure that the port number matches the port specified in step 4c of Configuring export of Kaspersky Anti Targeted Attack Platform events to KUMA, and that the connector type corresponds to the type specified in step 4d.
To receive Kaspersky Anti Targeted Attack Platform events using Syslog, in the collector Installation wizard, at the Event parsing step, select the [OOTB] KATA normalizer.
Page top
Installing KUMA collector for receiving KATA/EDR events
After creating a collector, to configure receiving Kaspersky Anti Targeted Attack Platform events, install a new collector on the network infrastructure server intended for receiving events.
For details on installing the KUMA collector, refer to the Installing collector in the network infrastructure section.
Page top
Configuring Open Single Management Platform for export of events to the KUMA SIEM-system
KUMA allows you to receive and export events from Open Single Management Platform Administration Server to the KUMA SIEM system.
Configuring the export and receipt of Open Single Management Platform events proceeds in stages:
- Configuring the export of Open Single Management Platform events.
- Configuring the KUMA Collector.
- Installing the KUMA collector in the network infrastructure.
- Verifying receipt of Open Single Management Platform events in the KUMA collector
You can verify if the events from Open Single Management Platform Administration Server were correctly exported to the KUMA SIEM system by using the KUMA Console to search for related events.
To display Open Single Management Platform events in CEF format in the table, enter the following search expression:
SELECT * FROM `events` WHERE DeviceProduct = 'KSC' ORDER BY Timestamp DESC LIMIT 250
Configuring KUMA collector for collecting Open Single Management Platform events
After configuring the export of events in the CEF format from Open Single Management Platform Administration Server, configure the collector in the KUMA Console.
To configure the KUMA Collector for Open Single Management Platform events:
- In the KUMA Console, select Resources → Collectors.
- In the list of collectors, find the collector with the [OOTB] KSC normalizer and open it for editing.
- At the Transport step, in the URL field, specify the port to be used by the collector to receive Open Single Management Platform events.
The port must match the port of the KUMA SIEM system server.
- At the Event parsing step, make sure that the [OOTB] KSC normalizer is selected.
- At the Routing step, make sure that the following destinations are added to the collector resource set:
- Storage. To send processed events to the storage.
- Correlator. To send processed events to the correlator.
If the Storage and Correlator destinations were not added, create them.
- At the Setup validation tab, click Create and save service.
- Copy the command for installing the KUMA collector that appears.
Installing KUMA collector for collecting Open Single Management Platform events
After configuring the collector for collecting Open Single Management Platform events in the CEF format, install the KUMA collector on the network infrastructure server intended for receiving events.
For details on installing the KUMA collector, refer to the Installing collector in the network infrastructure section.
Page top
Configuring receiving Open Single Management Platform event from MS SQL
KUMA allows you to receive information about Open Single Management Platform events from an MS SQL database.
Before configuring, make sure that you have created the KUMA collector for Open Single Management Platform events from MS SQL.
When creating the collector in the KUMA Console, at the Transport step, select the [OOTB] KSC SQL connector.
To receive Open Single Management Platform events from the MS SQL database, at the Event parsing step, select the [OOTB] KSC from SQL normalizer.
Configuring event receiving consists of the following steps:
- Creating an account in the MS SQL.
- Configuring the SQL Server Browser service.
- Creating a secret.
- Configuring a connector.
- Installation of collector in the network infrastructure.
- Verifying receipt of events from MS SQL in the KUMA collector.
You can verify that the receipt of events from MS SQL is configured correctly by searching for related events in the KUMA Console.
Creating an account in the MS SQL database
To receive Open Single Management Platform events from MS SQL, a user account is required that has the rights necessary to connect and work with the database.
To create an account for working with MS SQL:
- Log in to the server with MS SQL for Open Single Management Platform installed.
- Using SQL Server Management Studio, connect to MS SQL using an account with administrator rights.
- In the Object Explorer pane, expand the Security section.
- Right-click the Logins folder and select New Login from the context menu.
The Login - New window opens.
- On the General tab, click the Search button next to the Login name field.
The Select User or Group window opens.
- In the Enter the object name to select (examples) field, specify the object name and click OK.
The Select User or Group window closes.
- In the Login - New window, on the General tab, select the Windows authentication option.
- In the Default database field, select the Open Single Management Platform database.
The default Open Single Management Platform database name is KAV.
- On the User Mapping tab, configure the account permissions:
- In the Users mapped to this login section, select the Open Single Management Platform database.
- In the Database role membership for section, select the check boxes next to the db_datareader and public permissions.
- On the Status tab, configure the permissions for connecting the account to the database:
- In the Permission to connect to database engine section, select Grant.
- In the Login section, select Enabled.
- Click OK.
The Login - New window closes.
To check the account permissions:
- Run SQL Server Management Studio using the created account.
- Go to any MS SQL database table and make a selection based on the table.
Configuring the SQL Server Browser service
After creating an account in MS SQL, you must configure the SQL Server Browser service.
To configure the SQL Server Browser service:
- Open SQL Server Configuration Manager.
- In the left pane, select SQL Server Services.
A list of services opens.
- Open the SQL Server Browser service properties in one of the following ways:
- Double-click the name of the SQL Server Browser service.
- Right-click the name of the SQL Server Browser service and select Properties from the context menu.
- In the SQL Server Browser Properties window that opens, select the Service tab.
- In the Start Mode field, select Automatic.
- Select the Log On tab and click the Start button.
Automatic startup of the SQL Server Browser service is enabled.
- Enable and configure the TCP/IP protocol by doing the following:
- In the left pane, expand the SQL Server Network Configuration section and select the Protocols for <SQL Server name> subsection.
- Right-click the TCP/IP protocol and select Enable from the context menu.
- In the Warning window that opens, click OK.
- Open the TCP/IP protocol properties in one of the following ways:
- Double-click the TCP/IP protocol.
- Right-click the TCP/IP protocol and select Properties from the context menu.
- Select the IP Addresses tab, and then in the IPALL section, specify port 1433 in the TCP Port field.
- Click Apply to save the changes.
- Click OK to close the window.
- Restart the SQL Server (<SQL Server name>) service by doing the following:
- In the left pane, select SQL Server Services.
- In the service list on the right, right-click the SQL Server (<SQL Server name>) service and select Restart from the context menu.
- In Windows Defender Firewall with Advanced Security, allow inbound connections on the server on the TCP port 1433.
Creating a secret in KUMA
After creating and configuring an account in MS SQL, you must add a secret in the KUMA Console. This resource is used to store credentials for connecting to MS SQL.
To create a KUMA secret:
- In the KUMA Console, open Resources → Secrets.
The list of available secrets will be displayed.
- Click the Add secret button to create a new secret.
The secret window is displayed.
- Enter information about the secret:
- In the Name field, choose a name for the added secret.
- In the Tenant drop-down list, select the tenant that will own the created resource.
- In the Type drop-down list, select urls.
- In the URL field, specify a string of the following form:
sqlserver://[<domain>%5C]<username>:<password>@<server>:1433/<database_name>where:
domainis a domain name.%5Cis the domain/user separator. Represents the "\" character in URL format.usernameis the name of the created MS SQL account.passwordis the password of the created MS SQL account.serveris the name or IP address of the server where the MS SQL database for Open Single Management Platform is installed.database_nameis the name of the Open Single Management Platform database. The default name is KAV.
Example:
sqlserver://test.local%5Cuser:password123@10.0.0.1:1433/KAVIf the MS SQL database account password contains special characters (@ # $ % & * ! + = [ ] : ' , ? / \ ` ( ) ;), convert them to URL format.
- Click Save.
For security reasons, the string specified in the URL field is hidden after the secret is saved.
Configuring a connector
To connect KUMA to an MS SQL database, you must configure the connector.
To configure a connector:
- In the KUMA Console, select Resources → Connectors.
- In the list of connectors, find the [OOTB] KSC SQL connector and open it for editing.
If a connector is not available for editing, copy it and open the connector copy for editing.
If the [OOTB] KSC SQL connector is not available, contact your system administrator.
- On the Basic settings tab, in the URL drop-down lists, select the secret created for connecting to the MS SQL database.
- Click Save.
Configuring the KUMA Collector for receiving Open Single Management Platform events from an MS SQL database
After configuring the event export settings, you must create a collector in the KUMA Console for Open Single Management Platform events received from MS SQL.
For details on creating a KUMA collector, refer to Creating a collector.
When creating the collector in the KUMA Console, at the Transport step, select the [OOTB] KSC SQL connector.
To receive Open Single Management Platform events from MS SQL, at the Event parsing step, select the [OOTB] KSC from SQL normalizer.
Page top
Installing the KUMA Collector for receiving Open Single Management Platform events from the MS SQL database
After configuring the collector for receiving Open Single Management Platform events from MS SQL, install the KUMA collector on the network infrastructure server where you intend to receive events.
For details on installing the KUMA collector, refer to the Installing collector in the network infrastructure section.
Page top
Configuring receipt of events from Windows devices using KUMA Agent (WEC)
KUMA allows you to receive information about events from Windows devices using the WEC KUMA Agent.
Configuring event receiving consists of the following steps:
- Configuring policies for receiving events from Windows devices.
- Configuring centralized receipt of events using the Windows Event Collector service.
- Granting permissions to view events.
- Granting permissions to log on as a service.
- Configuring the KUMA Collector.
- Installing KUMA collector.
- Forwarding events from Windows devices to KUMA.
Configuring audit of events from Windows devices
You can configure event audit on Windows devices for an individual device or for all devices in a domain.
This section describes how to configure an audit on an individual device and how to use a domain group policy to configure an audit.
Configuring an audit policy on a Windows device
To configure audit policies on a device:
- Open the Run window by pressing the key combination Win+R.
- In the opened window, type
secpol.mscand click OK.The Local security policy window opens.
- Select Security Settings → Local policies → Audit policy.
- In the pane on the right, double-click to open the properties of the policy for which you want to enable an audit of successful and unsuccessful attempts.
- In the <Policy name> properties window, on the Local security setting tab, select the Success and Failure check boxes to track successful and interrupted attempts.
It is recommended to enable an audit of successful and unsuccessful attempts for the following policies:
- Audit Logon
- Audit Policy Change
- Audit System Events
- Audit Logon Events
- Audit Account Management
Configuration of an audit policy on the device is complete.
Page top
Configuring an audit using a group policy
In addition to configuring an audit policy on an individual device, you can also configure an audit by using a domain group policy.
To configure an audit using a group policy:
- Open the Run window by pressing the key combination Win+R.
- In the opened window, type
gpedit.mscand click OK.The Local Group Policy Editor window opens.
- Select Computer configuration → Windows configuration → Security settings → Local policies → Audit policy.
- In the pane on the right, double-click to open the properties of the policy for which you want to enable an audit of successful and unsuccessful attempts.
- In the <Policy name> properties window, on the Local security setting tab, select the Success and Failure check boxes to track successful and interrupted attempts.
It is recommended to enable an audit of successful and unsuccessful attempts for the following policies:
- Audit Logon
- Audit Policy Change
- Audit System Events
- Audit Logon Events
- Audit Account Management
If you want to receive Windows logs from a large number of servers or if installation of KUMA agents on domain controllers is not allowed, it is recommended to configure Windows log redirection to individual servers that have the Windows Event Collector service configured.
The audit policy is now configured on the server or workstation.
Page top
Configuring centralized receipt of events from Windows devices using the Windows Event Collector service
The Windows Event Collector service allows you to centrally receive data about events on servers and workstations running Windows. You can use the Windows Event Collector service to subscribe to events that are registered on remote devices.
You can configure the following types of event subscriptions:
- Source-initiated subscriptions. Remote devices send event data to the Windows Event Collector server whose address is specified in the group policy. For details on the subscription configuration procedure, please refer to the Configuring data transfer from the event source server section.
- Collector-initiated subscriptions. The Windows Event Collector server connects to remote devices and independently gathers events from local logs. For details on the subscription configuration procedure, please refer to the Configuring the Windows Event Collector service section.
Configuring data transfer from the event source server
You can receive information about events on servers and workstations by configuring data transfer from remote devices to the Windows Event Collector server.
Preliminary steps
- Verify that the Windows Remote Management service is configured on the event source server by running the following command in the PowerShell console:
winrm get winrm/configIf the Windows Remote Management service is not configured, initialize it by running the following command:
winrm quickconfig - If the event source server is a domain controller, make the Windows logs available over the network by running the following command in PowerShell as an administrator:
wevtutil set-log security /ca:’O:BAG:SYD:(A;;0xf0005;;;SY)(A;;0x5;;;BA)(A;;0x1;;;S-1-5-32-573)(A;;0x1;;;S-1-5-20)Verify access by running the following command:
wevtutil get-log security
Configuring the firewall on the event source server
To enable the Windows Event Collector server to receive Windows log entries, inbound connection ports must be opened on the event source server.
To open ports for inbound connections:
- On the event source server, open the Run window by pressing the key combination Win+R.
- In the opened window, type
wf.mscand click OK.The Windows Defender Firewall with Advanced Security window opens.
- Go to the Inbound Rules section and click New Rule in the Actions pane.
The New Inbound Rule Wizard opens.
- At the Rule type step, select Port.
- At the Protocols and ports step, select TCP as the protocol. In the Specific local ports field, indicate the relevant port numbers:
5985(for HTTP access)5986(for HTTPS access)
You can indicate one of the ports, or both.
- At the Action step, select Allow connection (selected by default).
- At the Profile step, clear the Private and Public check boxes.
- At the Name step, specify a name for the new inbound connection rule and click Done.
Configuration of data transfer from the event source server is complete.
The Windows Event Collector server must have the permissions to read Windows logs on the event source server. These permissions can be assigned to both the Windows Event Collector server account and to a special user account. For details on granting permissions, please refer to the Granting user permissions to view the Windows Event Log.
Page top
Configuring the Windows Event Collector service
The Windows Event Collector server can independently connect to devices and gather data on events of any severity.
To configure the receipt of event data by the Windows Event Collector server:
- On the event source server, open the Run window by pressing Win+R.
- In the opened window, type
services.mscand click OK.The Services window opens.
- In the list of services, find and start the Windows Event Collector service.
- Open the Event Viewer snap-in by doing the following:
- Open the Run window by pressing the key combination Win+R.
- In the opened window, type
eventvwrand click OK.
- Go to the Subscriptions section and click Create Subscription in the Actions pane.
- In the opened Subscription Properties window, specify the name and description of the subscription, and define the following settings:
- In the Destination log field, select Forwarded events from the list.
- In the Subscription type and source computers section, click the Select computers button.
- In the opened Computers window, click the Add domain computer button.
The Select computer window opens.
- In the Enter the object names to select (examples) field, list the names of the devices from which you want to receive event information. Click OK.
- In the Computers window, check the list of devices from which the Windows Event Collector server will gather event data and click OK.
- In the Subscription properties window, in the Collected events field, click the Select events button.
- In the opened Request filter window, specify how often and which data about events on devices you want to receive.
- If necessary, in the <All event codes> field, list the codes of the events whose information you want to receive or do not want to receive. Click OK.
- If you want to use a special account to view event data, do the following:
- In the Subscription properties window, click the Advanced button.
- In the opened Advanced subscription settings window, in the user account settings, select Specific user.
- Click the User and password button and enter the account credentials of the selected user.
Configuration of the Event Collector Service is complete.
To verify that the configuration is correct and event data is being received by the Windows Event Collector server:
In the Event Viewer snap-in, go to Event Viewer (Local) → Windows logs → Forwarded events.
Page top
Granting permissions to view Windows events
You can grant permissions to view Windows events for a specific device or for all devices in a domain.
To grant permissions to view events on a specific device:
- Open the Run window by pressing the key combination Win+R.
- In the opened window, type
compmgmt.mscand click OK.The Computer Management window opens.
- Go to Computer Management (local) → Local users and groups → Groups.
- In the pane on the right, select the Event Log Readers group and double-click to open the policy properties.
- Click the Add button at the bottom of the Properties: Event Log Readers window.
The Select Users, Computers or Groups window opens.
- In the Enter the object names to select (examples) field, list the names of the users or devices to which you want to grant permissions to view event data. Click OK.
To grant permissions to view events for all devices in a domain:
- Log in to the domain controller with administrator privileges.
- Open the Run window by pressing the key combination Win+R.
- In the opened window, type
dsa.mscand click OK.The Active Directory Users and Computers window opens.
- Go to Active Directory Users and Computers → <Domain name> → Builtin.
- In the pane on the right, select the Event Log Readers group and double-click to open the policy properties.
In the Properties: Event Log Readers window, open the Members tab and click the Add button.
The Select Users, Computers or Groups window opens.
- In the Enter the object names to select (examples) field, list the names of the users or devices to which you want to grant permissions to view event data. Click OK.
Granting permissions to log on as a service
You can grant permission to log on as a service to a specific device or to all devices in a domain. The "Log on as a service" permission allows you to start a process using an account that has been granted this permission.
To grant the "Log on as a service" permission to a device:
- Open the Run window by pressing the key combination Win+R.
- In the opened window, type
secpol.mscand click OK.The Local security policy window opens.
- Go to Security settings → Local policies → User rights assignment.
- In the pane on the right, double-click to open the properties of the Log on as a service policy.
- In the opened Properties: Log on as a Service window, click the Add User or Group button.
The Select Users or Groups window opens.
- In the Enter the object names to select (examples) field, list the names of the accounts or devices to which you want to grant the permission to log on as a service. Click OK.
Before granting the permission, make sure that the accounts or devices to which you want to grant the Log on as a service permission are not listed in the properties of the Deny log on as a service policy.
To grant the "Log on as a service" permission to devices in a domain:
- Open the Run window by pressing the key combination Win+R.
- In the opened window, type
gpedit.mscand click OK.The Local Group Policy Editor window opens.
- Select Computer configuration → Windows configuration → Security settings → Local policies → User rights assignment.
- In the pane on the right, double-click to open the properties of the Log on as a service policy.
- In the opened Properties: Log on as a Service window, click the Add User or Group button.
The Select Users or Groups window opens.
- In the Enter the object names to select (examples) field, list the names of the users or devices to which you want to grant the permission to log on as a service. Click OK.
Before granting the permission, make sure that the accounts or devices to which you want to grant the Log on as a service permission are not listed in the properties of the Deny log on as a service policy.
Page top
Configuring the KUMA Collector for receiving events from Windows devices
After you finish configuring the audit policy on devices, creating subscriptions to events and granting all the necessary permissions, you need to create a collector in the KUMA Console for events from Windows devices.
For details on creating a KUMA collector, refer to Creating a collector.
To receive events from Windows devices, define the following collector settings in the KUMA Collector Installation Wizard:
- At the Transport step, define the following settings:
- In the Connector window, select Create.
- In the Type field, select http.
- In the Delimiter field, select \0.
- On the Advanced settings tab, in the TLS mode field, select With verification.
- At the Event parsing step, click the Add event parsing button.
- This opens the Basic event parsing window; in that window, in the Normalizer field, select [OOTB] Microsoft Products and click OK.
- At the Routing step, add the following destinations:
- Storage. To send processed events to the storage.
- Correlator. To send processed events to the correlator.
If the Storage and Correlator destinations were not added, create them.
- At the Setup validation tab, click Create and save service.
- Copy the command for installing the KUMA collector that appears.
Installing the KUMA Collector for receiving events from Windows devices
After configuring the collector for receiving Windows events, install the KUMA Collector on the server of the network infrastructure intended for receiving events.
For details on installing the KUMA collector, refer to the Installing collector in the network infrastructure section.
Page top
Configuring forwarding of events from Windows devices to KUMA using KUMA Agent (WEC)
To complete the data forwarding configuration, you must create a WEC KUMA agent and then install it on the device from which you want to receive event information.
For more details on creating and installing a WEC KUMA Agent on Windows devices, please refer to the Forwarding events from Windows devices to KUMA section.
Page top
Configuring receipt of events from Windows devices using KUMA Agent (WMI)
KUMA allows you to receive information about events from Windows devices using the WMI KUMA Agent.
Configuring event receiving consists of the following steps:
- Configuring audit settings for managing KUMA.
- Configuring data transfer from the event source server.
- Granting permissions to view events.
- Granting permissions to log on as a service.
- Creating a KUMA collector.
To receive Windows device events, in the KUMA Collector Setup Wizard, at the Event parsing step, in the Normalizer field, select [OOTB] Microsoft Products.
- Installing KUMA collector.
- Forwarding events from Windows devices to KUMA.
To complete the data forwarding configuration, you must create a WMI KUMA agent and then install it on the device from which you want to receive event information.
Configuring audit settings for managing KUMA
You can configure event audit on Windows devices both on a specific device using a local policy or on all devices in a domain using a group policy.
This section describes how to configure an audit on an individual device and how to use a domain group policy to configure an audit.
Configuring an audit using a local policy
To configure an audit using a local policy:
- Open the Run window by pressing the key combination Win+R.
- In the opened window, type
secpol.mscand click OK.The Local security policy window opens.
- Select Security Settings → Local policies → Audit policy.
- In the pane on the right, double-click to open the properties of the policy for which you want to enable an audit of successful and unsuccessful attempts.
- In the <Policy name> properties window, on the Local security setting tab, select the Success and Failure check boxes to track successful and interrupted attempts.
It is recommended to enable an audit of successful and unsuccessful attempts for the following policies:
- Audit Logon
- Audit Policy Change
- Audit System Events
- Audit Logon Events
- Audit Account Management
Configuration of an audit policy on the device is complete.
Page top
Configuring an audit using a group policy
In addition to configuring an audit on an individual device, you can also configure an audit by using a domain group policy.
To configure an audit using a group policy:
- Open the Run window by pressing the key combination Win+R.
- In the opened window, type
gpedit.mscand click OK.The Local Group Policy Editor window opens.
- Select Computer configuration → Windows configuration → Security settings → Local policies → Audit policy.
- In the pane on the right, double-click to open the properties of the policy for which you want to enable an audit of successful and unsuccessful attempts.
- In the <Policy name> properties window, on the Local security setting tab, select the Success and Failure check boxes to track successful and interrupted attempts.
It is recommended to enable an audit of successful and unsuccessful attempts for the following policies:
- Audit Logon
- Audit Policy Change
- Audit System Events
- Audit Logon Events
- Audit Account Management
The audit policy is now configured on the server or workstation.
Page top
Configuring data transfer from the event source server
Preliminary steps
- On the event source server, open the Run window by pressing the key combination Win+R.
- In the opened window, type
services.mscand click OK.The Services window opens.
- In the list of services, find the following services:
- Remote Procedure Call
- RPC Endpoint Mapper
- Check the Status column to confirm that these services have the Running status.
Configuring the firewall on the event source server
The Windows Management Instrumentation server can receive Windows log entries if ports are open for inbound connections on the event source server.
To open ports for inbound connections:
- On the event source server, open the Run window by pressing the key combination Win+R.
- In the opened window, type
wf.mscand click OK.The Windows Defender Firewall with Advanced Security window opens.
- In the Windows Defender Firewall with Advanced Security window, go to the Inbound Rules section and in the Actions pane, click New Rule.
This opens the New Inbound Rule Wizard.
- In the New Inbound Rule Wizard, at the Rule Type step, select Port.
- At the Protocols and ports step, select TCP as the protocol. In the Specific local ports field, indicate the relevant port numbers:
13544549152–65535
- At the Action step, select Allow connection (selected by default).
- At the Profile step, clear the Private and Public check boxes.
- At the Name step, specify a name for the new inbound connection rule and click Done.
Configuration of data transfer from the event source server is complete.
Page top
Granting permissions to view Windows events
You can grant permissions to view Windows events for a specific device or for all devices in a domain.
To grant permissions to view events on a specific device:
- Open the Run window by pressing the key combination Win+R.
- In the opened window, type
compmgmt.mscand click OK.The Computer Management window opens.
- Go to Computer Management (local) → Local users and groups → Groups.
- In the pane on the right, select the Event Log Readers group and double-click to open the policy properties.
- Click the Add button at the bottom of the Properties: Event Log Readers window.
The Select Users, Computers or Groups window opens.
- In the Enter the object names to select (examples) field, list the names of the users or devices to which you want to grant permissions to view event data. Click OK.
To grant permissions to view events for all devices in a domain:
- Log in to the domain controller with administrator privileges.
- Open the Run window by pressing the key combination Win+R.
- In the opened window, type
dsa.mscand click OK.The Active Directory Users and Computers window opens.
- In the Active Directory Users and Computers window, go to the Active Directory Users and Computers section → <Domain name> → Builtin.
- In the pane on the right, select the Event Log Readers group and double-click to open the policy properties.
In the Properties: Event Log Readers window, open the Members tab and click the Add button.
The Select Users, Computers or Groups window opens.
- In the Select User, Computer, or Group window, In the Enter the object name to select (examples) field, list the names of the users or devices to which you want to grant permissions to view event data. Click OK.
Granting permissions to log on as a service
You can grant permission to log on as a service to a specific device or to all devices in a domain. The "Log on as a service" permission allows you to start a process using an account that has been granted this permission.
Before granting the permission, make sure that the accounts or devices to which you want to grant the Log on as a service permission are not listed in the properties of the Deny log on as a service policy.
To grant the "Log on as a service" permission to a device:
- Open the Run window by pressing the key combination Win+R.
- In the opened window, type
secpol.mscand click OK.The Local security policy window opens.
- In the Local Security Policy window, go to the Security Settings → Local Policies → User Rights Assignment section.
- In the pane on the right, double-click to open the properties of the Log on as a service policy.
- This opens the Properties: Log on as a Service window; in that window, click Add User or Group.
This opens the Select Users or Groups window.
- In the Enter the object names to select (examples) field, list the names of the accounts or devices to which you want to grant the permission to log on as a service. Click OK.
To grant the "Log on as a service" permission to devices in a domain:
- Open the Run window by pressing the key combination Win+R.
- In the opened window, type
gpedit.mscand click OK.The Local Group Policy Editor window opens.
- Select Computer configuration → Windows configuration → Security settings → Local policies → User rights assignment.
- In the pane on the right, double-click to open the properties of the Log on as a service policy.
- This opens the Properties: Log on as a Service window; in that window, click Add User or Group.
This opens the Select Users or Groups window.
- In the Enter the object names to select (examples) field, list the names of the users or devices to which you want to grant the permission to log on as a service. Click OK.
Configuring receipt of DNS server events using the ETW agent
The Event Tracing for Windows connector (hereinafter also referred to as the ETW connector) is a mechanism for logging events generated by applications and drivers on the DNS server. You can use the ETW connector to troubleshoot errors during development or to look for malicious activity.
The impact of the ETW connector on DNS server performance is insignificant. For example, a DNS server running on modern hardware and getting up to 100,000 queries per second (QPS) may experience a 5% performance drop while using the ETW connector. If the DNS server gets up to 50,000 requests per second, no performance drop is observed. We recommend monitoring DNS server performance when using the ETW connector, regardless of the number of requests per second.
By default, you can use the ETW connector on Windows Server 2016 or later. The ETW connector is also supported by Windows Server 2012 R2 if the update for event logging and change auditing is installed. The update is available on the Microsoft Support website.
The ETW connector consists of the following components:
- Providers are elements of the system that generate events and send them to the ETW connector. For example, Windows kernels or device drivers can act as providers. When working with code, developers must specify which events the providers must send to the ETW connector. An event may represent the execution of a function that the developer considers important, for example, a function that allows access to the Security Account Manager (SAM).
- Consumers are software systems that receive events generated by providers from the ETW connector, and use these events in some way. For example, KUMA can act as a consumer.
- Controllers are pieces of software that manage the interaction between providers and consumers. For example, the Logman or Wevtutil utilities can be controllers. Providers register with the controller to send events to consumers. The controller can enable or disable a provider. If a provider is disabled, it does not generate events.
Controllers use trace sessions for communication between providers and consumers. Trace sessions are also used for filtering data based on specified parameters because consumers may need different events.
Configuring DNS server event reception using the ETW connector proceeds in stages:
- Configuration on the Windows side.
- Creating a KUMA collector.
When creating a KUMA collector, follow these steps:
- At step 2 of the Collector Installation Wizard:
- In the Type drop-down list, select the tcp connector type. You can also specify the http connector type and other connector types with verification for secure transmission.
- In the URL field, enter the FQDN and port number on which the KUMA collector will listen for a connection from the KUMA agent. You can specify any unoccupied port number.
- In the Delimiter field, enter
\n.
- At step 3 of the Collector Installation Wizard, in the Normalizer drop-down list, select a normalizer. We recommend selecting the predefined extended normalizer for Windows events, [OOTB] Microsoft DNS ETW logs json.
- At step 7 of the Collector Installation Wizard, add a Storage type destination for storing events. If you plan to use event correlation, you also need to add a Correlator type destination.
- At step 8 of the Collector Installation Wizard, click Create and save service, and in the lower part of the window, copy the command for installing the KUMA collector on the server.
- At step 2 of the Collector Installation Wizard:
- Installing the KUMA collector on the server.
Do the following:
- Connect to the KUMA command line interface using a user account with root privileges.
- Install the KUMA collector by running the command that you copied at step 8 of the Collector Installation Wizard.
- If you want to add the KUMA collector port to the firewall exclusions and update the firewall settings, run the following commands:
firewall-cmd --add-port=<collector port number>/tcp --permanentfirewall-cmd --reload
The KUMA collector is installed and the status of the KUMA collector service changes to green in the KUMA Console.
- Creating a KUMA agent.
When creating a KUMA agent, follow these steps:
- Go to the Connection 1 tab.
- Under Connector, in the Connector drop-down list, select Create and specify the following settings:
- In the Type drop-down list, select the etw connector type.
- In the Session name field, enter the provider name that you specified when you configured the reception of DNS server events using the ETW connector on the Windows side.
- Under Destinations, in the Destination drop-down list, select Create and specify the following settings:
- In the Type drop-down list, select the tcp destination type.
- In the URL field, enter the FQDN and port number on which the KUMA collector will listen for a connection from the KUMA agent. The value must match the value that you specified at step 2 of the Collector Installation Wizard.
- Go to the Advanced settings tab, and in the Disk buffer size limit field, enter
1073741824.
- Creating a KUMA agent service.
You need to copy the ID of the created KUMA agent service. To do so, right-click next to the KUMA agent service and select Copy ID in the context menu.
- Creating an account for the KUMA agent.
Create a domain or local Windows user account for running the KUMA agent and reading the analytic log. You need to add the created user account to the Performance Log Users group and grant the Log on service permission to that user account.
- Installing a KUMA agent on a Windows server.
You need to install the KUMA agent on the Windows server that will be receiving events from the provider. To do so:
- Add the FQDN of the KUMA Core server to the hosts file on the Windows server or to the DNS server.
- Create the C:\Users\<
user name>\Desktop\KUMA folder on the Windows server. - Copy the kuma.exe file from the KUMA installation package archive to the C:\Users\<
user name>\Desktop\KUMA folder.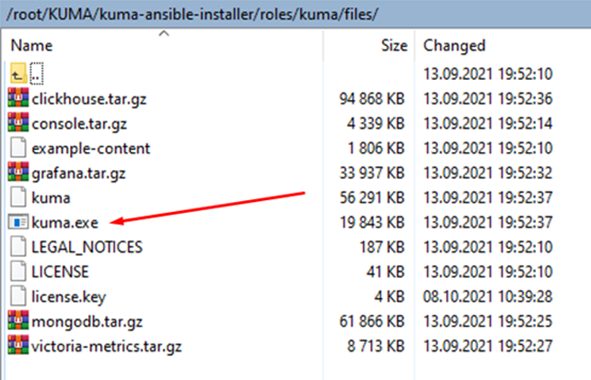
- Run the command interpreter as administrator.
- Change to the C:\Users\<user name>\Desktop\KUMA folder and run the following command:
C:\Users\<user name>\Desktop\KUMA>kuma.exe agent --core https://<DOMAIN-NAME-KUMA-CORE-Server>:7210 --id <KUMA agent service ID>In the KUMA Console, in the Resources → Active services section, make sure that the KUMA agent service is running and its status is now green, and then abort the command.
- Start the KUMA Agent installation in one of the following ways:
- If you want to start the KUMA agent installation using a domain user account, run the following command:
C:\Users\<user name>\Desktop\KUMA>kuma.exe agent --core https://<DOMAIN-NAME-KUMA-CORE-Server>:7210 --id <KUMA agent service ID> –-user <domain>\<user account name for the KUMA agent> --install - If you want to start the agent installation using a local user account, run the following command:
C:\Users\<user name>\Desktop\KUMA>kuma.exe agent --core https://<DOMAIN-NAME-KUMA-CORE-Server>:7210 --id <KUMA agent service ID> –-user <user account name for the KUMA agent> --install
You will need to enter the password of the KUMA agent user account.
- If you want to start the KUMA agent installation using a domain user account, run the following command:
The KUMA Windows Agent service <KUMA agent service ID> is installed on the Windows server. In the KUMA Console, in the Resources → Active services section, if the KUMA agent service is not running and has the red status, you need to make sure that port 7210 is available, as well as the Windows collector port in the direction from the KUMA agent to the KUMA collector.
To remove the KUMA agent service on the Windows server, run the following command:
C:\Users\<user name>\Desktop\KUMA>kuma.exe agent --id <KUMA agent service ID> --uninstall - Verifying receipt of DNS server events in the KUMA collector.
You can verify that you have correctly configured the reception of DNS server events using the ETW connector in the Searching for related events section of the KUMA Console.
Configuration on the Windows side
To configure the reception of DNS server events using the ETW connector on the Windows side:
- Start the Event viewer by running the following command:
eventvwr.msc - This opens a window; in that window, go to the Applications and Services Logs → Microsoft → Windows → DNS-Server folder.
- Open the context menu of the DNS-Server folder and select View → Show Analytic and Debug Logs.
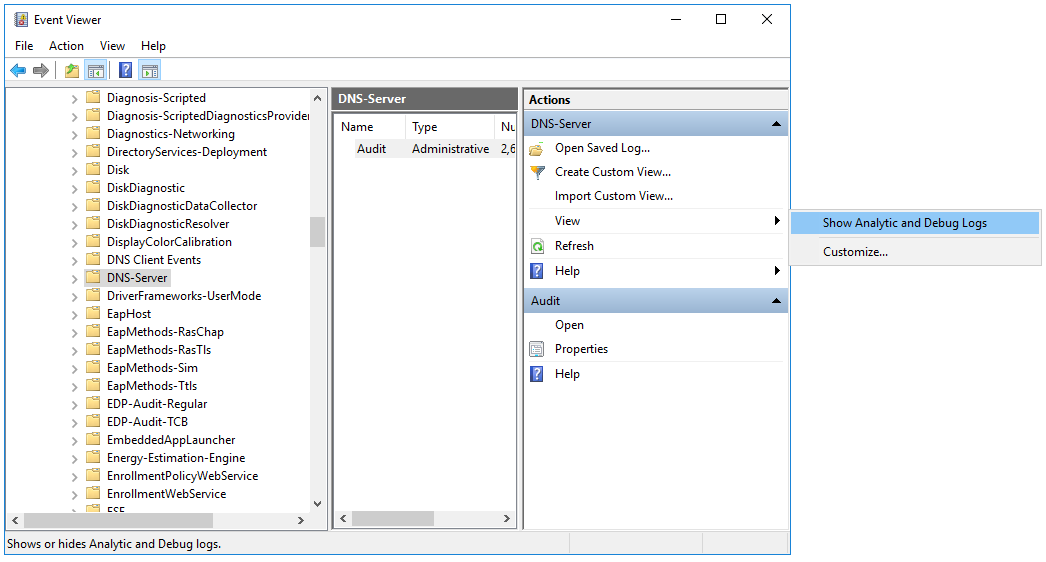
The Audit debug log and Analytical log are displayed.
- Configure the analytic log:
- Open the context menu of the Analytical log and select Properties.
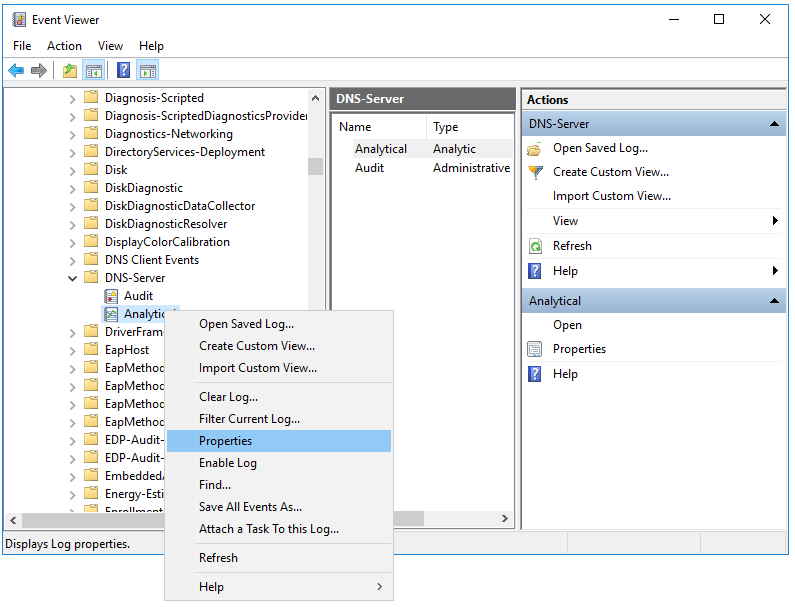
- This opens a window; in that window, make sure that in the Max Log Size (KB) field, the value is
1048576.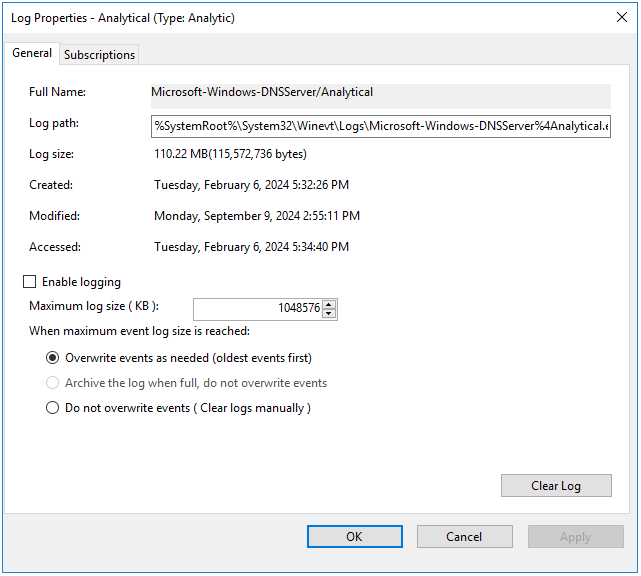
- Select the Enable logging check box and in the confirmation window, click OK.
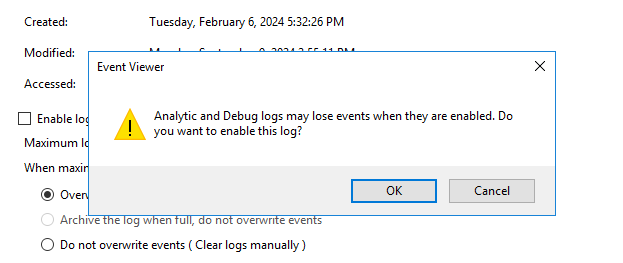
The analytic log must be configured as follows:
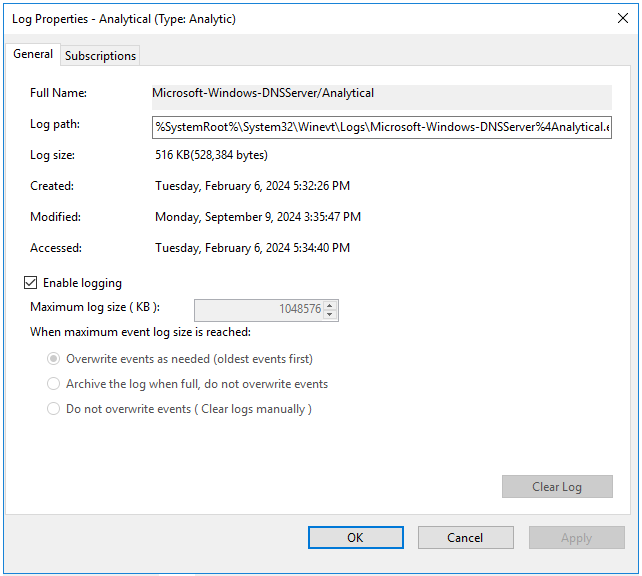
- Click Apply, then click OK.
An error window is displayed.
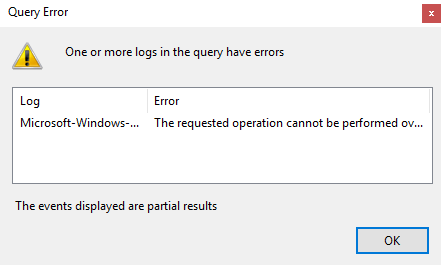
When analytic log rotation is enabled, events are not displayed. To view events, in the Actions pane, click Stop logging.
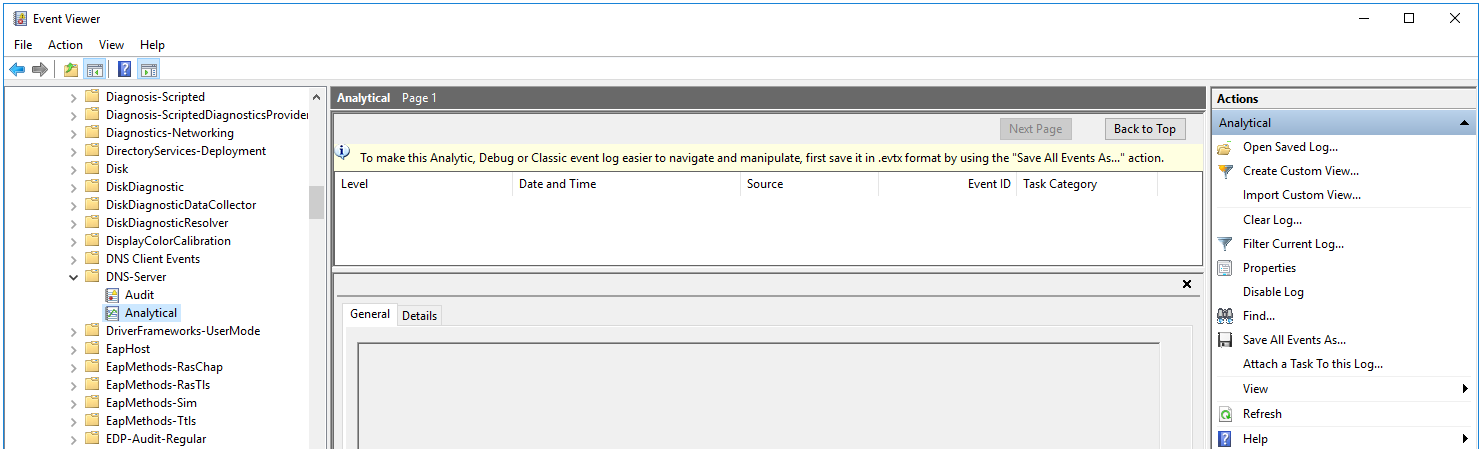
- Open the context menu of the Analytical log and select Properties.
- Start Computer management as administrator.
- This opens a window; in that window, go to the System Tools → Performance → Startup Event Trace Sessions folder.
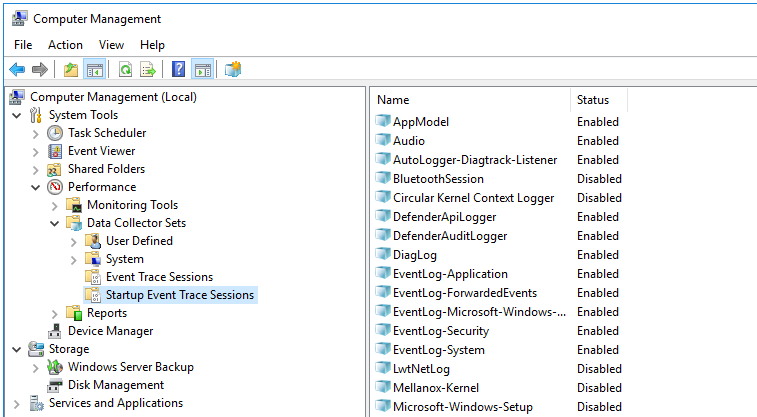
- Create a provider:
- Open the context menu of the Startup Event Trace Sessions folder and select Create → Data Collector Set.
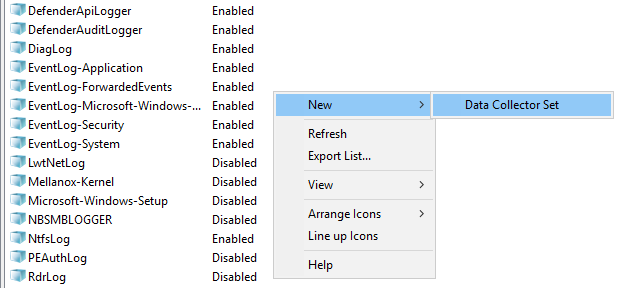
- This opens a window; in that window, enter the name of the provider and click Next.
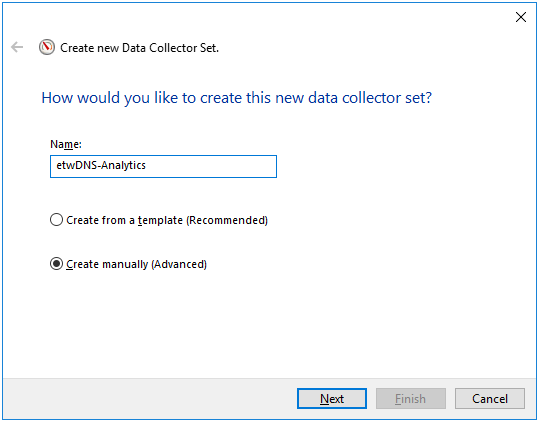
- Click Add... and in the displayed window, select the Microsoft-Windows-DNSServer provider.
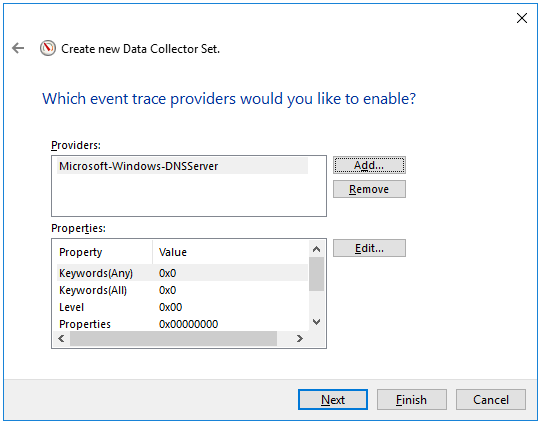
The KUMA agent with the ETW connector works only with System.Provider.Guid: {EB79061A-A566-4698-9119-3ED2807060E7} - Microsoft-Windows-DNSServer.
- Click Next twice, then click Finish.
- Open the context menu of the Startup Event Trace Sessions folder and select Create → Data Collector Set.
- Open the context menu of the created provider and select Start As Event Trace Session.
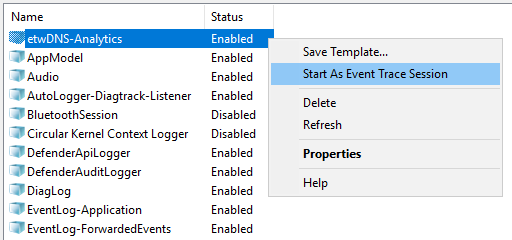
- Go to the Event Trace Sessions folder.
Event trace sessions are displayed.
- Open the context menu of the created event trace session and select Properties.
- This opens a window; in that window, select the Trace Sessions tab and in the Stream Mode drop-down list, select Real Time.
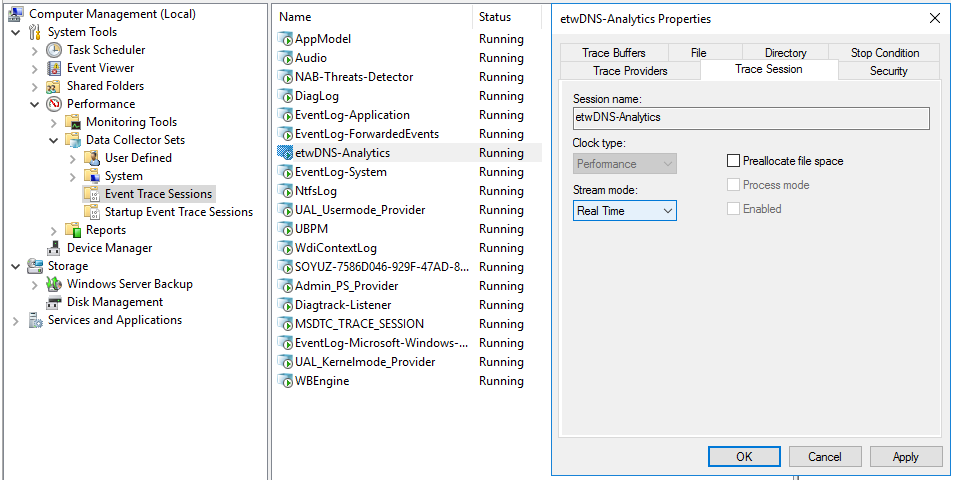
- Click Apply, then click OK.
DNS server event reception using the ETW connector is configured.
Page top
Configuring receipt of PostgreSQL events
KUMA lets you monitor and audit PostgreSQL events on Linux devices using rsyslog.
Events are audited using the pgAudit plugin. The plugin supports PostgreSQL 9.5 and later. For details about the pgAudit plugin, see https://github.com/pgaudit/pgaudit.
Configuring event receiving consists of the following steps:
- Installing the pdAudit plugin.
- Creating a KUMA collector for PostgreSQL events.
To receive PostgreSQL events using rsyslog, in the collector installation wizard, at the Event parsing step, select the [OOTB] PostgreSQL pgAudit syslog normalizer.
- Installing a collector in the KUMA network infrastructure.
- Configuring the event source server.
- Verifying receipt of PostgreSQL events in the KUMA collector
You can verify that the PostgreSQL event source server is correctly configured in the Searching for related events section of the KUMA Console.
Installing the pgAudit plugin
To install the pgAudit plugin:
- On the OS command line, run the following commands as a user with administrator rights:
sudo apt updatesudo apt -y install postgresql-<PostgreSQL version>-pgauditYou must select the plugin version to match the PostgresSQL version. For information about PostgreSQL versions and the matching plugin versions, see https://github.com/pgaudit/pgaudit#postgresql-version-compatibility.
Example:
sudo apt -y install postgresql-12-pgaudit - Find the postgres.conf configuration file. To do so, run the following command on the PostgreSQL command line:
show data_directoryThe response will indicate the location of the configuration file.
- Create a backup copy of the postgres.conf configuration file.
- Open the postgres.conf file and copy or replace the values in it with the values listed below.
```## pgAudit settingsshared_preload_libraries = 'pgaudit'## database logging settingslog_destination = 'syslog'## syslog facilitysyslog_facility = 'LOCAL0'## event identsyslog_ident = 'Postgres'## sequence numbers in syslogsyslog_sequence_numbers = on## split messages in syslogsyslog_split_messages = off## message encodinglc_messages = 'en_US.UTF-8'## min message level for loggingclient_min_messages = log## min error message level for logginglog_min_error_statement = info## log checkpoints (buffers, restarts)log_checkpoints = off## log query durationlog_duration = off## error description levellog_error_verbosity = default## user connections logginglog_connections = on## user disconnections logginglog_disconnections = on## log prefix formatlog_line_prefix = '%m|%a|%d|%p|%r|%i|%u| %e '## log_statementlog_statement = 'none'## hostname logging status. dns bane resolving affect#performance!log_hostname = off## logging collector buffer status#logging_collector = off## pg audit settingspgaudit.log_parameter = onpgaudit.log='ROLE, DDL, MISC, FUNCTION'``` - Restart the PostgreSQL service using the command:
sudo systemctl restart postgresql - To load the pgAudit plugin to PostgreSQL, run the following command on the PostgreSQL command line:
CREATE EXTENSION pgaudit
The pgAudit plugin is installed.
Page top
Configuring a Syslog server to send events
The rsyslog service is used to transmit events from the server to KUMA.
To configure the sending of events from the server where PostgreSQL is installed to the collector:
- To verify that the rsyslog service is installed on the event source server, run the following command as administrator:
sudo systemctl status rsyslog.serviceIf the rsyslog service is not installed on the server, install it by executing the following commands:
yum install rsyslogsudo systemctl enable rsyslog.servicesudo systemctl start rsyslog.service - In the /etc/rsyslog.d/ directory, create a pgsql-to-siem.conf file with the following content:
If $programname contains 'Postgres' then @<IP address of the collector>:<port of the collector>For example:If $programname contains 'Postgres' then @192.168.1.5:1514If you want to send events via TCP, the contents of the file must be as follows:
If $programname contains 'Postgres' then @@<IP address of the collector>:<port of the collector>Save changes to the pgsql-to-siem.conf configuration file.
- Add the following lines to the /etc/rsyslog.conf configuration file:
$IncludeConfig /etc/pgsql-to-siem.conf$RepeatedMsgReduction offSave changes to the /etc/rsyslog.conf configuration file.
- Restart the rsyslog service by executing the following command:
sudo systemctl restart rsyslog.service
Configuring receipt of IVK Kolchuga-K events
You can configure the receipt of events from the IVK Kolchuga-K system to the KUMA SIEM system.
Configuring event receiving consists of the following steps:
- Configuring the sending of IVK Kolchuga-K events to KUMA.
- Creating a KUMA collector for receiving events from the IVK Kolchuga-K system.
To receive IVK Kolchuga-K events using Syslog, in the Collector Installation Wizard, at the Event parsing step, select the [OOTB] Kolchuga-K syslog normalizer.
- Installing a KUMA collector for receiving IVK Kolchuga-K events.
- Verifying receipt of IVK Kolchuga-K events in KUMA.
You can verify that the IVK Kolchuga-K event source is configured correctly in the Searching for related events section of the KUMA Console.
Configuring export of IVK Kolchuga-K events to KUMA
To configure the export of events of the IVK Kolchuga-K firewall via syslog to the KUMA collector:
- Connect to the firewall over SSH with administrator rights.
- Create a backup copy of the /etc/services and /etc/syslog.conf files.
- In the /etc/syslog.conf configuration file, specify the FQDN or IP address of the KUMA collector. For example:
*.* @kuma.example.com
or
*.* @192.168.0.100
Save changes to the configuration file /etc/syslog.conf.
- In the /etc/services configuration file, specify the port and protocol used by the KUMA collector. For example:
syslog 10514/udp
Save changes to the /etc/services configuration file.
- Restart the syslog server of the firewall:
service syslogd restart
Configuring receipt of CryptoPro NGate events
You can configure the receipt of CryptoPro NGate events in the KUMA SIEM system.
Configuring event receiving consists of the following steps:
- Configuring export of CryptoPro NGate events to KUMA.
- Creating a KUMA collector for receiving CryptoPro NGate events.
To receive CryptoPro NGate events using Syslog, in the collector installation wizard, at the Event parsing step, select the [OOTB] NGate syslog normalizer.
- Creating a KUMA collector for receiving CryptoPro NGate events.
- Verifying receipt of CryptoPro NGate events in the KUMA collector.
You can verify that the CryptoPro NGate event source server is correctly configured in the Searching for related events section of the KUMA Console.
Configuring export of CryptoPro NGate events to KUMA
To configure the sending of events from CryptoPro NGate to KUMA:
- Connect to the web interface of the NGate management system.
- Connect remote syslog servers to the management system. To do so:
- Open the page with the list of syslog servers: External Services → Syslog Server → Add Syslog Server.
- Enter the settings of the syslog server and click
 .
.
- Assign syslog servers to the configuration for recording logs of the cluster. To do so:
- In the Clusters → Summary section, select the cluster that you want to configure.
- On the Configurations tab, click the Configuration control for the relevant cluster to go to the configuration settings page.
In the
Syslog Serversfield of the configured configuration, click the
Assignbutton.
Select the check boxes for syslog servers that you want to assign and click
.You can assign an unlimited number of servers.
To add new syslog servers, click
 .
.Publish the configuration to activate the new settings.
Assign syslog servers to the management system for recording Administrator activity logs. To do so:
- Select the Management Center Settings menu item and on the page that is displayed, under Syslog servers, click Assign.
- In the Assign Syslog Servers to Management Center window, select the check box for those syslog servers that you want to assign, then click
 .
.You can assign an unlimited number of servers.
As a result, events of CryptoPro NGate are sent to KUMA.
Page top
Configuring receipt of Ideco UTM events
You can configure the receipt of Ideco UTM application events in KUMA via the Syslog protocol.
Configuring event receiving consists of the following steps:
- Configuring the export of Ideco UTM events to KUMA.
- Creating a KUMA collector for receiving Ideco UTM.
To receive Ideco UTM events, in the Collector Installation Wizard, at the Event parsing step, select the "[OOTB] Ideco UTM syslog" normalizer.
- Creating a KUMA collector for receiving Ideco UTM events.
- Verifying receipt of Ideco UTM events in KUMA.
You can verify that the Ideco UTM event source server is correctly configured in the Searching for related events section of the KUMA Console.
Configuring export of Ideco UTM events to KUMA
To configure the sending of events from Ideco UTM to KUMA:
- Connect to the Ideco UTM web interface under a user account that has administrative privileges.
- In the System message forwarding menu, move the Syslog toggle switch to the enabled position.
- For the IP address setting, specify the IP address of the KUMA collector.
- For the Port setting, enter the port that the KUMA collector is listening on.
- Click Save to apply the changes.
The forwarding of Ideco UTM events to KUMA is configured.
Page top
Configuring receipt of KWTS events
You can configure the receipt of events from the Kaspersky Web Traffic Security (KWTS) web traffic analysis and filtering system in KUMA.
Configuring event receiving consists of the following steps:
- Configuring export of KWTS events to KUMA.
- Creating a KUMA collector for receiving KWTS events.
To receive KWTS events, in the Collector Installation Wizard, at the Event parsing step, select the [OOTB] KWTS normalizer.
- Installing a KUMA collector for receiving KWTS events.
- Verifying receipt of KWTS events in the KUMA collector.
You can verify that KWTS event export is correctly configured in the Searching for related events section of the KUMA Console.
Configuring export of KWTS events to KUMA
To configure the export of KWTS events to KUMA:
- Connect to the KWTS server over SSH as root.
- Before making changes, create backup copies of the following files:
- /opt/kaspersky/kwts/share/templates/core_settings/event_logger.json.template
- /etc/rsyslog.conf
- Make sure that the settings in the /opt/kaspersky/kwts/share/templates/core_settings/event_logger.json.template configuration file have the following values, and make changes if necessary:
"siemSettings":{"enabled": true,"facility": "Local5","logLevel": "Info","formatting":{ - Save your changes.
- To send events via UDP, make the following changes to the /etc/rsyslog.conf configuration file:
$WorkDirectory /var/lib/rsyslog$ActionQueueFileName ForwardToSIEM$ActionQueueMaxDiskSpace 1g$ActionQueueSaveOnShutdown on$ActionQueueType LinkedList$ActionResumeRetryCount -1local5.* @<<IP address of the KUMA collector>:<port of the collector>>If you want to send events over TCP, the last line should be as follows:
local5.* @@<<IP address of the KUMA collector>:<port of the collector>> - Save your changes.
- Restart the rsyslog service with the following command:
sudo systemctl restart rsyslog.service - Go to the KWTS web interface, to the Settings → Syslog tab and enable the Log information about traffic profile option.
- Click Save.
Configuring receipt of KLMS events
You can configure the receipt of events from the Kaspersky Linux Mail Server (KLMS) mail traffic analysis and filtering system to the KUMA SIEM system.
Configuring event receiving consists of the following steps:
- Depending on the version of KLMS you are using, select one of the following options:
- Creating a KUMA collector for receiving KLMS events
To receive KLMS events, in the Collector Installation Wizard, at the Event parsing step, select the [OOTB] KLMS syslog CEF normalizer.
- Installing a KUMA collector for receiving KLMS events.
- Verifying receipt of KLMS events in the KUMA collector
You can verify that the KLMS event source server is correctly configured in the Searching for related events section of the KUMA Console.
Configuring export of KLMS events to KUMA
To configure the export of KLMS events to KUMA:
- Connect to the KLMS server over SSH and go to the Technical Support Mode menu.
- Use the klms-control utility to download the settings to the settings.xml file:
sudo /opt/kaspersky/klms/bin/klms-control --get-settings EventLogger -n -f /tmp/settings.xml - Make sure that the settings in the /tmp/settings.xml file have the following values; make changes if necessary:
<siemSettings><enabled>1</enabled><facility>Local1</facility>...</siemSettings> - Apply settings with the following command:
sudo /opt/kaspersky/klms/bin/klms-control --set-settings EventLogger -n -f /tmp/settings.xml - To send events via UDP, make the following changes to the /etc/rsyslog.conf configuration file:
$WorkDirectory /var/lib/rsyslog$ActionQueueFileName ForwardToSIEM$ActionQueueMaxDiskSpace 1g$ActionQueueSaveOnShutdown on$ActionQueueType LinkedList$ActionResumeRetryCount -1local1.* @<<IP address of the KUMA collector>:<port of the collector>>If you want to send events over TCP, the last line should be as follows:
local1.* @@<<IP address of the KUMA collector>:<port of the collector>> - Save your changes.
- Restart the rsyslog service with the following command:
sudo systemctl restart rsyslog.service
Configuring receipt of KSMG events
You can configure the receipt of events from the Kaspersky Secure Mail Gateway (KSMG) 1.1 mail traffic analysis and filtering system in the KUMA SIEM system.
Configuring event receiving consists of the following steps:
- Configuring export of KSMG events to KUMA
- Creating a KUMA collector for receiving KSMG events
To receive KSMG events, in the Collector Installation Wizard, at the Event parsing step, select the [OOTB] KSMG normalizer.
- Installing a KUMA collector for receiving KSMG events.
- Verifying receipt of KSMG events in the KUMA collector
You can verify that the KSMG event source server is correctly configured in the Searching for related events section of the KUMA Console.
Configuring export of KSMG events to KUMA
To configure the export of KSMG events to KUMA:
- Connect to the KSMG server via SSH using an account with administrator rights.
- Use the ksmg-control utility to download the settings to the settings.xml file:
sudo /opt/kaspersky/ksmg/bin/ksmg-control --get-settings EventLogger -n -f /tmp/settings.xml - Make sure that the settings in the /tmp/settings.xml file have the following values; make changes if necessary:
<siemSettings><enabled>1</enabled><facility>Local1</facility> - Apply settings with the following command:
sudo /opt/kaspersky/ksmg/bin/ksmg-control --set-settings EventLogger -n -f /tmp/settings.xml - To send events via UDP, make the following changes to the /etc/rsyslog.conf configuration file:
$WorkDirectory /var/lib/rsyslog$ActionQueueFileName ForwardToSIEM$ActionQueueMaxDiskSpace 1g$ActionQueueSaveOnShutdown on$ActionQueueType LinkedList$ActionResumeRetryCount -1local1.* @<<IP address of the KUMA collector>:<port of the collector>>If you want to send events over TCP, the last line should be as follows:
local1.* @@<<IP address of the KUMA collector>:<port of the collector>> - Save your changes.
- Restart the rsyslog service with the following command:
sudo systemctl restart rsyslog.service
Configuring the receipt of KICS for Networks events
You can configure the receipt of events from Kaspersky Industrial CyberSecurity for Networks (KICS for Networks) 4.2 in KUMA.
Configuring event receiving consists of the following steps:
- Creating a KICS for Networks connector for sending events to KUMA.
- Configuring export of KICS for Networks events to KUMA.
- Creating and installing a KUMA collector to receive KICS for Networks events.
- Verifying receipt of KICS for Networks events in the KUMA collector.
You can verify that KICS for Networks event export is correctly configured in the Searching for related events section of the KUMA Console.
Creating a KICS for Networks connector for sending events to KUMA
To create a connector for sending events in the web interface of KICS for Networks:
- Log in to the KICS for Networks web interface using an administrator account.
- Go to the Settings → Connectors section.
- Click the Add connector button.
- Specify the following settings:
- In the Connector type drop-down list, select SIEM.
- In the Connector name field, specify a name for the connector.
- In the Server address field, enter the IP address of the KICS for Networks Server.
- In the Connector deployment node drop-down list, select the node on which you are installing the connector.
You can specify any name.
- In the User name field, specify the user name for KUMA to use for connecting to the application through the connector. You must specify the name of one of the KICS for Networks users.
- In the SIEM server address field, enter the IP address of the KUMA collector server.
- In the Port number field, enter the port number of the KUMA collector.
- In the Transport protocol drop-down list, select TCP or UDP.
- Select the Allow sending audit entries check box.
- Select the Allow sending application entries check box.
- Click the Save button.
The connector is created. It is displayed in the table of KICS for Networks connectors with the Running status.
The KICS for Networks connector for sending events to KUMA is ready for use.
Page top
Configuring export of KICS for Networks events to KUMA
To configure the sending of security events from KICS for Networks to KUMA:
- Log in to the KICS for Networks web interface using an administrator account.
- Go to the Settings → Event types section.
- Select the check boxes for the types of events that you want to send to KUMA.
- Click Select connectors.
- This opens a window; in that window, select the connector that you created for sending events to KUMA.
- Click OK.
Events of selected types will be sent to KUMA. In the Event types table, such events are marked with a check box in the column with the connector name.
Page top
Creating a KUMA collector to receive KICS for Networks events
After configuring the event export settings, you must create a collector for KICS for Networks events in the KUMA Console.
For details on creating a KUMA collector, refer to Creating a collector.
When creating a collector in the KUMA Console, you must:
- At the Transport step, select the transport protocol type matching the type you selected when you created the connector in KICS for Networks at step 4i (TCP or UDP) and the port number matching the port number you specified at step 4h.
- At the Event parsing step, select the [OOTB] KICS4Net v3.х normalizer.
- At the Routing step, make sure that the following destinations are added to the collector resource set:
- storage—used to transmit data to the storage.
- correlator—used to transmit data to the correlator.
If destinations have not been added to the collector, you must create them.
- At the last step of the wizard, a command is displayed in the lower part of the window, which you can use to install the service on the server that you want to receive events. Copy this command and use it when installing the second part of the collector.
Configuring receipt of PT NAD events
You can configure the receipt of PT NAD events in the KUMA SIEM system.
Configuring event receiving consists of the following steps:
- Configuring export of PT NAD events to KUMA.
- Creating a KUMA collector for receiving PT NAD events.
To receive PT NAD events using Syslog, in the Collector Installation Wizard, at the Event parsing step, select the [OOTB] PT NAD json normalizer.
- Installing a KUMA collector for receiving PT NAD events.
- Verifying receipt of PT NAD events in the KUMA collector.
You can verify that the PT NAD event source server is correctly configured in the Searching for related events section of the KUMA Console.
Configuring export of PT NAD events to KUMA
Configuring the export of events from PT NAD 11 to KUMA over Syslog proceeds in stages:
- Configuring the ptdpi-worker@notifier module.
- Configuring the sending of syslog messages with information about activities, attacks and indicators of compromise.
Configuring the ptdpi-worker@notifier module.
To enable the sending of information about detected information security threats, you must configure the ptdpi-worker@notifier module.
In a multi-server configuration, these instructions must be followed on the primary server.
To configure the ptdpi-worker@notifier module:
- Open the /opt/ptsecurity/etc/ptdpi.settings.yaml file:
sudo nano /opt/ptsecurity/etc/ptdpi.settings.yaml - In the General settings group of settings, uncomment the 'workers' setting and add 'notifier' to its list of values.
For example:
workers: ad alert dns es hosts notifier - To the end of the file, append a line of the form: notifier.yaml.nad_web_url: <URL of the PT NAD web interface>
For example:
notifier.yaml.nad_web_url: https://ptnad.example.comThe ptdpi-worker@notifier module uses the specified URL to generate links to session and activity cards when sending messages.
- Restart the sensor:
sudo ptdpictl restart-all
The ptdpi-worker@notifier module is configured.
Configuring the sending of syslog messages with information about activities, attacks and indicators of compromise
The settings listed in the following instructions may not be present in the configuration file. If a setting is missing, you must add it to the file.
In a multi-server PT NAD configuration, edit the settings on the primary server.
To configure the sending of syslog messages with information about activities, attacks and indicators of compromise:
- Open the /opt/ptsecurity/etc/ptdpi.settings.yaml file:
sudo nano /opt/ptsecurity/etc/ptdpi.settings.yaml - By default, PT NAD sends activity information in Russian. To receive information in English, change the value of the notifier.yaml.syslog_notifier.locale setting to "en".
For example:
notifier.yaml.syslog_notifier.locale: en - In the notifier.yaml.syslog_notifier.addresses setting, add a section with settings for sending events to KUMA.
The <Connection name> setting can only contain Latin letters, numerals, and the underscore character.
For the 'address' setting, specify the IP address of the KUMA collector.
Other settings can be omitted, in which case the default values are used.
notifier.yaml.syslog_notifier.addresses:<Connection name>:address: <For sending to a remote server, specify protocol: UDP (default) or TCP, address and port; for local connection, specify Unix domain socket>doc_types: [<Comma-separated message types ('alert' for information about attacks, 'detection' for activities, and 'reputation' for information about indicators of compromise). By default, all types of messages are sent>]facility: <Numeric value of the subject category>ident: <software tag><Connection name>:...The following is a sample configuration of sending syslog messages with information about activities, attacks, and indicators of compromise to two remote servers via TCP and UDP without writing to the local log:
notifier.yaml.syslog_notifier.addresses:remote1:address: tcp://198.51.100.1:1514remote2:address: udp://198.51.100.2:2514 - Save your changes in the /opt/ptsecurity/etc/ptdpi.settings.yaml.
- Restart the ptdpi-worker@notifier module:
sudo ptdpictl restart-worker notifier
The sending of events to KUMA via Syslog is configured.
Page top
Configuring receipt of events using the MariaDB Audit Plugin
KUMA allows auditing events using the MariaDB Audit Plugin. The plugin supports MySQL 5.7 and MariaDB. The audit plugin does not support MySQL 8. Detailed information about the plugin is available on the official MariaDB website.
We recommend using MariaDB Audit Plugin version 1.2 or later.
Configuring event receiving consists of the following steps:
- Configuring the MariaDB Audit Plugin to send MySQL events and configuring the Syslog server to send events.
- Configuring the MariaDB Audit Plugin to send MariaDB events and configuring the Syslog server to send events.
- Creating a KUMA Collector for MySQL 5.7 and MariaDB Events.
To receive MySQL 5.7 and MariaDB events using the MariaDB Audit Plugin, in the KUMA Collector Installation Wizard, at the Event parsing step, in the Normalizer field, select [OOTB] MariaDB Audit Plugin syslog.
- Installing a collector in the KUMA network infrastructure.
- Verifying receipt of MySQL and MariaDB events by the KUMA collector.
To verify that the MySQL and MariaDB event source server is configured correctly, you can search for related events.
Configuring the MariaDB Audit Plugin to send MySQL events
The MariaDB Audit Plugin is supported for MySQL 5.7 versions up to 5.7.30 and is bundled with MariaDB.
To configure MySQL 5.7 event reporting using the MariaDB Audit Plugin:
- Download the MariaDB distribution kit and extract it.
You can download the MariaDB distribution kit from the official MariaDB website. The operating system of the MariaDB distribution must be the same as the operating system on which MySQL 5.7 is running.
- Connect to MySQL 5.7 using an account with administrator rights by running the following command:
mysql -u<username>-p - To get the directory where the MySQL 5.7 plugins are located, on the MySQL 5.7 command line, run the following command:
SHOW GLOBAL VARIABLES LIKE 'plugin_dir' - In the directory obtained at step 3, copy the MariaDB Audit Plugin from
<directory to which the distribution kit was extracted>/mariadb-server-<version>/lib/plugins/server_audit.so. - On the operating system command line, run the following command:
chmod 755<directory to which the distribution kit was extracted>server_audit.soFor example:
chmod 755 /usr/lib64/mysql/plugin/server_audit.so - On the MySQL 5.7 command line, run the following command:
install plugin server_audit soname 'server_audit.so' - Create a backup copy of the /etc/mysql/mysql.conf.d/mysqld.cnf configuration file.
- In the configuration file /etc/mysql/mysql.conf.d/mysqld.cnf, in the
[mysqld]section, add the following lines:server_audit_logging=1server_audit_events=connect,table,query_ddl,query_dml,query_dclserver_audit_output_type=SYSLOGserver_audit_syslog_facility=LOG_SYSLOGIf you want to disable event export for certain audit event groups, remove some of the values from the
server_audit_eventssetting. Descriptions of settings are available on the MariaDB Audit Plugin vendor's website. - Save changes to the configuration file.
- Restart the MariaDB service by running one of the following commands:
systemctl restart mysqldfor a system with systemd initialization.service mysqld restartfor a system with init initialization.
MariaDB Audit Plugin for MySQL 5.7 is configured. If necessary, you can run the following commands on the MySQL 5.7 command line:
show pluginsto check the list of current plugins.SHOW GLOBAL VARIABLES LIKE 'server_audit%'to check the current audit settings.
Configuring the MariaDB Audit Plugin to send MariaDB Events
The MariaDB Audit Plugin is included in the MariaDB distribution kit starting with versions 5.5.37 and 10.0.10.
To configure MariaDB event export using the MariaDB Audit Plugin:
- Connect to MariaDB using an account with administrator rights by running the following command:
mysql -u<username>-p - To check if the plugin is present in the directory where operating system plugins are located, run the following command on the MariaDB command line:
SHOW GLOBAL VARIABLES LIKE 'plugin_dir' - On the operating system command line, run the following command:
ll<directory obtained by the previous command>| grep server_audit.soIf the command output is empty and the plugin is not present in the directory, you can either copy the MariaDB Audit Plugin to that directory or use a newer version of MariaDB.
- On the MariaDB command line, run the following command:
install plugin server_audit soname 'server_audit.so' - Create a backup copy of the /etc/mysql/my.cnf configuration file.
- In the /etc/mysql/my.cnf configuration file, in the
[mysqld]section, add the following lines:server_audit_logging=1server_audit_events=connect,table,query_ddl,query_dml,query_dclserver_audit_output_type=SYSLOGserver_audit_syslog_facility=LOG_SYSLOGIf you want to disable event export for certain audit event groups, remove some of the values from the
server_audit_eventssetting. Descriptions of settings are available on the MariaDB Audit Plugin vendor's website. - Save changes to the configuration file.
- Restart the MariaDB service by running one of the following commands:
systemctl restart mariadbfor a system with systemd initialization.service mariadb restartfor a system with init initialization.
MariaDB Audit Plugin for MariaDB is configured. If necessary, you can run the following commands on the MariaDB command line:
show pluginsto check the list of current plug-ins.SHOW GLOBAL VARIABLES LIKE 'server_audit%'to check the current audit settings.
Configuring a Syslog server to send events
The rsyslog service is used to transmit events from the server to the collector.
To configure the sending of events from the server where MySQL or MariaDB is installed to the collector:
- Before making any changes, create a backup copy of the /etc/rsyslog.conf configuration file.
- To send events via UDP, add the following line to the /etc/rsyslog.conf configuration file:
*.* @<IP address of the KUMA collector>:<port of the KUMA collector>For example:
*.* @192.168.1.5:1514If you want to send events over TCP, the line should be as follows:
*.* @@192.168.1.5:2514Save changes to the /etc/rsyslog.conf configuration file.
- Restart the rsyslog service by executing the following command:
sudo systemctl restart rsyslog.service
Configuring receipt of Apache Cassandra events
KUMA allows receiving information about Apache Cassandra events.
Configuring event receiving consists of the following steps:
- Configuring Apache Cassandra event logging in KUMA.
- Creating a KUMA collector for Apache Cassandra events.
To receive Apache Cassandra events, in the KUMA Collector Installation Wizard, at the Transport step, select a file type connector; at the Event parsing step, in the Normalizer field, select [OOTB] Apache Cassandra file.
- Installing a collector in the KUMA network infrastructure.
- Verifying receipt of Apache Cassandra events in the KUMA collector.
To verify that the Apache Cassandra event source server is configured correctly, you can search for related events.
Configuring Apache Cassandra event logging in KUMA
To configuring Apache Cassandra event logging in KUMA:
- Make sure that the server where Apache Cassandra is installed has 5 GB of free disk space.
- Connect to the Apache Cassandra server using an account with administrator rights.
- Before making changes, create backup copies of the following configuration files:
- /etc/cassandra/cassandra.yaml
- /etc/cassandra/logback.xml
- Make sure that the settings in the /etc/cassandra/cassandra.yaml configuration file have the following values; make changes if necessary:
- in the
audit_logging_optionssection, set theenabledsetting totrue. - In the
loggersection, set theclass_nameparameter toFileAuditLogger.
- in the
- Add the following lines to the /etc/cassandra/logback.xml configuration file:
<!-- Audit Logging (FileAuditLogger) rolling file appender to audit.log --><appender name="AUDIT" class="ch.qos.logback.core.rolling.RollingFileAppender"><file>${cassandra.logdir}/audit/audit.log</file><rollingPolicy class="ch.qos.logback.core.rolling.SizeAndTimeBasedRollingPolicy"><!-- rollover daily --><fileNamePattern>${cassandra.logdir}/audit/audit.log.%d{yyyy-MM-dd}.%i.zip</fileNamePattern><!-- each file should be at most 50MB, keep 30 days worth of history, but at most 5GB --><maxFileSize>50MB</maxFileSize><maxHistory>30</maxHistory><totalSizeCap>5GB</totalSizeCap></rollingPolicy><encoder><pattern>%-5level [%thread] %date{ISO8601} %F:%L - %replace(%msg){'\n', ' '}%n</pattern></encoder></appender><!-- Audit Logging additivity to redirect audt logging events to audit/audit.log --><logger name="org.apache.cassandra.audit" additivity="false" level="INFO"><appender-ref ref="AUDIT"/></logger> - Save changes to the configuration file.
- Restart the Apache Cassandra service using the following commands:
sudo systemctl stop cassandra.servicesudo systemctl start cassandra.service
- After restarting, check the status of Apache Cassandra using the following command:
sudo systemctl status cassandra.serviceMake sure that the command output contains the following sequence of characters:
Active: active (running)
Apache Cassandra event export is configured. Events are located in the /var/log/cassandra/audit/ directory, in the audit.log file (${cassandra.logdir}/audit/audit.log).
Page top
Configuring receipt of FreeIPA events
You can configure the receipt of FreeIPA events in KUMA via the Syslog protocol.
Configuring event receiving consists of the following steps:
- Configuring export of FreeIPA events to KUMA.
- Creating a KUMA collector for receiving FreeIPA events.
To receive FreeIPA events, in the KUMA Collector Setup Wizard, at the Event parsing step, in the Normalizer field, select [OOTB] FreeIPA.
- Installing the KUMA collector in the network infrastructure.
- Verifying receipt of FreeIPA events by KUMA.
To verify that the FreeIPA event source server is configured correctly, you can search for related events.
Configuring export of FreeIPA events to KUMA
To configure the export of FreeIPA events to KUMA via the Syslog protocol in JSON format:
- Connect to the FreeIPA server via SSH using an account with administrator rights.
- In the /etc/rsyslog.d/ directory, create a file named freeipa-to-siem.conf.
- Add the following lines to the /etc/rsyslog.d/freeipa-to-siem.conf configuration file:
template(name="ls_json" type="list" option.json="on"){ constant(value="{")constant(value="\"@timestamp\":\"") property(name="timegenerated" dateFormat="rfc3339")constant(value="\",\"@version\":\"1")constant(value="\",\"message\":\"") property(name="msg")constant(value="\",\"host\":\"") property(name="fromhost")constant(value="\",\"host_ip\":\"") property(name="fromhost-ip")constant(value="\",\"logsource\":\"") property(name="fromhost")constant(value="\",\"severity_label\":\"") property(name="syslogseverity-text")constant(value="\",\"severity\":\"") property(name="syslogseverity")constant(value="\",\"facility_label\":\"") property(name="syslogfacility-text")constant(value="\",\"facility\":\"") property(name="syslogfacility")constant(value="\",\"program\":\"") property(name="programname")constant(value="\",\"pid\":\"") property(name="procid")constant(value="\",\"syslogtag\":\"") property(name="syslogtag")constant(value="\"}\n")}*.* @<IP address of the KUMA collector>:<port of the KUMA collector KUMA>;ls_jsonYou can fill in the last line in accordance with the selected protocol:
*.* @<192.168.1.10>:<1514>;ls_jsonfor sending events over UDP*.* @@<192.168.2.11>:<2514>;ls_jsonfor sending events over TCP - Add the following lines to the /etc/rsyslog.conf configuration file:
$IncludeConfig /etc/freeipa-to-siem.conf$RepeatedMsgReduction off - Save changes to the configuration file.
- Restart the rsyslog service by executing the following command:
sudo systemctl restart rsyslog.service
Configuring receipt of VipNet TIAS events
You can configure the receipt of ViPNet TIAS events in KUMA via the Syslog protocol.
Configuring event receiving consists of the following steps:
- Configuring export of ViPNet TIAS events to KUMA.
- Creating a KUMA collector for receiving ViPNet TIAS events.
To receive ViPNet TIAS events using Syslog, in the Collector Installation Wizard, at the Event parsing step, select the [OOTB] Syslog-CEF normalizer.
- Installing a KUMA collector for receiving ViPNet TIAS events.
- Verifying receipt of ViPNet TIAS events in KUMA.
You can verify that ViPNet TIAS event source server is correctly configured in the Searching for related events section of the KUMA Console.
Configuring export of ViPNet TIAS events to KUMA
To configure the export of ViPNet TIAS events to KUMA via the syslog protocol:
- Connect to the ViPNet TIAS web interface under a user account with administrator rights.
- Go to the Management – Integrations section.
- On the Integration page, go to the Syslog tab.
- In the toolbar of the list of receiving servers, click New server.
- This opens the new server card; in that card:
- In the Server address field, enter the IP address or domain name of the KUMA collector.
For example, 10.1.2.3 or syslog.siem.ru
- In the Port field, specify the inbound port of the KUMA collector. The default port number is 514.
- In the Protocol list, select the transport layer protocol that the KUMA collector is listening on. UDP is selected by default.
- In the Organization list, use the check boxes to select the organizations of the ViPNet TIAS infrastructure.
Messages are sent only for incidents detected based on events received from sensors of selected organizations of the infrastructure.
- In the Status list, use check boxes to select incident statuses.
Messages are sent only when selected statuses are assigned to incidents.
- In the Severity level list, use check boxes to select the severity levels of the incidents.
Messages are sent only about incidents with the selected severity levels. By default, only the high severity level is selected in the list.
- In the UI language list, select the language in which you want to receive information about incidents in messages. Russian is selected by default.
- In the Server address field, enter the IP address or domain name of the KUMA collector.
- Click Add.
- In the toolbar of the list, set the Do not send incident information in CEF format toggle switch to enabled.
As a result, when new incidents are detected or the statuses of previously detected incidents change, depending on the statuses selected during configuration, the corresponding information is sent to the specified addresses of receiving servers via the syslog protocol in CEF format.
- Click Save changes.
Export of events to the KUMA collector is configured.
Page top
Configuring receipt of Nextcloud events
You can configure the receipt of Nextcloud 26.0.4 events in the KUMA SIEM system.
Configuring event receiving consists of the following steps:
- Configuring audit of Nextcloud events.
- Configuring a Syslog server to send events.
The rsyslog service is used to transmit events from the server to the collector.
- Creating a KUMA collector for receiving Nextcloud events.
To receive Nextcloud events, in the Collector Installation Wizard, at the Event parsing step, select the [OOTB] Nextcloud syslog normalizer, and at the Transport step select the tcp or udp connector type.
- Installing KUMA collector for receiving Nextcloud events
- Verifying receipt of Nextcloud events in the KUMA collector
You can verify that the Nextcloud event source server is correctly configured in the Searching for related events section of the KUMA Console.
Configuring audit of Nextcloud events
To configure the export of Nextcloud events to KUMA:
- On the server where Nextcloud is installed, create a backup copy of the /home/localuser/www/nextcloud/config/config.php configuration file.
- Edit the /home/localuser/www/nextcloud/config/config.php Nextcloud configuration file.
- Edit the settings as follows:
'log_type' => 'syslog','syslog_tag' => 'Nextcloud','logfile' => '','loglevel' => 0,'log.condition' => ['apps' => ['admin_audit'],], - Restart the Nextcloud service:
sudo service restart nextcloud
Export of events to the KUMA collector is configured.
Page top
Configuring a Syslog server to send Nextcloud events
To configure the sending of events from the server where Nextcloud is installed to the collector:
- In the /etc/rsyslog.d/ directory, create a Nextcloud-to-siem.conf file with the following content:
If $programname contains 'Nextcloud' then @<IP address of the collector>:<port of the collector>Example:
If $programname contains 'Nextcloud' then @192.168.1.5:1514If you want to send events via TCP, the contents of the file must be as follows:
If $programname contains 'Nextcloud' then @<IP address of the collector>:<port of the collector> - Save changes to the Nextcloud-to-siem.conf configuration file.
- Create a backup copy of the /etc/rsyslog.conf file.
- Add the following lines to the /etc/rsyslog.conf configuration file:
$IncludeConfig /etc/Nextcloud-to-siem.conf$RepeatedMsgReduction off - Save your changes.
- Restart the rsyslog service by executing the following command:
sudo systemctl restart rsyslog.service
The export of Nextcloud events to the collector is configured.
Page top
Configuring receipt of Snort events
You can configure the receipt of Snort 3 events in the KUMA SIEM system.
Configuring event receiving consists of the following steps:
- Configuring logging of Snort events.
- Creating a KUMA collector for receiving Snort events.
To receive Snort events, in the Collector Installation Wizard, at the Event parsing step, select the [OOTB] Snort 3 json file normalizer, and at the Transport step, select the file connector type.
- Installing a KUMA collector for receiving Snort events
- Verifying receipt of Snort events in the KUMA collector
You can verify that the Snort event source server is correctly configured in the Searching for related events section of the KUMA Console.
Configuring logging of Snort events
Make sure that the server running Snort has at least 500 MB of free disk space for storing a single Snort event log.
When the log reaches 500 MB, Snort automatically creates a new file with a name that includes the current time in unixtime format.
We recommend monitoring disk space usage.
To configure Snort event logging:
- Connect to the server where Snort is installed using an account with administrative privileges.
- Edit the Snort configuration file. To do so, run the following command on the command line:
sudo vi /usr/local/etc/snort/snort.lua - In the configuration file, edit the alert_json block:
alert_json ={file = true,limit = 500,fields = 'seconds action class b64_data dir dst_addr dst_ap dst_port eth_dst eth_len \eth_src eth_type gid icmp_code icmp_id icmp_seq icmp_type iface ip_id ip_len msg mpls \pkt_gen pkt_len pkt_num priority proto rev rule service sid src_addr src_ap src_port \target tcp_ack tcp_flags tcp_len tcp_seq tcp_win tos ttl udp_len vlan timestamp',} - To complete the configuration, run the following command:
sudo /usr/local/bin/snort -c /usr/local/etc/snort/snort.lua -s 65535 -k none -l /var/log/snort -i<name of the interface that Snort is listening on>-m 0x1b
As a result, Snort events are logged to /var/log/snort/alert_json.txt.
Page top
Configuring receipt of Suricata events
You can configure the receipt of Suricata 7.0.1 events in the KUMA SIEM system.
Configuring event receiving consists of the following steps:
- Configuring export of Suricata events to KUMA
- Creating a KUMA collector for receiving Suricata events.
To receive Suricata events, in the Collector Installation Wizard, at the Event parsing step, select the [OOTB] Suricata json file normalizer, and at the Transport step, select the file connector type.
- Installing KUMA collector for receiving Suricata events
- Verifying receipt of Suricata events in the KUMA collector
You can verify that the Suricata event source server is correctly configured in the Searching for related events section of the KUMA Console.
Configuring audit of Suricata events.
To configure Suricata event logging:
- Connect via SSH to the server that has administrative accounts.
- Create a backup copy of the /etc/suricata/suricata.yaml file.
- Set the following values in the eve-log section of the /etc/suricata/suricata.yaml configuration file:
- eve-log:enabled: yesfiletype: regular #regular|syslog|unix_dgram|unix_stream|redisfilename: eve.json - Save your changes to the /etc/suricata/suricata.yaml configuration file.
As a result, Suricata events are logged to the /usr/local/var/log/suricata/eve.json file.
Suricata does not support limiting the size of the eve.json event file. If necessary, you can manage the log size by using rotation. For example, to configure hourly log rotation, add the following lines to the configuration file:
outputs:
- eve-log:
filename: eve-%Y-%m-%d-%H:%M.json
rotate-interval: hour
Configuring receipt of FreeRADIUS events
You can configure the receipt of FreeRADIUS 3.0.26 events in the KUMA SIEM system.
Configuring event receiving consists of the following steps:
- Configuring audit of FreeRADIUS events.
- Configuring a Syslog server to send FreeRADIUS events.
- Creating a KUMA collector for receiving FreeRADIUS events.
To receive FreeRADIUS events, in the Collector Installation Wizard, at the Event parsing step, select the [OOTB] FreeRADIUS syslog normalizer, and at the Transport step, select the tcp or udp connector type.
- Installing KUMA collector for receiving FreeRADIUS events.
- Verifying receipt of FreeRADIUS events in the KUMA collector.
You can verify that the FreeRADIUS event source server is correctly configured in the Searching for related events section of the KUMA Console.
Configuring audit of FreeRADIUS events
To configure event audit in the FreeRADIUS system:
- Connect to the server where the FreeRADIUS system is installed using an account with administrative privileges.
- Create a backup copy of the FreeRADIUS configuration file:
sudo cp /etc/freeradius/3.0/radiusd.conf /etc/freeradius /3.0/radiusd.conf.bak - Open the FreeRADIUS configuration file for editing:
sudo nano /etc/freeradius/3.0/radiusd.conf - In the 'log' section, edit the settings as follows:
destination = syslogsyslog_facility = daemonstripped_names = noauth = yesauth_badpass = yesauth_goodpass = yes - Save the configuration file.
FreeRADIUS event audit is configured.
Page top
Configuring a Syslog server to send FreeRADIUS events
The rsyslog service is used to transmit events from the FreeRADIUS server to the KUMA collector.
To configure the sending of events from the server where FreeRADIUS is installed to the collector:
- In the /etc/rsyslog.d/ directory, create the FreeRADIUS-to-siem.conf file and add the following line to it:
If $programname contains 'radiusd' then @<IP address of the collector>:<port of the collector>If you want to send events via TCP, the contents of the file must be as follows:
If $programname contains 'radiusd' then @<IP address of the collector>:<port of the collector> - Create a backup copy of the /etc/rsyslog.conf file.
- Add the following lines to the /etc/rsyslog.conf configuration file:
$IncludeConfig /etc/FreeRADIUS-to-siem.conf$RepeatedMsgReduction off - Save your changes.
- Restart the rsyslog service:
sudo systemctl restart rsyslog.service
The export of events from the FreeRADIUS server to the KUMA collector is configured.
Page top
Configuring receipt of VMware vCenter events
You can configure the receipt of VMware vCenter events in the KUMA SIEM system.
Configuring event receiving consists of the following steps:
- Configuring the connection to VMware vCenter.
- Creating a KUMA collector for receiving VMware vCenter events.
To receive VMware vCenter events, in the collector installation wizard, at the Transport step, select the vmware connector type. Specify the required settings:
- The URL at which the VMware API is available, for example, https://vmware-server.com:6440.
- VMware credentials — a secret that specifies the username and password for connecting to the VMware API.
At the Event parsing step, select the [OOTB] VMware vCenter API normalizer.
- Installing a KUMA collector for receiving VMware vCenter events.
- Verifying receipt of VMware vCenter events in the KUMA collector.
You can verify that the VMware vCenter event source server is correctly configured in the Searching for related events section of the KUMA Console.
Configuring the connection to VMware vCenter
To configure a connection to VMware vCenter to receive events:
- Connect to the VMware vCenter web interface under a user account that has administrative privileges.
- Go to the Security&Users section and select Users.
- Create a user account.
- Go to the Roles section and assign the "Read-only: See details of objects role, but not make changes" role to the created account.
You will use the credentials of this user account in the secret of the collector.
For details about creating user accounts, refer to the VMware vCenter documentation.
The connection to VMware vCenter for receiving events is configured.
Page top
Configuring receipt of zVirt events
You can configure the receipt of zVirt 3.1 events in the KUMA SIEM system.
Configuring event receiving consists of the following steps:
- Configuring export of zVirt events to KUMA.
- Creating a KUMA collector for receiving zVirt events.
To receive zVirt events, in the Collector Installation Wizard, at the Event parsing step, select the [OOTB] OrionSoft zVirt syslog normalizer, and at the Transport step, select the tcp or udp connector type.
- Installing KUMA collector for receiving zVirt events
- Verifying receipt of zVirt events in the KUMA collector
You can verify that the zVirt event source server is correctly configured in the Searching for related events section of the KUMA Console.
Configuring export of zVirt events
ZVirt can send events to external systems in Hosted Engine installation mode.
To configure the export of zVirt events to KUMA:
- In the zVirt web interface, under Resources, select Virtual machines.
- Select the machine that is running the HostedEngine virtual machine and click Edit.
- In the Edit virtual machine window, go to the Logging section.
- Select the Determine Syslog server address check box.
- In the text box, enter the collector information in the following format:
<IP address or FQDN of the KUMA collector>:<port of the KUMA collector>. - If you want to use TCP instead of UDP for sending logs, select the Use TCP connection check box.
Event export is configured.
Page top
Configuring receipt of Zeek IDS events
You can configure the receipt of Zeek IDS 1.8 events in the KUMA SIEM system.
Configuring event receiving consists of the following steps:
- Conversion of the Zeek IDS event log format.
The KUMA normalizer supports Zeek IDS logs in the JSON format. To send events to the KUMA normalizer, log files must be converted to the JSON format.
- Creating a KUMA collector for receiving Zeek IDS events.
To receive Zeek IDS events, in the Collector Installation Wizard, at the Event parsing step, select the [OOTB] ZEEK IDS json file normalizer, and at the Transport step, select the file connector type.
- Installing KUMA collector for receiving Zeek IDS events
- Verifying receipt of Zeek IDS events in the KUMA collector
You can verify that the Zeek IDS event source server is correctly configured in the Searching for related events section of the KUMA Console.
Conversion of the Zeek IDS event log format
By default, Zeek IDS events are logged in files in the /opt/zeek/logs/current directory.
The "[OOTB] ZEEK IDS json file" normalizer supports Zeek IDS logs in the JSON format. To send events to the KUMA normalizer, log files must be converted to the JSON format.
This procedure must be repeated every time before receiving Zeek IDS events.
To convert the Zeek IDS event log format:
- Connect to the server where Zeek IDS is installed using an account with administrative privileges.
- Create the directory where JSON event logs must be stored:
sudo mkdir /opt/zeek/logs/zeek-json - Change to this directory:
sudo cd /opt/zeek/logs/zeek-json - Run the command that uses the jq utility to convert the original event log format to the target format:
jq . -c<path to the log file to be converted to a different format>>><new file name>.logExample:
jq . -c /opt/zeek/logs/current/conn.log >> conn.log
As a result of running the command, a new file is created in the /opt/zeek/logs/zeek-json directory if this file did not exist before. If the file was already present in the current directory, new information is appended to the end of the file.
Page top
Configuring Windows event reception using Kaspersky Endpoint Security for Windows
In KES for Windows, starting from version 12.6, events can be sent from Windows logs to a KUMA collector. In this way, KUMA can get events from Windows logs (a limited set of EventIDs of Microsoft products is supported) from all hosts with KES for Windows 12.6 without installing KUMA agents on such hosts. To activate the functionality, you need:
- A valid KUMA license
- KSC 14.2 or later
- KES for Windows version 12.6 or later
Configuring event receiving consists of the following steps:
- Importing the normalizer into KUMA.
In KUMA, you must configure getting updates through Kaspersky update servers.
Click Import resources and in the list of normalizers available for installation, select [OOTB] Microsoft Products via KES WIN.
- Creating a KUMA collector for receiving Windows events.
To receive Windows events, at the Transport step, select TCP or UDP and specify the port number that the collector must listen on. At the Event parsing step, select the [OOTB] Microsoft Products via KES WIN normalizer. At the Event filtering step, select the [OOTB] Microsoft Products via KES WIN - Event filter for collector filter.
- Requesting a key from KUMA Technical Support.
If your license did not include a key for activating the functionality of sending Windows logs to the KUMA collector, send the following message to Technical Support: "We have purchased a KUMA license and are using KES for Windows version 12.6. We want to activate the functionality of sending Windows logs to the KUMA collector. Please provide a key file to activate the functionality." New KUMA users do not need to make a Technical Support request because new users get 2 keys with licenses for KUMA and for activating the KES for Windows functionality.
In response to your message, you will get a key file.
- Configuration on the side of KSC and KES for Windows.
A key file that activates the functionality of sending Windows events to KUMA collectors must be imported into KSC and distributed to KES endpoints in accordance with the instructions. You must also add KUMA server addresses to the KES policy and specify network connection settings.
- Verifying receipt of Windows events in the KUMA collector
You can verify that the Windows event source server is correctly configured in the Searching for related events section of the KUMA Console.
Microsoft product events transmitted by KES for Windows are listed in the following table:
Event log
Event ID
DNS Server
150
DNS Server
770
MSExchange Management
1
Security
4781
Security
6416
Security
1100
Security
1102 / 517
Security
1104
Security
1108
Security
4610 / 514
Security
4611
Security
4614 / 518
Security
4616 / 520
Security
4622
Security
4624 / 528 / 540
Security
4625 / 529
Security
4648 / 552
Security
4649
Security
4662
Security
4663
Security
4672 / 576
Security
4696
Security
4697 / 601
Security
4698 / 602
Security
4702
Security
4704 / 608
Security
4706
Security
4713/617
Security
4715
Security
4717 / 621
Security
4719 / 612
Security
4720 / 624
Security
4722 / 626
Security
4723 / 627
Security
4724 / 628
Security
4725 / 629
Security
4726 / 630
Security
4727
Security
4728 / 632
Security
4729 / 633
Security
4732 / 636
Security
4733 / 637
Security
4738 / 642
Security
4739/643
Security
4740 / 644
Security
4741
Security
4742 / 646
Security
4756 / 660
Security
4757 / 661
Security
4765
Security
4766
Security
4767
Security
4768 / 672
Security
4769 / 673
Security
4770
Security
4771 / 675
Security
4775
Security
4776 / 680
Security
4778 / 682
Security
4780 / 684
Security
4794
Security
4798
Security
4817
Security
4876 / 4877
Security
4882
Security
4885
Security
4886
Security
4887
Security
4890
Security
4891
Security
4898
Security
4899
Security
4900
Security
4902
Security
4904
Security
4905
Security
4928
Security
4946
Security
4947
Security
4948
Security
4949
Security
4950
Security
4964
Security
5025
Security
5136
Security
5137
Security
5138
Security
5139
Security
5141
Security
5142
Security
5143
Security
5144
Security
5145
Security
5148
Security
5155
Security
5376
Security
5377
Security
5632
Security
5888
Security
5889
Security
5890
Security
676
System
1
System
104
System
1056
System
12
System
13
System
6011
System
7040
System
7045
System, Source Netlogon
5723
System, Source Netlogon
5805
Terminal-Services-RemoteConnectionManager
1149
Terminal-Services-RemoteConnectionManager
1152
Terminal-Services-RemoteConnectionManager
20523
Terminal-Services-RemoteConnectionManager
258
Terminal-Services-RemoteConnectionManager
261
Windows PowerShell
400
Windows PowerShell
500
Windows PowerShell
501
Windows PowerShell
800
Application, Source ESENT
301
Application, Source ESENT
302
Application, Source ESENT
325
Application, Source ESENT
326
Application, Source ESENT
327
Application, Source ESENT
2001
Application, Source ESENT
2003
Application, Source ESENT
2005
Application, Source ESENT
2006
Application, Source ESENT
216
Application
1000
Application
1002
Application
1 / 2
Configuring receipt of Codemaster Mirada events
You can configure the receipt of Codemaster Mirada events in the KUMA SIEM system.
Configuring event receiving consists of the following steps:
- Configuring audit of the Codemaster Mirada system.
- Creating a KUMA collector for receiving Codemaster Mirada events.
To receive Codemaster Mirada, in the Collector Installation Wizard, at the Event parsing step, select the [OOTB] Codemaster Mirada syslog normalizer, and at the Transport step, select the tcp or udp connector type.
- Installing a collector in the KUMA network infrastructure.
- Verifying receipt of Codemaster Mirada events in the KUMA collector
You can verify that the Codemaster Mirada event source server is correctly configured in the Events section of the KUMA Console.
Configuring audit of the Codemaster Mirada system
The Codemaster Mirada system can send events over the Syslog protocol.
To configure event audit in the Codemaster Mirada system:
- Connect to the Codemaster Mirada web interface under a user account that has administrative privileges.
- Go to the Settings → Syslog section.
- Enable the event transmission service using the toggle switch.
- Select the type and format of the protocol by clicking the dot-in-a-circle icon.
- In the Host field, specify the IP address of the KUMA collector.
- In the Protocol field, specify the UDP or TCP transport protocol.
- In the Port field, specify the port that the KUMA collector is listening on.
The default port is 514.
- In the Format field, specify the RFC 3164 standard.
- Click Save in the lower part of the page to save the changes.
Configuring receipt of Postfix events
You can configure the receipt of Postfix events in KUMA. Integration is only possible when sending events via syslog using the TCP protocol. The resources described in this article are available for KUMA 3.0 and newer versions.
Configuring event receiving consists of the following steps:
- Configuring Postfix to send events.
- Creating a KUMA collector for receiving Postfix events.
- Verifying receipt of Postfix events in the KUMA collector
You can verify that the Postfix event source server is correctly configured in the Searching for related events section of the KUMA Console.
The Postfix system generates events in two formats:
- Multi-line events containing information about messages (with a unique ID). These events have the following form:
<syslog PRI> time host process_name: ID: information from base event 1
<syslog PRI> time host process_name: id: info from base event 2
- Single-line events containing information about errors (without an ID). These events have the following form:
<syslog PRI> time host process_name: severity: basic information for parsing
A set of KUMA resources is used to process Postfix events; this set of resources must be applied when creating a collector:
- Normalizer
- Aggregation rule
- Filters for destinations
The collector aggregates multi-line base events based on event ID, normalizes them, and sends the aggregated event to the storage and the correlator.
The aggregated event has the following form:
Service information from the aggregation rule: ID: information from base event 1, information from base event 2, information from base event n
After aggregation, the received event is sent to the same collector where the aggregated event is normalized.
Processing algorithm for Postfix events
The following algorithm was implemented to process Postfix events:
- Initial normalization
At this stage, initial normalization is performed for base events received via syslog that begin with the "<" character. The events are brought to a format suitable for subsequent aggregation: the first character is extracted from the event and put into the FlexString1 field, the identifier is put into the ExternalID field, and the host name is put into the DeviceHostName field. Basic normalization is performed in the main normalizer.
- Checking for aggregation
The event is examined to see if it is aggregated or not. As a result, non-aggregated events (the first character is not "{" and the ID is not empty) have an aggregation rule applied, and then aggregated events are sent for re-normalization.
- Applying the aggregation rule
At this stage, the aggregation rule is applied to the events, the base events are collated and take the following form:
Service information from the aggregation rule: ID: information from base event 1, information from base event 2, information from base event n
- After aggregation, the collated event is sent back to the same collector to subject the aggregated event to normalization.
To close the event processing loop, you must specify the same collector as the destination. In the diagram, the destination is named "Loop" to draw attention to the event processing loop. You can give an arbitrary name to your destination.
- Normalization of the aggregated event
Normalization of the aggregated event that begins with a "{" character is performed in the following extra normalizers: Aggregated events, Aggregated events. Message KV parser, Aggregated events. Message regex 1, Aggregated events. Message regex 2.
- Sending to storage and the correlator
Aggregated and normalized events are sent to storage and the correlator.
The following figure shows the flow chart of Postfix event processing.
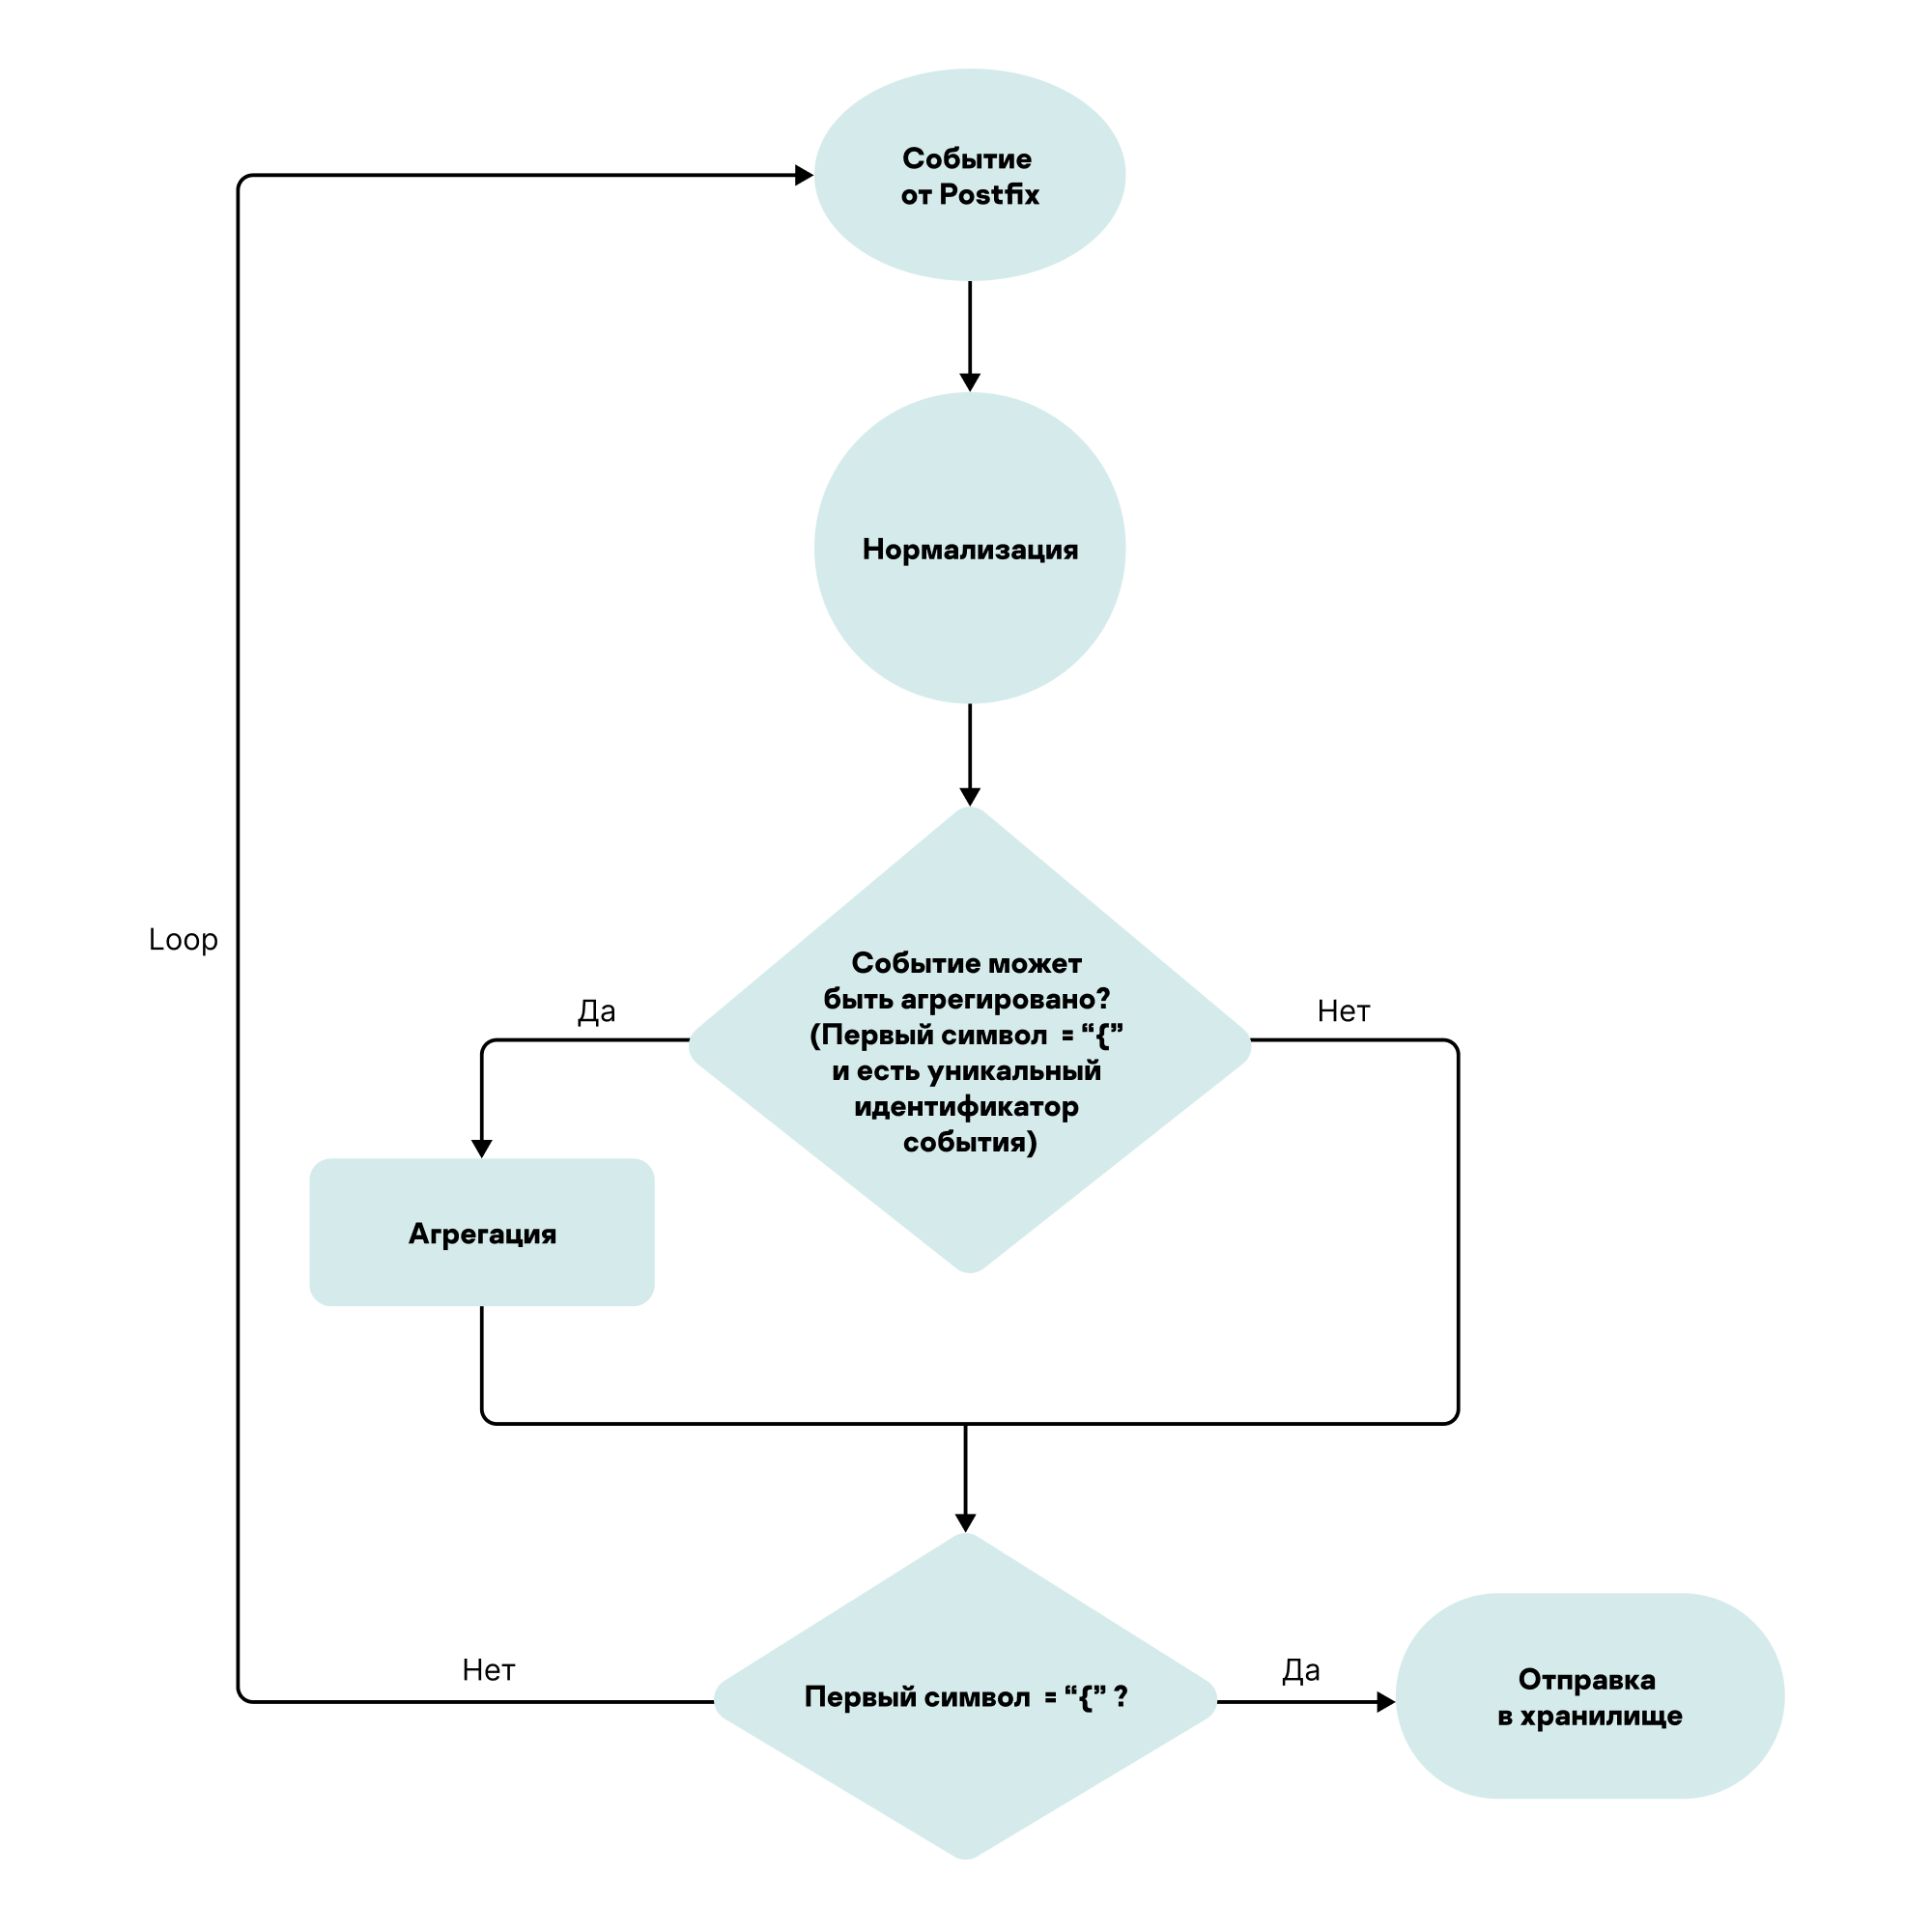
Configuring Postfix to send events
By default, audit events of the Postfix system are output to /var/log/maillog or /var/log/mail.
To send events to KUMA:
- Create a backup copy of the /etc/rsyslog.conf file.
- Open the /etc/rsyslog.conf file for editing.
- Add the following line to the end of the /etc/rsyslog.conf file:
mail.* @@<IP address of the KUMA collector>:<port of the KUMA collector> - Save the /etc/rsyslog.conf file.
- Restart the rsyslog service:
sudo systemctl restart rsyslog
Configuring a KUMA collector for receiving and processing Postfix events
To configure a KUMA collector for receiving Postfix events:
- Import the [OOTB] Postfix package from the KUMA repository. The package is available for KUMA 3.0 and newer versions.
- Create a new collector, and in the Collector Installation Wizard, configure the following:
- At the Transport step, in the Type field, select the tcp type, and in the URL field, specify the FQDN or IP address and port of the collector.
- At the Event parsing step, click Add event parsing, and in the displayed Basic event parsing window, in the Normalizer drop-down list, select the [OOTB] Postfix syslog normalizer.
- At the Event aggregation step, click Add aggregation rule, and in the displayed Event aggregation window, in the Aggregation rule drop-down list, select [OOTB] Postfix. Aggregation rule.
- At the Routing step, click Add and in the displayed Create destination window, create three destination points one by one—the same collector with the name "Loop", a storage, and a correlator.
- Create a destination named "Loop" with the following parameters.
- On the Basic settings tab, in the Type drop-down list, select the tcp transport type; in the URL field, specify the FQDN or IP address and port of the collector that you specified before at step 2.1 of these instructions.
- On the Advanced settings tab, in the Filter drop-down list, select the Postfix. Filter for event aggregation filter.
This configuration is necessary to send the aggregated event to the same collector for subsequent normalization.
- Create a correlator destination:
- On the Basic settings tab, in the Type drop-down list, select correlator and fill in the URL field.
- On the Advanced settings tab, in the Filter drop-down list, select the Postfix. Aggregated events to storage and correlator filter.
- Create a storage destination:
- On the Basic settings tab, in the Type drop-down list, select storage and fill in the URL field.
- On the Advanced settings tab, in the Filter drop-down list, select the Postfix. Aggregated events to storage and correlator filter.
This configuration is necessary to send the aggregated normalized event to storage and the correlator.
- Create a destination named "Loop" with the following parameters.
- Click the Create button.
The collector service is created with the settings specified in the KUMA Console. The command for installing the service on the server is displayed.
- Copy the collector installation command and run it on the relevant server.
The collector is configured to receive and process Postfix events.
Page top
Configuring receipt of CommuniGate Pro events
You can configure the receipt of CommuniGate Pro 6.1 events in KUMA. Integration is only possible when sending events via syslog using the TCP protocol. The resources described in this article are available for KUMA 3.0 and newer versions. Processing of SIP module events is supported (such events contain the "SIPDATA" character sequence).
Configuring event receiving consists of the following steps:
- Configuring CommuniGate Pro to send events
- Configuring the KUMA collector for receiving CommuniGate Pro events
- Verifying receipt of CommuniGate Pro events in the KUMA collector
You can verify that the CommuniGate Pro event source server is correctly configured in the Searching for related events section of the KUMA Console.
The CommuniGate Pro system generates an audit event as several separate records that look like this:
<event code> timestamp ID direction: information from base event 1
<event code> timestamp ID direction: information from base event 2
<event code> timestamp ID direction: base information n
A set of KUMA resources is used to process CommuniGate Pro events; this set of resources must be applied when creating a collector:
- Normalizer
- Aggregation rule
- Filters for destinations
The collector aggregates multi-line base events based on event ID, normalizes them, and sends the aggregated event to the storage and the correlator.
The aggregated event has the following form:
Service information from the aggregation rule: ID: information from base event 1, information from base event 2, information from base event n
After aggregation, the received event is sent to the same collector where the aggregated event is normalized.
Processing algorithm for CommuniGate Pro events
The following algorithm was implemented to process CommuniGate Pro events:
- Initial normalization
At this stage, the initial normalization of base events is performed. The first character in the base event is a numeral. The events are brought to a format suitable for subsequent aggregation: the first character is extracted from the event and put into the DeviceCustomString1 field, the identifier is put into the ExternalID field, and the host name is put into the DeviceHostName field. Basic normalization is performed in the main normalizer.
- Checking for aggregation
The event is examined to see if it is aggregated or not. As a result, non-aggregated events (the first character is a numeral) have an aggregation rule applied, and then aggregated events are sent for re-normalization. Aggregation is performed using the "[OOTB] CommuniGate Pro. Aggregation rule".
- Applying the aggregation rule
At this stage, the aggregation rule is applied to the events, the base events are collated and take the following form:
Service information from the aggregation rule: ID: information from base event 1, information from base event 2, information from base event n
After aggregation, the collated event is sent back to the same collector to subject the aggregated event to normalization.
To close the event processing loop, you must specify the same collector as the destination. In the diagram, the destination is named "Loop" to draw attention to the event processing loop. You can give an arbitrary name to your destination.
- Normalization of the aggregated event
Normalization of the aggregated event that begins with a "{" character is performed in the following extra normalizers: Aggregated events, Aggregated events - kv part.
- Sending to storage and the correlator
Aggregated and normalized events are sent to storage and the correlator.
The following figure shows the flow chart of CommuniGate Pro event processing.
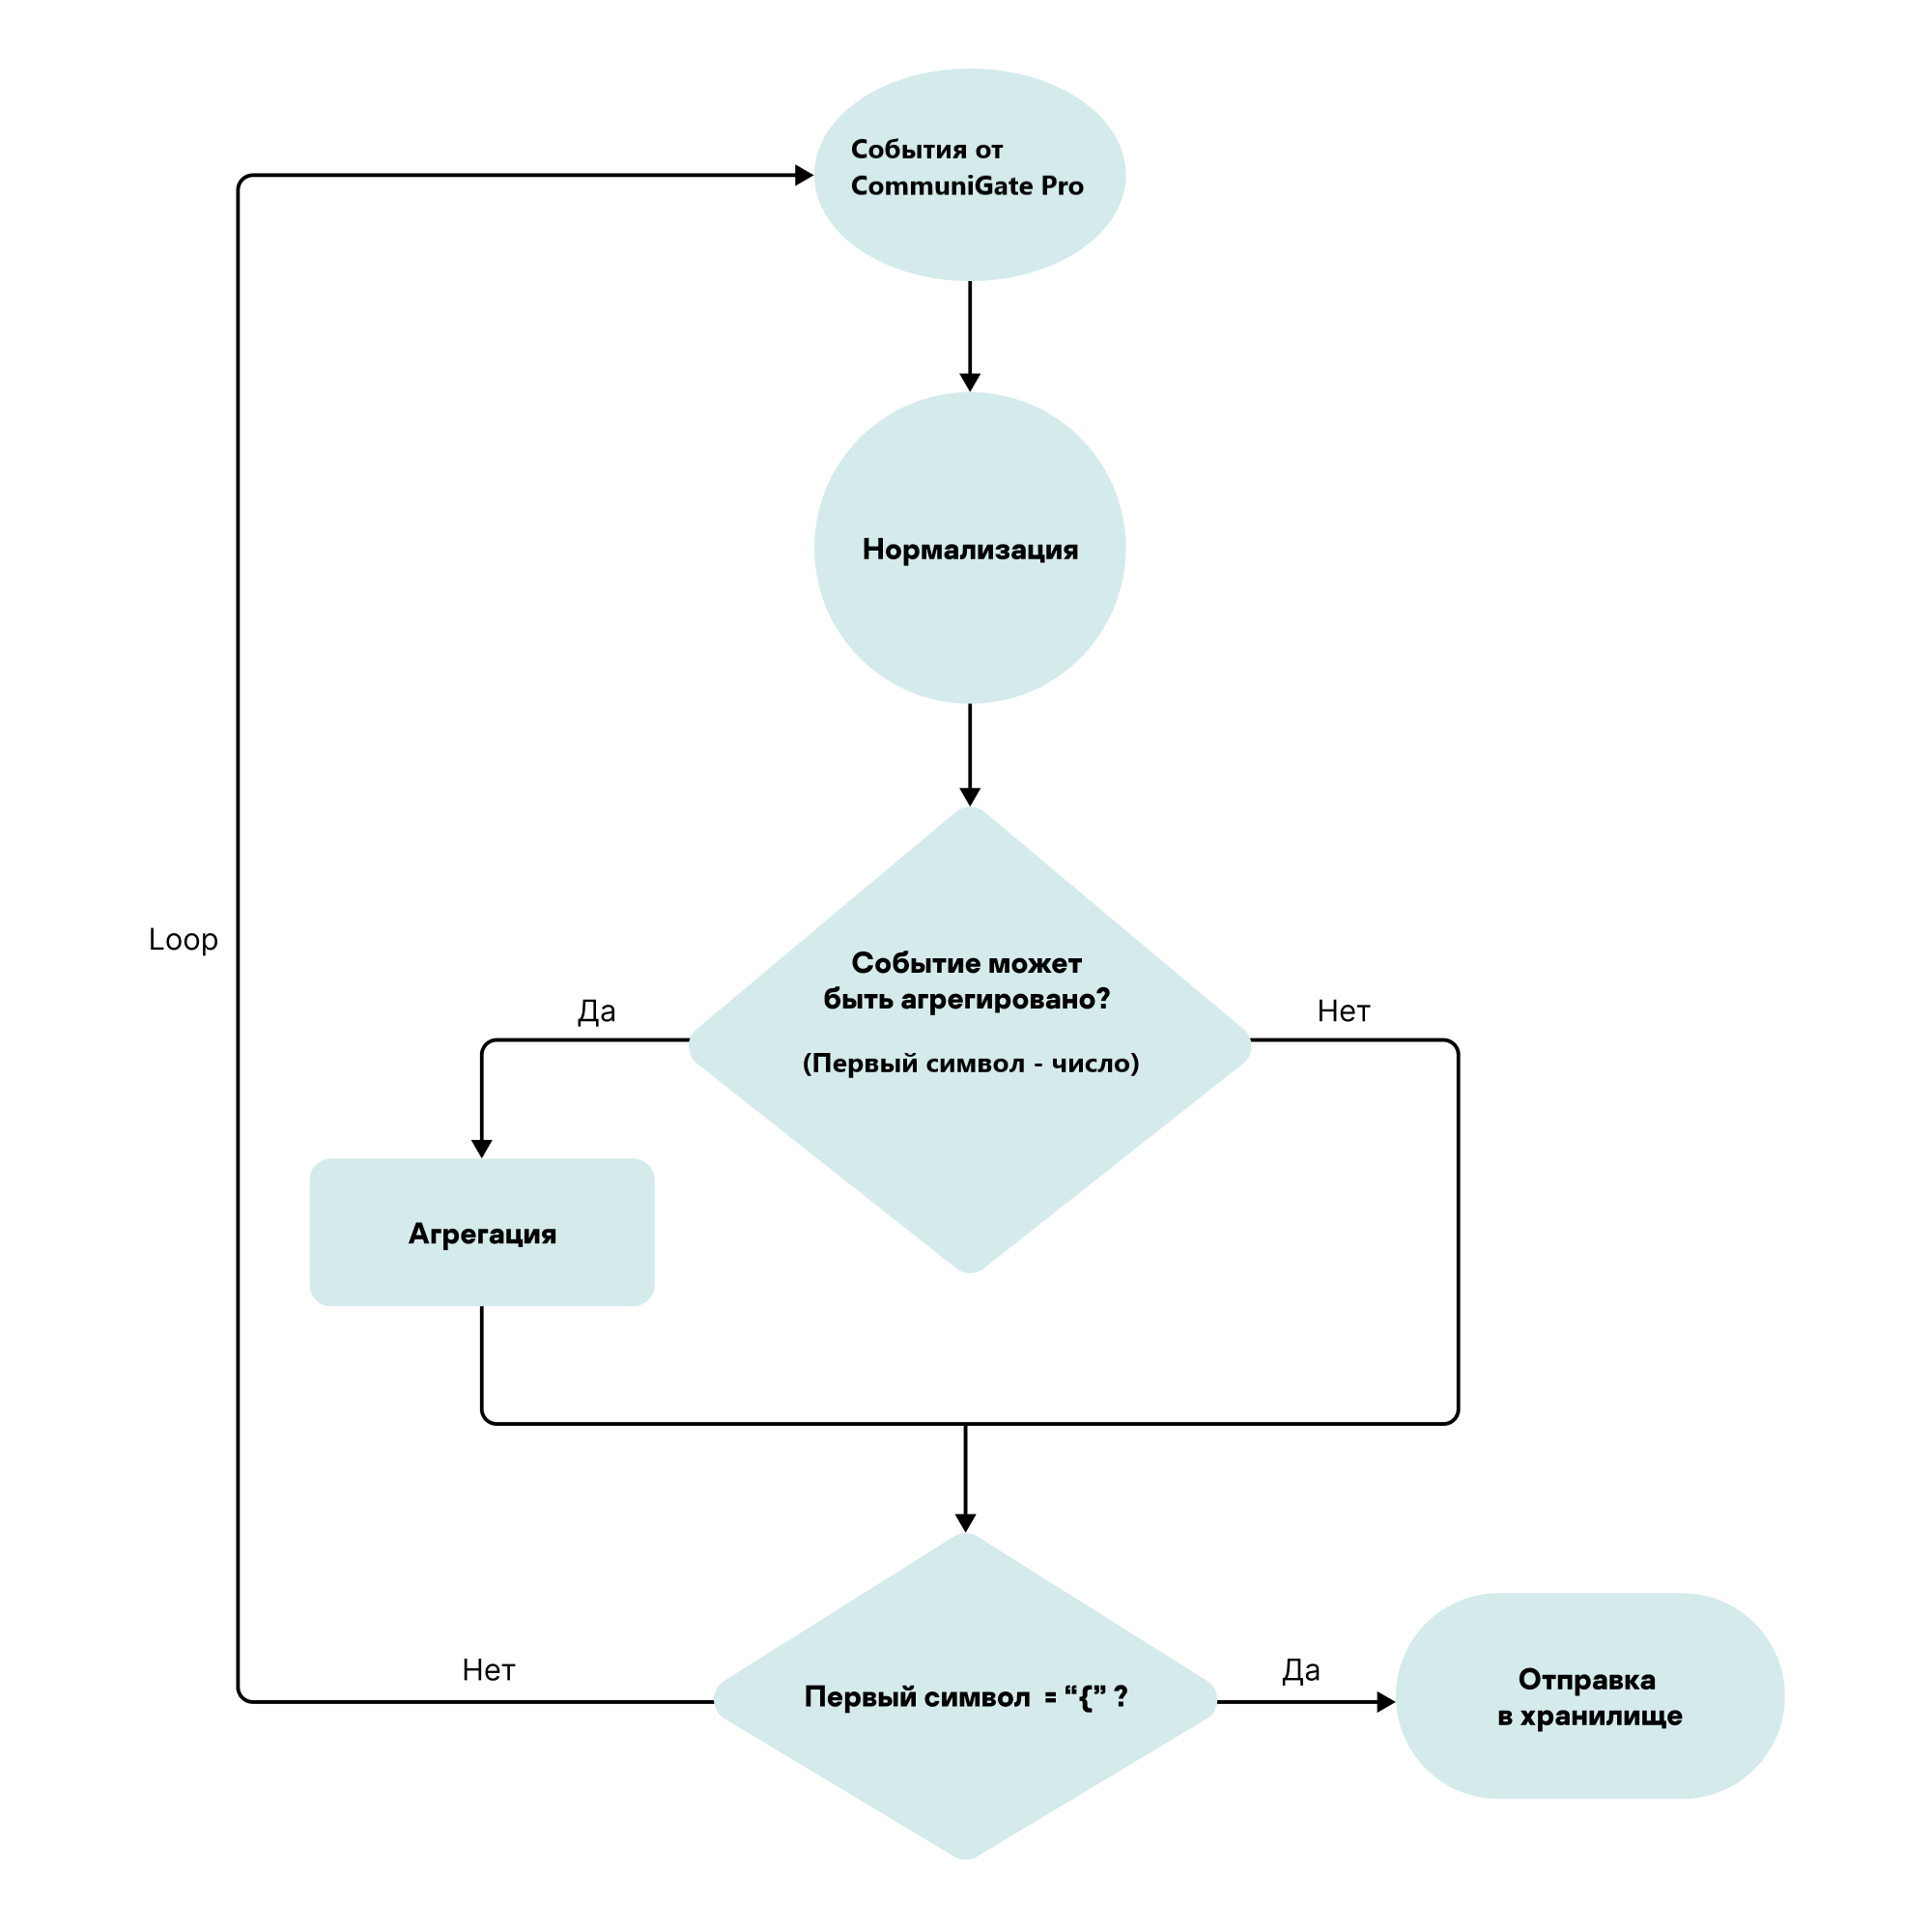
Configuring CommuniGate Pro to send events
By default, CommuniGate Pro audit events are sent to .log files in the /var/CommuniGate/SystemLogs/ directory.
To send events to KUMA, you need to install the KUMA agent on the CommuniGate Pro server and configure it to read .log in the /var/CommuniGate/SystemLogs/ directory and send them to the KUMA collector over TCP.
To create an agent that will read and send events to KUMA:
- In the KUMA Console, go to Resources and services → Agents and click Add.
- This opens the Create agent window; in that window, on the Basic settings tab, in the Name field, specify the agent name.
- On the Config #1 tab, fill in the following fields:
- In the Connector group of settings on the Basic settings tab, set the following values for the connector:
- In the Name field, enter a name, for example, "CommuniGate file".
- In the Type drop-down list, select file.
- In the File path field, enter the following value:
/var/CommuniGate/SystemLogs/.*.log
- In the Destinations group of settings on the Basic settings tab, set the following values for the destination:
- In the Name field, enter a name, for example, "CommuniGate TCP collector".
- In the Type drop-down list, select tcp.
- In the URL field, enter the FQDN or IP address and port of the KUMA collector.
- In the Connector group of settings on the Basic settings tab, set the following values for the connector:
- Click the Create button.
- When the agent service is created in KUMA, install the agent on the network infrastructure devices from which you want to send data to the collector.
Configuring a KUMA collector for receiving and processing CommuniGate Pro events
To configure a KUMA collector for receiving CommuniGate Pro events:
- Import the [OOTB] CommuniGate Pro package from the KUMA repository. The package is available for KUMA 3.0 and newer versions.
- Create a new collector, and in the Collector Installation Wizard, configure the following:
- At the Transport step, in the Type field, select the tcp type, and in the URL field, specify the FQDN or IP address and port of the collector.
- At the Event parsing step, click Add event parsing, and in the displayed Basic event parsing window, in the Normalizer drop-down list, select the [OOTB] CommuniGate Pro normalizer.
- At the Event aggregation step, click Add aggregation rule, and in the displayed Event aggregation window, in the Aggregation rule drop-down list, select [OOTB] CommuniGate Pro. Aggregation rule.
- At the Routing step, click Add and in the displayed Create destination window, create three destination points one by one—the same collector with the name "Loop", a storage, and a correlator.
- Create a destination named "Loop" with the following parameters:
- On the Basic settings tab, in the Type drop-down list, select the tcp transport type; in the URL field, specify the FQDN or IP address and port of the collector that you specified before at step 2.1 of these instructions.
- On the Advanced settings tab, in the Filter drop-down list, select the [OOTB] CommuniGate Pro. Filter for event aggregation filter.
This configuration is necessary to send the aggregated event to the same collector for subsequent normalization.
- Create a correlator destination:
- On the Basic settings tab, in the Type drop-down list, select correlator and fill in the URL field.
- On the Advanced settings tab, in the Filter drop-down list, select the [OOTB] CommuniGate Pro. Aggregated events to storage and correlator filter.
- Create a storage destination:
- On the Basic settings tab, in the Type drop-down list, select storage and fill in the URL field.
- On the Advanced settings tab, in the Filter drop-down list, select the [OOTB] CommuniGate Pro. Aggregated events to storage and correlator filter.
This configuration is necessary to send the aggregated normalized event to storage and the correlator.
- Create a destination named "Loop" with the following parameters:
- Click the Create button.
The collector service is created with the settings specified in the KUMA Console. The command for installing the service on the server is displayed.
- Copy the collector installation command and run it on the relevant server.
The collector is configured to receive and process CommuniGate Pro events.
Page top
Configuring receipt of Yandex Cloud events
You can configure the receipt of Yandex Cloud events in KUMA. The normalizer supports processing configuration-level audit events stored in .json files.
Configuring event receiving consists of the following steps:
- Configuring audit of Yandex Cloud events.
- Configuring export of Yandex Cloud events.
- Configuring a KUMA collector for receiving and processing Yandex Cloud events.
To receive Yandex Cloud events in the KUMA Collector Installation Wizard:
- In the KUMA Collector Installation Wizard, at the Transport step, select the connector of the file type.
- In the URL field, enter
/var/log/yandex-cloud/<audit_trail_id>/*/*/*/*.json, where <audit_trail_id> is the ID of the audit. - At the Event parsing step, in the Normalizer field, select [OOTB] Yandex Cloud.
- Installing a collector in the KUMA network infrastructure.
- Verifying receipt of Yandex Cloud events in the KUMA collector
To verify that the Yandex Cloud event source server is configured correctly, you can search for related events.
Configuring audit of Yandex Cloud events
Configuring event export proceeds in stages:
- Preparing the environment for working with Yandex Cloud.
- Creating a bucket for audit logs.
- Creating an encryption key in the Key Management Service.
- Enabling bucket encryption.
- Creating service accounts.
- Creating a static key.
- Assigning roles to service accounts.
- Creating an audit trail.
Preparing the environment for working with Yandex Cloud.
To manage the configuration, you need Yandex Cloud CLI; install and initialize it.
Note: by default, audit is performed in the Yandex Cloud folder specified in the CLI profile. You can specify a different folder using the --folder-name or --folder-id parameter.
To configure the audit, you need an active billing account because a fee is charged for using the Yandex Cloud infrastructure.
To configure Yandex Cloud audit, you need an active billing account:
- Go to the management console, then log in to Yandex Cloud or register.
- On the Yandex Cloud Billing page, make sure that you have a billing account connected and that it has the ACTIVE or TRIAL_ACTIVE status. If you do not have a billing account, create one.
If you have an active billing account, you can create or select a Yandex Cloud folder in which your infrastructure will work, on the cloud page.
Creating a bucket for audit logs
To create a bucket:
- In the management console, go to the folder in which you want to create the bucket, for example, example-folder.
- Select the Object Storage service.
- Click Create bucket.
- On the bucket creation page:
- Enter the bucket name in accordance with the naming rules, for example kumabucket.
- If necessary, limit the maximum size of the bucket. Size 0 means no limit and is equivalent to the enabled No limit option.
- As the access type, select Restricted.
- Select the default storage class.
- Click Create bucket.
The bucket is created.
Creating an encryption key in the Key Management Service
To create an encryption key:
- In the management console, go to the example-folder folder.
- Select the Key Management Service.
- Click the Create key button and specify the following settings:
- Name (for example, kuma-kms).
- Encryption algorithm, AES-256.
- Keep default values for the rest of the settings.
- Click Create.
The encryption key is created.
Enabling bucket encryption
To enable bucket encryption:
- In the management console, go to the bucket you created earlier.
- In the left pane, select Encryption.
- In the KMS key field, select the kuma-kms key.
- Click Save.
Bucket encryption is enabled.
Creating service accounts
To create service accounts (a separate account for the trail and a separate account for the bucket):
- Create the sa-kuma service account:
- In the management console, go to the example-folder folder.
- In the upper part of the scree, go to the Service accounts tab.
- Click Create service account and enter the name of the service account, for example, sa-kuma, making sure the name complies with the naming rules:
- length: 3 to 63 characters
- may contain lower-case letters of the Latin alphabet, numerals, and hyphens
- the first character must be a letter, the last character may not be a hyphen
- Click Create.
- Create the sa-kuma-bucket service account:
- In the management console, go to the example-folder folder.
- In the upper part of the scree, go to the Service accounts tab.
- Click Create service account and enter the name of the service account, for example, sa-kuma-bucket, making sure the name complies with the naming rules:
- length: 3 to 63 characters
- may contain lower-case letters of the Latin alphabet, numerals, and hyphens
- the first character must be a letter, the last character may not be a hyphen
- Click Create.
The service accounts are created.
Creating a static key
You will need the key ID and the private key when mounting the bucket. You can create a key using the management console or the CLI.
To create a key using the management console:
- In the management console, go to the example-folder folder.
- In the upper part of the screen, go to the Service accounts tab.
- Select the sa-kuma-bucket service account and click the row with its name.
- In the upper panel, click Create new key.
- Select Create static access key.
- Enter a description for the key and click Create.
- Save the ID and the secret key.
The static access key is created. The key value will become unavailable when you close the dialog.
To create a key using the CLI:
- Create an access key for the sa-kuma-bucket service account:
yc iam access-key create --service-account-name sa-kuma-bucketResult:
access_key:id: aje*******k2uservice_account_id: aje*******usmcreated_at: "2022-09-22T14:37:51Z"key_id: 0n8*******0YQsecret: JyT*******zMP1 - Save the key_id and the key from the 'secret' value. You will not be able to get the key value again.
The access key is created.
Assigning roles to service accounts
To assign the audit-trails.viewer, storage.uploader, and kms.keys.encrypterDecrypter roles to the sa-kuma service account:
- In the CLI, assign the audit-trails.viewer role to the folder:
yc resource-manager folder add-access-binding \--role audit-trails.viewer \--id <folder_id> \--service-account-id <service_account_id>Where:
--roleis the assigned role.--idis the ID of the 'example-folder' folder.--service-account-idis the ID of the sa-kuma service account.
- Assign the storage.uploader role to the folder with the bucket:
yc resource-manager folder add-access-binding \--role storage.uploader \--id <folder_id> \--service-account-id <service_account_id>Where:
--roleis the assigned role.--idis the ID of the 'example-folder' folder.--service-account-idis the ID of the sa-kuma service account.
- Assign the kms.keys.encrypterDecrypter role to the kuma-kms encryption key:
yc kms symmetric-key add-access-binding \--role kms.keys.encrypterDecrypter \--id <key_id> \--service-account-id <service_account_id>Where:
--roleis the assigned role.--idis the ID of the kuma-kms KMS key.--service-account-idis the ID of the sa-kuma service account.
To assign the storage.viewer and kms.keys.encrypterDecrypter roles to the sa-kuma-bucket service account:
- In the CLI, assign the storage.viewer role to the folder:
yc resource-manager folder add-access-binding \--id <folder_id> \--role storage.viewer \--service-account-id <service_account_id>Where:
--idis the ID of the 'example-folder' folder.--roleis the assigned role.--service-account-idis the ID of the sa-kuma-bucket service account.
- Assign the kms.keys.encrypterDecrypter role to the kuma-kms encryption key:
yc kms symmetric-key add-access-binding \--role kms.keys.encrypterDecrypter \--id <key_id> \--service-account-id <service_account_id>Where:
--roleis the assigned role.--idis the ID of the kuma-kms KMS key.--service-account-idis the ID of the sa-kuma-bucket service account.
Creating an audit trail
To create an audit trail:
- In the management console, go to the example-folder folder.
- Select the Audit Trails service.
- Click Create trail and specify a name for the trail you are creating, for example, kuma-trail.
- In the Destination section, specify the parameters of the destination object:
- Destination: Object Storage.
- Bucket: The name of the bucket, for example kumabucket.
- Object prefix: Optional parameter used in the full name of the audit log file.
Use a prefix if you store audit logs and third-party data in the same bucket. Do not use the same prefix for logs and other objects in the bucket because this may cause logs and third-party objects to overwrite each other.
- Encryption key: specify the kuma-kms encryption key that the bucket is encrypted with.
- In the Service account section, select sa-kuma.
- In the Collecting management events section, specify the settings for collecting management events audit logs:
- Collecting events: Select Enabled.
- Resource: Select Folder.
- Folder: Does not require filling, contains the name of the current folder.
- In the Collecting data events, in the Collecting events field, select Disabled.
- Click Create.
Configuring export of Yandex Cloud events
The bucket must be mounted on the server on which the KUMA collector will be installed.
To mount the bucket:
- On the server, create a directory for the 'kuma' user:
sudo mkdir /home/kuma - On the server, create a file with a static access key for the sa-kuma-bucket service account and grant appropriate access permissions to the 'kuma' user:
sudo bash -c 'echo <access_key_ID>:<secret_access_key> > /home/kuma/.passwd-s3fs'sudo chmod 600 /home/kuma/.passwd-s3fssudo chown -R kuma:kuma /home/kuma - Install the s3fs package:
sudo apt install s3fs - Create a directory where the bucket must be mounted and grant permissions to the kuma user:
sudo mkdir /var/log/yandex-cloud/sudo chown kuma:kuma /var/log/yandex-cloud/ - Mount the bucket:
sudo s3fs kumabucket /var/log/yandex-cloud -o passwd_file=/home/kuma/.passwd-s3fs -o url=https://storage.yandexcloud.net -o use_path_request_style -o uid=$(id -u kuma) -o gid=$(id -g kuma)You can configure the bucket to be mounted at operating system startup by adding a line to /etc/fstab, for example:
s3fs#kumabucket /var/log/yandex-cloud fuse _netdev,uid=<kuma_uid>,gid=<kuma_gid>,use_path_request_style,url=https://storage.yandexcloud.net,passwd_file=/home/kuma/.passwd-s3fs 0 0Where:
<kuma_uid> is the ID of the 'kuma' operating system user.
<kuma_gid> is the ID of the 'kuma' group of operating system users.
To find out the kuma_uid and kuma_gid, run the following command in the console:
id kuma - Verify that the bucket is mounted:
sudo ls /var/log/yandex-cloud/If everything is configured correctly, the command returns <audit_trail_id>, where <audit_trail_id> is the audit trail ID.
Export of Yandex Cloud events is configured. Events will be located in directories in .json files:
/var/log/yandex-cloud/{audit_trail_id}/{year}/{month}/{day}/*.json
Page top
Configuring receipt of Microsoft 365 events
You can configure the receipt of events from the Microsoft 365 (Office 365) cloud solution in KUMA.
Configuring event receiving consists of the following steps:
- Configuring access to Office 365 management APIs using standard Microsoft methods
To receive events in KUMA, grant the necessary set of API permissions:
Microsoft.Graph
Directory.Read.All
Office 365 management API
ActivityFeed.Read
ActivityFeed.Read.Dlp
- Creating a KUMA collector
To receive Microsoft 365 events, create a collector with the following parameters:
- At the Transport step, specify the office365 connector type.
- At the Parsing events step, specify the [OOTB] Microsoft Office 365 json normalizer.
- Installing a collector in a KUMA network infrastructure
- Verifying receipt of Windows Microsoft 365 in the KUMA collector
To verify that the Microsoft 365 event source server is configured correctly, you can search for related events.
Source status
In KUMA, you can monitor the state of the sources of data received by collectors. There can be multiple sources of events on one server, and data from multiple sources can be received by one collector.
You can configure automatic identification of event sources using one of the following sets of fields:
- Custom set of fields. You can specify from 1 to 9 fields in the order you want. TenantID does not need to be specified separately, it is determined automatically.
- Apply default mapping — DeviceProduct, DeviceHostName, DeviceAddress, DeviceProcessName. The field order cannot be changed.
Sources are identified if the following fields in events are not empty: the DeviceProduct field, the DeviceAddress and/or DeviceHostname field, and the TenantID field (you do not need to specify the TenantID field, it is determined automatically). The DeviceProcessName field can be empty. If the DeviceProcessName field is not empty, and the other required fields are filled, a new source is identified.
Identification of event sources depending on non-empty event fields
DeviceProduct
DeviceHostName
DeviceAddress
DeviceProcessName
TenantID (determined automatically)
+
+
+
Source 1 identified
+
+
+
Source 2 identified
+
+
+
+
Source 3 identified
+
+
+
+
Source 4 identified
+
+
+
+
Source 5 identified
+
+
+
+
+
Source 6 identified
+
+
+
Source not identified
+
+
+
Source not identified
+
+
+
Source not identified
+
+
+
Source not identified
Only one set of fields is applied for the entire installation. When upgrading to a new KUMA version, the default set of fields is applied. Only a user with the General Administrator role can configure the set of fields for identifying an event source. After you save changes to the set of fields, previously identified event sources are deleted from the KUMA Console and from the database. If necessary, you can revert to using a set of fields to determine default event sources. For the edited settings to take effect and KUMA to begin identifying sources based on the new settings, you must restart the collectors.
To identify event sources:
- In the KUMA Console, go to the Source status section.
- This opens the Source status window; in that window, click the wrench button.
- This opens the Settings of event source detection window; in that window, in the Grouping fields for source detection drop-down list, select the event fields by which you want to identify event sources.
You can specify from 1 to 9 fields in the order you want. In a custom configuration, KUMA identifies sources in which the TenantID field is filled (you do not need to specify this field separately, it is determined automatically) and at least one field from the Identical fields for source identification is filled. For numeric fields, 0 is considered an empty value. If a single numeric field is selected for source identification, and the value of the numeric field is 0, the source is not detected.
After you save the modified set of fields, an audit event is created and all previously identified sources are deleted from the KUMA Console and from the database; assigned policies are disabled.
- If you want to go back to the list of fields for identifying the default event source, click Apply default mapping. The default field order cannot be changed. If you manually specify the fields in the wrong order, an error is displayed and the save settings button becomes unavailable. The correct default sequence of fields is DeviceProduct, DeviceHostName, DeviceAddress, DeviceProcessName. Minimum configuration for identifying event sources using the default set of events: non-empty values in the DeviceProduct field, the DeviceAddress and/or DeviceHostName field, and the TenantID field (TenantID is determined automatically).
- Click Save.
- Restart the collectors to apply the changes and begin identifying event sources by the specified list of fields.
Source identification is configured.
To view events that are associated with an event source:
- In the KUMA Console, go to the Source status section.
- This opens the List of event sources window; in that window, select your event source in the list, and in the Name column, expand the menu for the selected event source, click the Events for <number> days button.
KUMA takes you to the Events section, where you can view a list of events for the selected source over the last 5 minutes. Values of fields configured in the event source identification settings are automatically specified in the query. If necessary, in the Events section, you can change the time period in the query and click Run query again to view the queried data for the specified time period.
Limitations
- In a configuration with the default field set, KUMA registers the event source only if the raw event contains the DeviceProduct field and the DeviceAddress and/or DeviceHostName fields.
If the raw event does not contain the DeviceProduct field and the DeviceAddress and/or DeviceHostName fields, you can:
- Configure enrichment in the normalizer: on the Enrichment tab of the normalizer, select the Event data type, specify the Source field setting, and for the Target field, select the DeviceProduct + DeviceAddress and/or DeviceHostName and click OK.
- Use an enrichment rule: select the Event data source type, specify the Source field setting, and as the Target field, select DeviceProduct + DeviceAddress and/or DeviceHostName, then click Create. The created enrichment rule must be linked to the collector at the Event enrichment step.
KUMA will perform enrichment and register the event source.
- If KUMA receives events with identical values of the fields that identify the source, KUMA registers different sources if the following conditions are satisfied:
- The values of the required fields are identical, but different tenants are determined for the events.
- The values of the required fields are identical, but one of the events has an optional DeviceProcessName field specified.
- The values of the required fields are identical, but the data in these fields have different character case.
If you want KUMA to log such events under the same source, you can further configure the fields in the normalizer.
Lists of sources are generated in collectors, merged in the KUMA Core, and displayed in the program web interface under Source status on the List of event sources tab. Data is updated every minute.
The rate and number of incoming events serve as an important indicator of the state of the observed system. You can configure monitoring policies such that changes are tracked automatically and notifications are automatically created when indicators reach specific boundary values. Monitoring policies are displayed in the KUMA Console under Source status on the Monitoring policies tab.
When monitoring policies are triggered, monitoring events are created and include data about the source of events.
List of event sources
Sources of events are displayed in the table under Source status → List of event sources. One page can display up to 250 sources. You can sort the table by clicking the column heading of the relevant parameter and selecting Ascending or Descending.
You can use the Search field to search for event sources. The search is performed using regular expressions (RE2). You can also filter the table by the Status or Monitoring policy columns by clicking the heading of the relevant column and selecting the values that you want to display.
If necessary, you can configure the interval for updating data in the table. Available update periods: 1 minute, 5 minutes, 15 minutes, 30 minutes, 1 hour. The default value is No refresh. You may need to configure the update period to track changes made to the list of sources.
Viewing information about event sources
In the Source status → List of event sources section, information about event sources is displayed in the following columns:
- Status—status of the event source:
- Green—events are being received within the limits of the assigned monitoring policies.
- Red—the frequency or number of incoming events go beyond the boundaries defined in at least one assigned monitoring policy.
- Gray—monitoring policies have not been assigned to the source of events.
If the status is red, an event of the Monitoring type generated. The monitoring event is generated in the tenant that owns the event source and is sent to the storage of the Main tenant (the storage must already be deployed in the Main tenant). If you have access to the tenant of the event source and do not have access to the Main tenant, you can still search for monitoring events in the storage of the Main tenant; the monitoring events of the tenants available to you will be displayed for you. You can also configure notifications to be sent to an arbitrary email address.
The table can be filtered by status.
- Name—name of the event source. The name is generated automatically from the values of fields configured in the event source identification settings.
You can rename an event source in the table of event sources by hovering over its name and clicking the pencil
 icon. The name can contain no more than 128 Unicode characters.
 - Host name or IP address—name or IP address of the host from which the events originate if the DeviceHostName or DeviceAddress fields are specified in the event source identification settings.
- Monitoring policy—list of the monitoring policies assigned to the event source.
If you want to filter the list of event sources by applied monitoring policies, click the name of this column and select one or more monitoring policies. If necessary, you can find policies in the list using the Search field.
You can view information about all monitoring policies assigned to an event source by clicking the row of the source. This opens a window that displays the settings of monitoring policies, as well as the status of the source according to each policy. If several monitoring policies are assigned to the source, the red status in the table of sources in this window lets you identify the policy that was triggered. You can also see which policies are enabled and which are disabled, and when the disabled policies will be enabled again.
- Stream—frequency at which events are received from the event source. If only monitoring policies of the byCount type or monitoring policies of different types are assigned to the source, this value is displayed as the number of events. If only monitoring policies of the byEPS type are assigned to the source, or no policies are assigned, the value is displayed as the number of events per second.
- Tenant—the tenant that owns the events received from the event source.
Managing event sources
You can select one or more event sources by selecting the check boxes in the first column of the table. You can select multiple event sources at once for performing group operations by selecting the check box in the heading of the first column and selecting Select all or Select all in page. The Select all in page option applies only to event sources displayed in the list: if only 500 out of 1500 sources are displayed in the list, then group actions to download, enable or disable policies, or delete event sources are applied only to the selected 500 sources. If you want to perform an action on all sources in the table, select Select all.
If you select sources of events, the following buttons become available:
- The Enable policy button enables the monitoring policy for event sources. You must select policies in the displayed window to apply them.
- You can use the Disable policy to disable the monitoring policy for event sources. When disabling a policy, you must specify if want to disable the policy temporarily or forever.
- The Update policy button applies the monitoring policies that are enabled for the event sources, or change the monitoring policies that are already assigned. When a policy is updated, a task is started in the task manager.
This button becomes available after you change the monitoring policies assigned to event sources.
- You can click the Remove button to remove event sources from the table. The statistics on this source will also be removed. If a collector continues to receive data from the source, the event source will re-appear in the table but its old statistics will not be taken into account.
If you want to delete all event sources, but some time has passed since the table was last refreshed, sources added during this time may not be displayed in the table, but they will be deleted regardless.
If you delete more than 100,000 event sources to which a filter or search was applied, only the first 100,000 event sources will be deleted. You can select all filtered event sources again and delete them, and then repeat this until you have deleted all event sources that you intended to delete. You can delete over 100,000 event sources if no filters or searches are applied to them by selecting sources using the Select all button.
- You can click CSV to download the data of the selected event sources to a CSV file.
- You can click the Chart button to plot a chart of incoming events for the last seven days for the selected event sources. You can select up to five event sources
.
Downloading event source information to a CSV file
You can download information about one or more event sources and the monitoring policies applied to them to a CSV file in UTF-8 encoding. If multiple monitoring policies are applied to a source, in the file for that source, each monitoring policy and its parameters starts on a new line. For each monitoring policy applied to a source, the following parameters are exported to the file: Status, Name, Monitoring policy, Lower limit, Upper limit, Stream, Tenant.
To download event source information to a CSV file:
- In the KUMA Console, in the Source status → List of event sources section, select one or more event sources in the table by selecting the check boxes in the first column next to the relevant sources.
In the lower left part of the table, you can find the number of selected sources and the total number of sources in the table. You can select up to 150,000 event sources.
You can select several event sources by clicking the check box in the heading of the first column selecting one of the following options:
- Select all to select all event sources on all pages of the table. If you have used search to filter sources, this will select all sources that match the search query.
- Select all in page to select all event sources on the currently displayed page. If you have used search to filter sources, this will select all sources on the currently displayed page that match the search query.
- Click the CSV button in the upper part of the table.
Depending on the size of your browser window, the CSV button may be found in the additional menu that you can open by clicking on the icon with the three dots
 .
.A new event source export task is created in the task manager.
- Go to the Task manager section and find the created task.
When the file is ready, the Status column of the task displays the Completed status.
- Click the task type name and select Download from the drop-down list.
The CSV file with event source information is downloaded in accordance with your browser settings. The default file name is event-source-list.csv.
Viewing the dynamics of incoming events
You can examine the dynamics of events received from a source over the last seven days, taking into account the applied monitoring policies, in one of the following ways:
- View the graph for an individual event source.
- Plot a chart based on graphs for several (up to five) sources.
You can view the graph for a single event source in the KUMA Console in the Source status → List of event sources section by clicking the arrow icon ![]() in the row of the relevant event source. The graph of incoming events is displayed under the row of the source.
in the row of the relevant event source. The graph of incoming events is displayed under the row of the source.
The data in the graph is displayed as follows:
- The data is displayed for the days on which the events were received. The maximum period is seven days.
In the upper left corner above the graph, you can see the number of days, and in the upper right corner, the data display period. You can click the Events for <number> days button to go to the Events section and view the list of events for the selected source.
- The X-axis represents days, and the Y-axis represents the frequency of events (EPS).
- The lines represent the average, maximum, and minimum number of events for every 15-minute period during the last seven days.
If you want to view the number of events at a specific time, hover over a point on the graph. A tooltip is displayed with the average, maximum, and minimum event count at a specific date and time.
You can also plot a chart of incoming events based on graphs for several event sources, for example, if you need to compare the activity of event sources of the same type that should behave in a similar way, but in fact behave in different ways.
To plot a chart based on graphs for multiple event sources:
- In the KUMA Console, in the Source status → List of event sources section, select one or more event sources in the table by selecting the check boxes in the first column next to the relevant sources.
You can plot a chart for up to 5 event sources at the same time.
- Click the Chart button in the upper part of the table.
Depending on the size of your browser window, the Chart button may be found in the additional menu that you can open by clicking on the icon with the three dots
.The displayed Chart pane contains a chart of incoming events for all selected sources as well as a table that displays the current number of events, the maximum number of events, and the average number of events for each source, calculated based on the data from the chart. You can compare how the data for the selected sources relates to each other over time.
The data in the chart is displayed as follows:
- The data is displayed for the days on which the events were received. The maximum period is seven days.
In the upper right corner above the chart, you can see the data display period.
- The X-axis represents days, and the Y-axis represents the frequency of events (EPS).
- The lines in the chart represent the average number of incoming events from the selected event sources for every 15-minute interval during the last seven days.
You can hover over the chart to view the average number of events for each source at a specific time.
- The data is displayed for the days on which the events were received. The maximum period is seven days.
- If necessary, clear the check boxes in the table below the chart next to the event sources that you want to hide in the chart.
- If you want to display the diagram in more detail, click the two arrows
 icon to open the panel in full screen mode and zoom in on the diagram.
Monitoring policies
The rate and number of incoming events serve as an important indicator of the state of the system. For example, you can detect when there are too many events, too few, or none at all. Monitoring policies are designed to detect such situations. In a policy, you can specify a lower threshold, an optional upper threshold, and the way the events are counted: by frequency or by total number.
The policy must be applied to the event source. You can apply one or more monitoring policies to a source. After applying the policy, you can monitor the status of the source on the List of event sources tab.
Policies for monitoring the sources of events are displayed in the table under Source status → Monitoring policies. You can sort the table by clicking the column header of the relevant setting. The maximum size of the policy list is not limited.
In the Sources column, you can click the Show button to view all event sources to which the policy is applied. When you click this button, you are taken to the List of event sources section, and the table of sources is filtered by the selected policy.
Algorithm of monitoring policies
Monitoring policies are applied to an event source in accordance with the following algorithm:
- The event stream is counted at the collector.
- The KUMA Core server gets information about the stream from the collectors every 15 seconds.
- The obtained data is stored on the KUMA Core server in the Victoria Metrics time series database, and the data storage depth on the KUMA Core server is 15 days.
- An inventory of event sources is taken once per minute.
- The stream is counted separately for each event source in accordance with the following rules:
- If a monitoring policy is applied to the event source, the displayed maximum number of events is calculated in accordance with the currently applied monitoring policies for the time interval specified in the policy.
Depending on the policy type, the number of the event stream is counted as the number of events (for the byCount policy type) or as the number events per second (EPS, for the byEPS policy type). You can look up how the stream is counted for the applied policy in the Stream column on the List of event sources page.
- If no monitoring policy is applied to the event source, the number for the event stream corresponds to the last value.
- If a monitoring policy is applied to the event source, the displayed maximum number of events is calculated in accordance with the currently applied monitoring policies for the time interval specified in the policy.
- Once a minute, the application checks if any monitoring policies exist that must be applied to event sources or stopped according to the monitoring policy schedule.
- Once a minute, the stream of events is checked for compliance with policy settings.
If the event stream from the source crosses the thresholds specified in the monitoring policy, information about this is recorded in the following way:
- A notification about a monitoring policy getting triggered is sent to the email addresses specified in the policy. For each policy, you can also configure a notification template.
- A stream monitoring informational event of type
5(Type=5) is generated. The fields of the event are described in the table below.Fields of the monitoring event
Event field name
Field value
ID
Unique ID of the event.
Timestamp
Event time.
Type
Type of the audit event. For the audit event, the value is
5(monitoring).Name
Name of the monitoring policy.
DeviceProduct
KUMADeviceCustomString1
The value from the
valuefield in the notification. Displays the value of the metric for which the notification was sent.
The generated monitoring event is sent to the following resources:
- All storages of the Main tenant
- All correlators of the Main tenant
- All correlators of the tenant in which the event source is located
Adding a monitoring policy
To add a new monitoring policy:
- In the KUMA Console, under Source status → Monitoring policies, click Add policy and configure the monitoring policy in the displayed window:
- In the Policy name field, enter a unique name for the policy you are creating. The name must contain 1 to 128 Unicode characters.
We recommend choosing a name that reflects the configured schedule of the monitoring policy.
- In the Tenant drop-down list, select the tenant that will own the policy. Your tenant selection determines the specific sources of events that can covered by the monitoring policy.
- In the Type field, select one of the following monitoring policy types:
- by count—by the number of events over a certain period of time.
- by EPS—by the number of events per second (EPS) over a certain period of time. The average value over the entire period is calculated. You can additionally track spikes during specific periods.
- In the Count interval field, specify the period during which the monitoring policy must take into account the data from the monitoring source. You can use the drop-down list on the right to select a value in minutes, hours, or days. The maximum value is 14 days.
- If you selected the by EPS policy type, in the Control interval, minutes field, specify the control time interval (in minutes) within which the number of events must cross the threshold for the monitoring policy to trigger:
- If, during this time period, all checks (performed once per minute) find that the stream is crossing the threshold, the monitoring policy is triggered.
- If, during this time period, one of the checks (performed once per minute) finds that the stream is within the thresholds, the monitoring policy is not triggered, and the count of check results is reset.
If you do not specify the frequency of measurement, the monitoring policy is triggered immediately after the stream is found to cross the threshold.
- In the Lower limit and Upper limit fields, define the boundaries representing normal behavior. Deviations outside of these boundaries will trigger the monitoring policy, create an alert, and forward notifications.
The Lower limit setting is required.
- In the Evaluation interval field, specify the frequency with which the VMalert service will query VictoriaMetrics for policy data while the policy is being applied to the event source. You can use the drop-down list on the right to select a value in minutes, hours, or days. The default interval is 5 minutes.
When specifying the evaluation interval, keep in mind the policy schedule. For example, if you configured the policy to be applied once every few hours, we do not recommend configuring a short interval and causing excessive load on VictoriaMetrics.
- If necessary, in the Send notifications field, specify the email addresses to which notifications about the activation of the KUMA monitoring policy must be sent. To add an address, enter it in the field and press Enter or click Add. You can specify multiple email addresses.
To forward notifications, you must configure a connection to the SMTP server.
- In the Notification template drop-down list, select the template that you want to use for notifications. If necessary, click the Create new button to start creating a new notification template.
By default, the basic notification template is selected. You can reset the template selection and switch to the base template by clicking the X icon.
- In the Schedule section, configure how often you want to apply the monitoring policy to event sources. By default, the policy is applied every week, every day, from 00:00 to 23:59. To configure the monitoring policy schedule, do some of the following:
- If you want to apply the monitoring policy weekly on specific days of the week:
- Enable the Configure schedule by days of the week toggle switch.
- In the Days of the week drop-down list, select the days of the week on which you want the policy to be applied to the source.
If you want to clear the selection, click the X icon.
- In the Time field, specify the start and end time of the policy, with minute precision.
The policy applicability interval is inclusive of its bounds; for example, if the end time is set to 23:59, the policy will be applied until 23:59:59.999. The default interval is 00:00 to 23:59. The start time must be earlier than the end time.
- If you want to add another period, click the Add period button and repeat steps 'b' and 'c'.
You can add any number of periods.
- If you want to apply the monitoring policy weekly on specific calendar dates:
- Enable the Configure schedule by days of the month toggle switch.
- Click the Days of the month field and use the calendar to select the dates on which you want to apply the policy to the source. You can select a period of several days or an individual day. The start date of the period must be earlier than the end date of the period.
The dates are configured without a year value, so the policy will be applied annually on the specified days until you delete this period. If you want to clear the selection, click the X icon.
- In the Time field, specify the start and end time of the policy, with minute precision.
The policy applicability interval is inclusive of its bounds; for example, if the end time is set to 23:59, the policy will be applied until 23:59:59.999. The default interval is 00:00 to 23:59. The start time must be earlier than the end time.
- If you want to add another period, click the Add period button and repeat steps 'b' and 'c'.
You can add any number of periods.
If you applied a schedule by day of the week and by day of the month at the same time, the day-of-the-month policy is applied first.
- If you want to apply the monitoring policy weekly on specific days of the week:
- Click Add.
The monitoring policy will be added.
Editing monitoring policies
The Source status → Monitoring policies section displays the added monitoring policies and their settings that you specified when creating the policy. You can click a policy to display a sidebar with all of its settings. If necessary, you can edit the policy settings in this sidebar.
If a monitoring policy is applied to an event source, if you edit certain policy settings, you may need to update the policy to apply the changes. Every 30 minutes, KUMA checks if any monitoring policies require updating, and if that is the case, it automatically runs a task to update those monitoring policies. You can also run the update task manually by clicking the Update policy button at the top of the table. One task updates all policies that need updating.
The Update policy button becomes active only if some monitoring policies need updating. Information about whether the policy needs updating is displayed in the table of monitoring policies in the Policy update status as one of the following statuses:
- Update required if one of the following monitoring policy settings was edited, but the changes have not been applied to event sources:
- Policy name
- Type
- Lower limit
- Upper limit
- Count interval
- Control interval
- Evaluation interval
- Updated in any of the following cases:
- After editing the policy, the task to apply the policy was started, and the changes were applied to event sources.
- You have edited one of the following policy settings, which does not require starting the update task:
- Send notifications
- Notification template
- Schedule
In this case, the edited policy settings are applied to event sources after a minute. Changes of the Notification template setting are applied instantly.
- The modified monitoring policy is not applied to event sources.
The date and time when the policy was last applied to event sources is displayed in the Policy last applied column.
While the policy update task is running, the Update policy button is unavailable for all users. If another user has edited the settings of the policy that necessitate an update, the Update policy button becomes active for you only after you refresh the page or edit the policy or an event source.
Applying monitoring policies
To apply monitoring policies to event sources:
- In the KUMA Console, in the Source status → List of event sources section, select one or more event sources in the table by selecting the check boxes in the first column next to the relevant sources. You can select several event sources by clicking the check box in the heading of the first column and selecting one of the following options:
- Select all to select all event sources on all pages of the table. If you have used search to filter sources, this will select all sources that match the search query.
- Select all in page to select all event sources that are loaded on the currently displayed page. If you have used search to filter sources, this will select all sources on the currently displayed page that match the search query.
In the lower left part of the table, you can find the number of selected sources and the total number of sources in the table.
After you select the event sources to which you want to apply the monitoring policy, the Enable policy button becomes available on the toolbar.
- Click Apply policy.
- This opens the Apply policy window; in that window, select one or more monitoring policies that you want to apply to the selected event sources. The table lists only monitoring policies that you can assign to the selected sources: policies that belong to the same tenant or to the Shared tenant, if you have access to it. If no shared policies exist for the selected event sources and you do not have access to the Shared tenant, the policy table is empty.
To select all available policies, you can select the check box in the heading of the first column. You can also use context search by policy name or sort the policies by clicking the heading of the column by which you want to sort the table and selecting Ascending or Descending.
Search and sorting is not available for the Sources, Schedule, Policy update status, Policy last applied columns.
- Click Apply.
- In the table of sources, click Update policy to apply the changes to event sources.
The monitoring policies are applied to the selected event sources; the status of these sources changes to green. The names of the policies applied to the sources are displayed in the Monitoring policy column. A message is also displayed indicating the number of sources to which the policies have been applied. If the monitoring policy is triggered for an event source, the new status of that source is displayed after you manually refresh the page or it is refreshed automatically. We recommend configuring an automatic data refresh period to keep track of changes in the list of sources.
If you have selected more than 100,000 event sources and applied one or more policies to them, these policies are applied only to the first 100,000 sources to which these policies have not yet been applied. If you need to apply policies to the remaining sources, you can do one of the following:
- Select all sources again and apply the policies to them.
- Filter the table of sources by any parameter so that the table displays less than 100,000 sources, then apply the policies to them.
Repeat the action until the policies have been applied to all the sources that you need.
Disabling monitoring policies
To disable monitoring policies for event sources:
- In the KUMA Console, in the Source status → List of event sources section, select one or more event sources in the table by selecting the check boxes in the first column next to the relevant sources.
In the lower left part of the table, you can find the number of selected sources and the total number of sources in the table. After you select the event sources to which monitoring policies are applied in the list, the Disable policy button becomes available on the toolbar.
You can select several event sources by clicking the check box in the heading of the first column selecting one of the following options:
- Select all to select all event sources on all pages of the table. If you have used search to filter sources, this will select all sources that match the search query.
- Select all in page to select all event sources that are loaded on the currently displayed page. If you have used search to filter sources, this will select all sources on the currently displayed page that match the search query.
- Click Disable policy.
- This opens the Disable policy window; in that window, select one or more monitoring policies that you want to disable for the selected event sources. The table lists all monitoring policies applied to at least one of the selected event sources.
To select all available policies, you can select the check box in the heading of the first column. You can also use context search or sort the policies by clicking the heading of the column by which you want to sort the table and selecting Ascending or Descending.
Search and sorting is not available for the Sources, Schedule, Policy update status, Policy last applied columns.
- In the settings section above the policy table, do one of the following:
- If you want to temporarily suspend the policies, select For the specified time and specify the time in minutes, hours, or days after which the selected policies will be reapplied to event sources. Maximum values:
- For days: 30
- For hours: 743
- For minutes: 44579
- If you want to permanently disable the selected policies for event sources, select Until manually enabled.
The default selection is For the specified time, and the value is set to 5 minutes.
- If you want to temporarily suspend the policies, select For the specified time and specify the time in minutes, hours, or days after which the selected policies will be reapplied to event sources. Maximum values:
- Click Disable.
- In the table of sources, click Update policy to apply the changes to event sources.
The monitoring policies are disabled for selected event sources or suspended for the specified time. The status of these sources in the table changes to gray. A message is displayed indicating the number of sources for which the policies have been disabled.
If you have selected more than 100,000 event sources and disabled one or more policies for them, these policies are disabled only for the first 100,000 sources to which these policies are applied. If you need to disable policies for the remaining sources, you can do one of the following:
- Select all sources again and disable the policies for them.
- Filter the table of sources by any parameter so that the table displays less than 100,000 sources, then disable the policies for them.
Repeat the action until the policies have been disabled for all the sources that you need.
Adding a new monitoring policy based on an existing policy
To create a new monitoring policy based on an existing policy:
- In the KUMA Console, in the Source status → Monitoring policies section, select the monitoring policy that you want to base the new policy on.
If necessary, you can find monitoring policies in the list using the Search field. The search will be carried out in the following columns: Name, Tenant, Type, Schedule (name of the day and time).
- Click Duplicate policy.
- This opens the Add policy window, in which you can edit policy settings.
By default, "- copy" is appended to the name of the new policy. The rest of the settings are the same as in the policy that you are duplicating.
- Click the Add button to create the new policy.
The monitoring policy is created based on an existing policy.
Deleting monitoring policies
To delete a monitoring policy:
- In the KUMA Console, in the Source status → Monitoring policies section, select one or more monitoring policies that you want to delete.
If necessary, you can find monitoring policies in the list using the Search field. The search will be carried out in the following columns: Name, Tenant, Type, Schedule (name of the day and time).
- Click Delete policy and confirm the action.
The selected monitoring policies are deleted.
You cannot remove predefined monitoring policies or policies that are assigned to data sources.
Page top
Managing assets
Assets represent the computers of the organization. After adding assets to KUMA, their IDs are added to enriched events, and, when analyzing events, you get additional information about your organization's computers.
You can view information about assets, search for assets by specified criteria, edit or delete assets, and export asset data to a CSV file.
Asset categories
You can categorize the assets and then use the categories in filter conditions or correlation rules. For example, you can create alerts of a higher severity level for assets from a higher-severity category. By default, all assets fall into the Uncategorized assets category. A device can be added to multiple categories.
By default, KUMA asset categories have the following severity levels: Low, Medium, High, Critical. You can create custom categories, categories can be nested.
Categories can be populated in the following ways:
- Manually
- Active: dynamic if the asset meets the specified conditions. For example, the moment the asset is upgraded to a specified OS version or placed in a specified subnet, the asset is moved to the specified category. If you specified a relative period and selected the frequency of categorization, for example, hourly, every time categorization starts, the condition will consider asset information that is up-to-date at the time of starting the categorization.
- Reactive—When a correlation rule is triggered, the asset is moved to the specified group.
In KUMA, assets are categorized by tenant and by category. Assets are arranged in a tree structure, where the tenants are located at the root, and the asset categories branch from them. You can view the tree of tenants and categories in the Assets → All assets section of the KUMA Console. When a tree node is selected, the assets assigned to it are displayed in the right part of the window. Assets from the subcategories of the selected category are displayed if you specify that you want to display assets recursively. You can select the check boxes next to the tenants whose assets you want to view.
To open the context menu of a category, hover the mouse cursor over the category and click the ellipsis icon that is displayed to the right of the category name. The following actions are available in the context menu:
Category context menu items
Action |
Description |
|---|---|
Show assets |
Display assets of the selected category in the right part of the window. |
Show assets recursively |
View assets from subcategories of the selected category. If you want to exit recursive viewing mode, select another category to view. |
Show info |
View information about the selected category in the Category information details area displayed in the right part of the web interface window. |
Start categorization |
Start automatic binding of assets to the selected category. This option is available for categories that have active categorization. |
Add subcategory |
Add a subcategory to the selected category. |
Edit category |
Edit the selected category. |
Delete category |
Delete the selected category. You can only delete categories that have no assets or subcategories. Otherwise the Delete category option is inactive. |
Pin as tab |
Display the selected category on a separate tab. You can undo this action by selecting Unpin as tab in the context menu of the relevant category. |
Adding an asset category
To add an asset category:
- Open the Assets section in the KUMA Console.
- Open the category creation window:
- Click the Add category button.
- If you want to create a subcategory, select Add subcategory in the context menu of the parent category.
The Add category details area appears in the right part of the web interface window.
- Add information about the category:
- In the Name field, enter the name of the category. The name must contain 1 to 128 Unicode characters.
- In the Parent field, indicate the position of the category within the categories tree hierarchy:
- Click the
 button.
This opens the Select categories window showing the categories tree. If you are creating a new category and not a subcategory, the window may show multiple asset category trees, one for each tenant that you can access. Your tenant selection in this window cannot be undone.
- Select the parent category for the category you are creating.
- Click Save.
Selected category appears in Parent fields.
- Click the
- The Tenant field displays the tenant whose structure contains your selected parent category. The tenant category cannot be changed.
- Assign a severity to the category in the Priority drop-down list.
- If necessary, in the Description field, you can add a note consisting of up to 256 Unicode characters.
- In the Categorization kind drop-down list, select how the category will be populated with assets. Depending on your selection, you may need to specify additional settings:
- Manually—assets can only be manually linked to a category.
- Active—assets will be assigned to a category at regular intervals if they satisfy the defined filter.
- Reactive—the category will be filled with assets by using correlation rules.
- Click Save.
The new category will be added to the asset categories tree.
Page top
Configuring the table of assets
In KUMA, you can configure the contents and order of columns displayed in the assets table. These settings are stored locally on your machine.
To configure the settings for displaying the assets table:
- Open the Assets section in the KUMA Console.
- Click the
 icon in the upper-right corner of the assets table.
 - In the drop-down list, select the check boxes next to the parameters that you want to view in the table:
- FQDN
- IP address
- Asset source
- Owner
- MAC address
- Created by
- Updated
- Tenant
- CII category
- Archived
- Status
- Score ML
When you select a check box, the assets table is updated and a new column is added. When a check box is cleared, the column disappears. The table can be sorted based on multiple columns.
- If you need to change the order of columns, click the left mouse button on the column name and drag it to the desired location in the table.
The assets table display settings are configured.
Page top
Searching assets
KUMA has two asset search modes. You can switch between the search modes using the buttons in the upper left part of the window:
 – simple search by the following asset settings: Name, FQDN, IP address, MAC address, and Owner.
 – advanced search for assets using filters by conditions and condition groups.
You can select the check boxes next to the found assets to export their data to a CSV file.
Simple search
To find an asset using simple search:
- In the Assets section of the KUMA Console, click the button.
The Search field is displayed at the top of the window.
- Enter your search query in the Search field and press ENTER or click the icon.
The table displays the assets with the Name, FQDN, IP address, MAC address, and Owner settings matching the search criteria.
Advanced search
To find an asset using advanced search:
- In the Assets section of the KUMA Console, click the button.
The asset filtering settings are displayed in the upper part of the window.
- Specify the asset filtering settings and click the Search button.
For details on asset filtering settings, see the table below.
The table displays the assets that meet the search criteria.
An advanced asset search is performed using the filtering conditions that can be specified in the upper part of the window:
- You can use the Add condition button to add a string containing fields for identifying the condition.
- You can use the Add group button to add a group of filters. Group operators can be switched between AND, OR, and NOT.
- Conditions and condition groups can be dragged with the mouse.
- Conditions, groups, and filters can be deleted by using the button.
- You can collapse the filtering options by clicking the Collapse button. In this case, the resulting search expression is displayed. Clicking it displays the search criteria in full again.
- The filtering options can be reset by clicking the Clear button.
- The condition operators and available values of the right operand depend on the selected left operand:
Left operand
Available operators
Right operand
Build number
=, ilike
An arbitrary value.
OS
=, ilike
An arbitrary value.
IP address
inSubnet, inRange
An arbitrary value or a range of values.
The filtering condition for the inSubnet operator is met if the IP address in the left operand is included in the subnet that is specified in the right operand. For example, the subnet for the IP address 10.80.16.206 should be specified in the right operand using slash notation as follows:
10.80.16.206/25.FQDN
=, ilike
An arbitrary value.
CVE
=, in
An arbitrary value.
CVSS
>, >=, =, <=, <
A number from 0 to 10 (possible severity levels of the asset's CVE vulnerability).
Not applicable to vulnerabilities from Open Single Management Platform.
CVE count
>, >=, =, <=, <
Number. The number of unique vulnerabilities with the CVE attribute for the asset. Vulnerabilities without CVEs do not count towards this figure.
For searching by the number of CVEs of a certain severity level, you can use a combined condition. For example:
CVE count >= 1
CVSS >= 6.5
Software
=, ilike
An arbitrary value.
Software version
=, ilike, in
An arbitrary value. Version (build) number of the software installed on the asset.
Asset source
in
- Open Single Management Platform.
- KICS/KATA.
- Created manually.
in
- Information resource is not a CII object.
- CII object without a significance category.
- CII object of the third category of significance.
- CII object of the second category of significance.
- CII object of the first category of significance.
RAM (bytes)
=, >, >=, <, <=
Number.
Number of disks
=, >, >=, <, <=
Number.
Number of network cards
=, >, >=, <, <=
Number.
Disk free bytes
=, >, >=, <, <=
Number.
KSC group
=, ilike
An arbitrary value. Name of the Open Single Management Platform administration group in which the asset is placed.
Anti-virus databases last updated
>=, <=
For search The time is specified as UTC time, and then converted in the KUMA interface to the local time zone set in the browser.
You can specify the date and time for this operand in one of the following ways:
- Select the exact date in the calendar.
- Select a period relative to the present time in the Relative period list.
- Enter a value manually: an exact date and time or a relative period, or a combination of both.
For details, see the Using time values subsection below.
Last update of the information
>=, <=
For search The time is specified as UTC time, and then converted in the KUMA interface to the local time zone set in the browser.
You can specify the date and time for this operand in one of the following ways:
- Select the exact date in the calendar.
- Select a period relative to the present time in the Relative period list.
- Enter a value manually: an exact date and time or a relative period, or a combination of both.
For details, see the Using time values subsection below.
Protection last updated
>=, <=
For search The time is specified as UTC time, and then converted in the KUMA interface to the local time zone set in the browser.
You can specify the date and time for this operand in one of the following ways:
- Select the exact date in the calendar.
- Select a period relative to the present time in the Relative period list.
- Enter a value manually: an exact date and time or a relative period, or a combination of both.
For details, see the Using time values subsection below.
System last started
>=, <=
For search The time is specified as UTC time, and then converted in the KUMA interface to the local time zone set in the browser.
You can specify the date and time for this operand in one of the following ways:
- Select the exact date in the calendar.
- Select a period relative to the present time in the Relative period list.
- Enter a value manually: an exact date and time or a relative period, or a combination of both.
For details, see the Using time values subsection below.
KSC extended status
in
- Host with Network Agent installed is online, but Network Agent is inactive.
- Anti-virus application is installed, but real-time protection is not running.
- Anti-virus application is installed but not running.
- Number of viruses detected is too high.
- Anti-virus application is installed but the real-time protection status differs from the one set by the security administrator.
- Anti-virus application is not installed.
- Full scan for viruses performed too long ago.
- Anti-virus bases were updated too long ago.
- Network Agent has been inactive too long.
- Old license.
- Number of uncured objects is too high.
- Reboot is required.
- One or more incompatible applications are installed on the host.
- Host has one or more vulnerabilities.
- Last search for operating system updates was performed too long ago on the host.
- The host does not have the proper encryption status.
- Mobile device settings do not meet the requirements of the security policy.
- There are unhandled incidents.
- Host status was suggested by the managed product (HSDP).
- Host is out of disk space, either synchronization errors occur, or disk space is running out.
Real-time protection status
=
- Suspended.
- Starting.
- Running (if anti-virus application does not support categories of state Running).
- Running with maximum protection.
- Running for maximum speed.
- Running with recommended settings.
- Running with custom settings.
- Error.
Encryption status
=
- Encryption rules are not configured on the host.
- Encryption is in progress.
- Encryption was canceled by the user.
- Encryption error occurred.
- All host encryption rules are met.
- Encryption is in progress, the host must be restarted.
- Encrypted files without specified encryption rules are detected on the host.
Spam protection status
=
- Unknown.
- Stopped.
- Suspended.
- Starting.
- Running.
- Error.
- Not installed.
- No license.
Anti-virus protection status of mail servers
=
- Unknown.
- Stopped.
- Suspended.
- Starting.
- Running.
- Error.
- Not installed.
- No license.
Data Leakage Prevention status
=
- Unknown.
- Stopped.
- Suspended.
- Starting.
Running.
- Error.
- Not installed.
- No license.
KSC extended status ID
=
- OK.
- Critical.
- Warning.
Endpoint Sensor status
=
- Unknown.
- Stopped.
- Suspended.
- Starting.
- Running.
- Error.
- Not installed.
- No license.
Last visible
>=, <=
For search The time is specified as UTC time, and then converted in the KUMA interface to the local time zone set in the browser.
You can specify the date and time for this operand in one of the following ways:
- Select the exact date in the calendar.
- Select a period relative to the present time in the Relative period list.
- Enter a value manually: an exact date and time or a relative period, or a combination of both.
For details, see the Using time values subsection below.
Score ML
=, >, >=, <, <=
Number. Asset score assigned by AI services.
Status
=, in
Asset status assigned by AI services:
- Low.
- Medium.
- High.
- Critical.
Custom asset field
=, ilike
An arbitrary value. Search custom fields of assets.
Using time values
Some conditions, for example, Anti-virus databases last updated or System last started, use date and time as the operand value. For these conditions, you can use an exact date and time or a relative period.
To specify a date and time value:
- Select an operand, an operator and click the date field.
- Do one of the following:
- Select the exact date in the calendar.
By default, the current time is automatically added to the selected date, with millisecond precision. Changing the date in the calendar does not change the specified time. The date and time are displayed in the time zone of the browser. If necessary, you can edit the date and time in the field.
- In the Relative period list, select a relative period.
The period is calculated relative to the start time of the current search and takes into account asset information that is up-to-date at that moment. For example, for the condition Anti-virus databases last updated, you can select 1 hour and the >= operator to find those assets for which the anti-virus databases have not been updated for more than 1 hour.
- In the date and time field, enter a value manually.
You can enter an exact date and time in the DD.MM.YYYY HH:mm:ss.SSS format for the Russian localization and YYYY-MM-DD HH:mm:ss.SSS for the English localization or a relative period as a formula. You can also combine these methods if necessary.
If you do not specify milliseconds when entering the exact date, 000 is substituted automatically.
In the relative period formulas, you can use the now parameter for the current date and time and the interval parameterization language: +, -, / (rounding to the nearest), as well as time units: y (year), M (month), w (week), d (day), h (hour), m (minute), s (second).
For example, for the Information last updated condition, you can specify the value now-2d with the operator >= operator and the value now-1d with the >= operator to find assets whose information was updated during the day before the search was started; alternatively, you can specify the value now/w with the <= operator to find assets whose information was updated between the beginning of the first day of the current week (00:00:00:000 UTC) and now.
KUMA stores time values in UTC, but in the user interface time is converted to the time zone of your browser. This is relevant to the relative periods: Today, Yesterday, This week, and This month. For example, if the time zone in your browser is UTC+3, and you select Today as the period, the category will cover assets from 03:00:00.000 until now, not from 00:00:00.000 until now.
If you want to take your time zone into account when selecting a relative period, such as Today, Yesterday, This week, or This month, you need to manually add a time offset in the date and time field by adding or subtracting the correct number of hours. For example, if your browser's time zone is UTC+3 and you want the categorization to cover the Yesterday period, you need to change the value to now-1d/d-3h. If you want the categorization to cover the Today period, change the value to now/d-3h.
- Select the exact date in the calendar.
Exporting asset data
You can export data about the assets displayed in the assets table as a CSV file.
To export asset data:
- Configure the assets table.
Only the data specified in the table is written to the file. The display order of the asset table columns is preserved in the exported file.
- Find the desired assets and select the check boxes next to them.
You can select all the assets in the table at a time by selecting the check box in the left part of the assets table header.
- Click the Export CSV button.
The asset data is written to the assets_<export date>_<export time>.csv file. The file is downloaded according to your browser settings.
Page top
Viewing asset details
To view information about an asset, open the asset information window in one of the following ways:
- In the KUMA Console, select Assets → select a category with the relevant assets → select an asset.
- In the KUMA Console, select Alerts → click the link with the relevant alert → select the asset in the Related endpoints section.
- In the KUMA Console, select Events → search and filter events → select the relevant event → click the link in one of the following fields: SourceAssetID, DestinationAssetID, or DeviceAssetID.
The following information may be displayed in the asset details window:
- Name—asset name.
Assets imported into KUMA retain the names that were assigned to them at the source. You can change these names in the KUMA Console.
- Tenant—the name of the tenant that owns the asset.
- Asset source—source of information about the asset. There may be several sources. For instance, information can be added in the KUMA Console or by using the API, or it can be imported from Open Single Management Platform, KICS/KATA, and MaxPatrol reports.
When using multiple sources to add information about the same asset to KUMA, you should take into account the rules for merging asset data.
- Created—date and time when the asset was added to KUMA.
- Updated—date and time when the asset information was most recently modified.
- Owner—owner of the asset, if provided.
- IP address—IP address of the asset (if any).
If there are several assets with identical IP addresses in KUMA, the asset that was added the latest is returned in all cases when assets are searched by IP address. If assets with identical IP addresses can coexist in your organization's network, plan accordingly and use additional attributes to identify the assets. For example, this may become important during correlation.
- FQDN—Fully Qualified Domain Name of the asset, if provided.
- MAC address—MAC address of the asset (if any).
- Operating system—operating system of the asset.
- Related alerts—alerts associated with the asset (if any).
To view the list of alerts related to an asset, click the Find in Alerts link. This opens the Alerts tab with the search expression set to filter all assets with the corresponding asset ID.
- Software info and Hardware info—if the asset software and hardware parameters are provided, they are displayed in this section.
- Asset vulnerability information:
- Open Single Management Platform vulnerabilities—vulnerabilities of the asset, if provided. This information is available for the assets imported from Open Single Management Platform.
You can learn more about the vulnerability by clicking the
 icon, which opens the Kaspersky Threats portal. You can also update the vulnerabilities list by clicking the Update link and requesting updated information from Open Single Management Platform.
 - KICS/KATA vulnerabilities—vulnerabilities of the asset, if any. This information is available for the assets imported from KICS/KATA.
- Open Single Management Platform vulnerabilities—vulnerabilities of the asset, if provided. This information is available for the assets imported from Open Single Management Platform.
- Asset source information:
- Last visible—time when information about the asset was last received from Open Single Management Platform. This information is available for the assets imported from Open Single Management Platform.
- Host ID—ID of the Open Single Management Platform Network Agent from which the asset information was received. This information is available for the assets imported from Open Single Management Platform. This ID is used to determine the uniqueness of the asset in Open Single Management Platform.
- KICS/KATA server IP address and KICS/KATA connector ID—data on the KICS/KATA instance from which the asset was imported.
- Custom fields—data written to the asset custom fields.
- Additional information about the protection settings of an asset with Kaspersky Endpoint Security for Windows or Kaspersky Endpoint Security for Linux installed:
- KSC extended status ID – asset status. It can have the following values:
- OK
- Critical
- Warning
- KSC extended status – information about the asset status. For example, "The anti-virus databases were updated too long ago".
- Real-time protection status – status of Kaspersky applications installed on the asset. For example: "Running (if the anti-virus application does not support the Running status categories)".
- Encryption status – information about asset encryption. For example: "Encryption rules are not configured on the host".
- Spam protection status – status of anti-spam protection. For example, "Started".
- Anti-virus protection status of mail servers – status of the virus protection of mail servers. For example, "Started".
- Data Leakage Prevention status – status of data leak protection. For example, "Started".
- Endpoint Sensor status – status of data leak protection. For example, "Started".
- Anti-virus databases last updated – the version of the downloaded anti-virus databases.
- Protection last updated – the time when the anti-virus databases were last updated.
- System last started – the time when the system was last started.
This information is displayed if the asset was imported from Open Single Management Platform.
- KSC extended status ID – asset status. It can have the following values:
- Categories—categories associated with the asset (if any).
- CII category—information about whether an asset is a critical information infrastructure (CII) object.
By clicking the Move to KSC group button, you can move the asset that you are viewing between Open Single Management Platform administration groups. You can also click the Start task drop-down list to run tasks available on the asset:
- By clicking the KSC response button, you can start a Open Single Management Platform task on the asset.
- By clicking the KEDR response button, you can run a Kaspersky Endpoint Detection and Response task on the asset.
- By clicking the Refresh KSC asset button, you can run a task to refresh information about the asset from Open Single Management Platform.
The tasks are available when integrated with Open Single Management Platform and when integrated with Kaspersky Endpoint Detection and Response.
Page top
Adding assets
You can add asset information to KUMA in the following ways:
- Manually.
You can add an asset using the KUMA Console or the API. In this case, you must manually specify the following information: address, FQDN, name and version of the operating system, hardware information. Information about the vulnerabilities of assets cannot be added through the web interface. You can provide information about vulnerabilities if you add assets using the API.
- Import assets.
You can import assets from Open Single Management Platform, KICS/KATA, and MaxPatrol reports.
- Import assets.
When adding assets, assets that already exist in KUMA can be merged with the assets being added.
Asset merging algorithm:
- Checking the uniqueness of assets in Open Single Management Platform or KICS/KATA assets.
- The uniqueness of an asset imported from Open Single Management Platform is determined by the Host ID parameter, which contains the Open Single Management Platform Network Agent Network Agent identifier. If two assets' IDs differ, they are considered to be separate assets and are not merged.
- The uniqueness of an asset imported from KICS/KATA is determined by the combination of the IP address, KICS/KATA server IP address, and KICS/KATA connector ID parameters. If any of the parameters of two assets differ they are considered to be separate assets and are not merged.
If the compared assets match, the algorithm is performed further.
- Make sure that the values in the IP, MAC, and FQDN fields match.
If at least two of the specified fields match, the assets are combined, provided that the other fields are blank.
Possible matches:
- The FQDN and IP address of the assets match. The MAC field is blank.
The check is performed against the entire array of IP address values. If the IP address of an asset is included in the FQDN, the values are considered to match.
- The FQDN and MAC address of the assets match. The IP field is blank.
The check is performed against the entire array of MAC address values. If at least one value of the array fully matches the FQDN, the values are considered to match.
- The IP address and MAC address of the assets match. The FQDN field is blank.
The check is performed against the entire array of IP- and MAC address values. If at least one value in the arrays is fully matched, the values are considered to match.
- The FQDN and IP address of the assets match. The MAC field is blank.
- Make sure that the values of at least one of the IP, MAC, or FQDN fields match, provided that the other two fields are not filled in for one or both assets.
Assets are merged if the values in the field match. For example, if the FQDN and IP address are specified for a KUMA asset, but only the IP address with the same value is specified for an imported asset, the fields match. In this case, the assets are merged.
For each field, verification is performed separately and ends on the first match.
You can see examples of asset field comparison here.
Information about assets can be generated from various sources. If the added asset and the KUMA asset contain data received from the same source, this data is overwritten. For example, a Open Single Management Platform asset receives a fully qualified domain name, software information, and host ID when imported into KUMA. When importing an asset from Open Single Management Platform with an equivalent fully qualified domain name, all this data will be overwritten (if it has been defined for the added asset). All fields in which the data can be refreshed are listed in the Updatable data table.
Updatable data
Field name |
Update procedure |
|---|---|
Name |
Selected according to the following priority:
|
Owner |
The first value from the sources is selected according to the following priority:
|
IP address |
The data is merged. If the array of addresses contains identical addresses, the copy of the duplicate address is deleted. |
FQDN |
The first value from the sources is selected according to the following priority:
|
MAC address |
The data is merged. If the array of addresses contains identical addresses, one of the duplicate addresses is deleted. |
Operating system |
The first value from the sources is selected according to the following priority:
|
Vulnerabilities |
KUMA asset data is supplemented with information from the added assets. In the asset details, data is grouped by the name of the source. Vulnerabilities are eliminated for each source separately. |
Software info |
Data from KICS/KATA is always recorded (if available). For other sources, the first value is selected according to the following priority:
|
Hardware info |
The first value from the sources is selected according to the following priority:
|
The updated data is displayed in the asset details. You can view asset details in the KUMA Console.
This data may be overwritten when new assets are added. If the data used to generate asset information is not updated from sources for more than 30 days, the asset is deleted. The next time you add an asset from the same sources, a new asset is created.
If the KUMA Console is used to edit asset information that was received from Open Single Management Platform or KICS/KATA, you can edit the following asset information:
- Name.
- Category.
If asset information was added manually, you can edit the following asset data when editing these assets in the KUMA Console:
- Name.
- Name of the tenant that owns the asset.
- IP address.
- Fully qualified domain name.
- MAC address.
- Owner.
- Category.
- Operating system.
- Hardware info.
Asset data cannot be edited via the REST API. When importing from the REST API, the data is updated according to the rules for merging asset details provided above.
Adding asset information in the KUMA Console
To add an asset in the KUMA Console:
- In the Assets section of the KUMA Console, click the Add asset button.
The Add asset details area opens in the right part of the window.
- Enter the asset parameters:
- Asset name (required).
- Tenant (required).
- IP address and/or FQDN (required). You can specify multiple FQDNs separated by commas.
- MAC address.
- Owner.
- If required, assign one or multiple categories to the asset:
- Click the button.
Select categories window opens.
- Select the check boxes next to the categories that should be assigned to the asset. You can use the
 and
and  icons to expand or collapse the lists of categories.
 - Click Save.
The selected categories appear in the Categories fields.
- Click the
- If required, add information about the operating system installed on the asset in the Software section.
- If required, add information about asset hardware in the Hardware info section.
- Click Add.
The asset is created and displayed in the assets table in the category assigned to it or in the Uncategorized assets category.
Page top
Importing asset information and asset vulnerability information from Open Single Management Platform
All assets that are protected by Open Single Management Platform are registered in it. You can import into KUMA the information about assets or vulnerabilities of assets that Open Single Management Platform protects. To do so, you need to configure integration between the applications in advance.
In Open Single Management Platform integration settings, you can configure the frequency of automatic import of information about assets, and, if necessary, import assets manually. Importing assets manually does not affect the time of the next scheduled import. From the Open Single Management Platform database, KUMA imports information about devices with installed Open Single Management Platform Network Agent that has connected to Open Single Management Platform, that is, has a non-empty 'Connection time' field in the SQL database.
KUMA imports the following device information received from Open Single Management Platform Network Agents:
- Basic information about the asset: name, address, time of connection to Open Single Management Platform, hardware information, protection status, anti-virus database versions
- Information about asset attributes: vulnerabilities; software, including the operating system; owners of the asset
By default, basic asset information is imported every hour, and information about asset attributes is imported every 12 hours. Attribute information is imported only for existing assets, not for new or deleted assets.
If Open Single Management Platform encounters errors while running the import tasks, KUMA displays such errors. If basic asset information is not available in KUMA during the import of asset attribute information (for example, if the assets were deleted during the import), the task completes without errors, but the attribute information for these assets is not loaded.
KUMA provides the following ways of importing information about assets or asset vulnerabilities from KSC:
- Importing asset information and asset vulnerability information for assets of all KSC Servers.
- Importing asset information and asset vulnerability information for assets of an individual KSC Server.
Importing asset information from MaxPatrol
You can import asset information from the MaxPatrol system into KUMA.
You can use the following import arrangements:
- Importing from reports about scan results of network devices of the MaxPatrol 8 system.
The import is performed through the API by using the maxpatrol-tool. The tool is located in the /opt/kaspersky/kuma/utils directory.
- Importing data from MaxPatrol VM 1.1.
Data is imported via the API by using the kuma_pvtm utility. The archive containing the tool is located in the /opt/kaspersky/kuma/utils directory.
Imported assets are displayed in the KUMA Console in the Assets section. If necessary, you can edit the settings of assets.
Page top
Importing data from MaxPatrol reports
Importing asset information form a report is supported for MaxPatrol 8.
To import asset information from a MaxPatrol report:
- In MaxPatrol, generate a network asset scan report in XML file format and copy the report file to the KUMA Core server. For more details about scan tasks and output file formats, refer to the MaxPatrol documentation.
Data cannot be imported from reports in SIEM integration file format. The XML file format must be selected.
- Create a file with the token for accessing the KUMA REST API. For convenience, it is recommended to place it into the MaxPatrol report folder. The file must not contain anything except the token.
Requirements imposed on accounts for which the API token is generated:
- General administrator, Tenant administrator, Tier 2 analyst, or Tier 1 analyst role.
- Access to the tenant into which the assets will be imported.
- Permissions for using API requests GET /users/whoami and POST /api/v1/assets/import have been configured.
To import assets from MaxPatrol, it is recommended to create a separate user with the minimum necessary set of rights to use API requests.
- Copy the maxpatrol-tool to the server hosting the KUMA Core and make the tool's file executable by running the following command:
chmod +x <path to the maxpatrol-tool file on the server hosting the KUMA Core> - Run the maxpatrol-tool:
./maxpatrol-tool --kuma-rest <KUMA REST API server address and port> --token <path and name of API token file> --tenant <name of tenant where assets will reside> <path and name of MaxPatrol report file> --cert <path to the KUMA Core certificate file>You can download the Core certificate in the KUMA Console.
Example:
./maxpatrol-tool --kuma-rest example.kuma.com:7223 --token token.txt --tenant Main example.xml --cert /tmp/ca.certYou can use additional flags and commands for import operations. For example, the command
--verbose, -vwill display a full report on the received assets. A detailed description of the available flags and commands is provided in the table titled Flags and commands of maxpatrol-tool. You can also use the--helpcommand to view information on the available flags and commands.
The asset information will be imported from the MaxPatrol report to KUMA. The console displays information on the number of new and updated assets.
Example: inserted 2 assets; updated 1 asset; errors occurred: [] |
The tool works as follows when importing assets:
- KUMA overwrites the data of assets imported through the API, and deletes information about their resolved vulnerabilities.
- KUMA skips assets with invalid data. Error information is displayed when using the
--verboseflag. - If there are assets with identical IP addresses and fully qualified domain names (FQDN) in the same MaxPatrol report, these assets are merged. The information about their vulnerabilities and software is also merged into one asset.
When uploading assets from MaxPatrol, assets that have equivalent IP addresses and fully qualified domain names (FQDN) that were previously imported from Open Single Management Platform are overwritten.
To avoid this problem, you must configure range-based asset filtering by running the following command:
--ignore <IP address ranges> or -i <IP address ranges>Assets that satisfy the filtering criteria are not uploaded. For a description of this command, please refer to the table titled Flags and commands of maxpatrol-tool.
Flags and commands of maxpatrol-tool
Flags and commands |
Description |
|---|---|
|
Address (with the port) of KUMA Core server where assets will be imported. For example, Port 7223 is used for API requests by default. You can change the port if necessary. |
|
Path and name of the file containing the token used to access the REST API. This file must contain only the token. The account for which you are generating an API token must have the General administrator, Tenant administrator, Tier 2 administrator, or Tier 1 administrator role. |
|
Name of the KUMA tenant in which the assets from the MaxPatrol report will be imported. |
|
This command uses DNS to enrich IP addresses with FQDNs from the specified ranges if the FQDNs for these addresses were not already specified. Example: |
|
Address of the DNS server that the tool must contact to receive FQDN information. Example: |
|
Address ranges of assets that should be skipped during import. Example: |
|
Output of the complete report on received assets and any errors that occurred during the import process. |
|
Get reference information on the tool or a command. Examples:
|
|
Get information about the version of the maxpatrol-tool. |
|
Creation of an autocompletion script for the specified shell. |
|
Path to the KUMA Core certificate. By default, the certificate is located in the folder with the application installed: /opt/kaspersky/kuma/core/certificates/ca.cert. |
Examples:
./maxpatrol-tool --kuma-rest example.kuma.com:7223 --token token.txt --tenant Main example.xml --cert /example-directory/ca.cert– import assets to KUMA from MaxPatrol report example.xml../maxpatrol-tool help—get reference information on the tool.
Possible errors
Error message |
Description |
|---|---|
must provide path to xml file to import assets |
The path to the MaxPatrol report file was not specified. |
incorrect IP address format |
Invalid IP address format. This error may arise when incorrect IP ranges are indicated. |
no tenants match specified name |
No suitable tenants were found for the specified tenant name using the REST API. |
unexpected number of tenants (%v) match specified name. Tenants are: %v |
KUMA returned more than one tenant for the specified tenant name. |
could not parse file due to error: %w |
Error reading the XML file containing the MaxPatrol report. |
error decoding token: %w |
Error reading the API token file. |
error when importing files to KUMA: %w |
Error transferring asset information to KUMA. |
skipped asset with no FQDN and IP address |
One of the assets in the report did not have an FQDN or IP address. Information about this asset was not sent to KUMA. |
skipped asset with invalid FQDN: %v |
One of the assets in the report had an incorrect FQDN. Information about this asset was not sent to KUMA. |
skipped asset with invalid IP address: %v |
One of the assets in the report had an incorrect IP address. Information about this asset was not sent to KUMA. |
KUMA response: %v |
An error occurred with the specified report when importing asset information. |
unexpected status code %v |
An unexpected HTTP code was received when importing asset information from KUMA. |
Importing asset information from MaxPatrol VM
The KUMA distribution kit includes the kuma-ptvm utility, which consists of an executable file and a configuration file. The utility is supported on Windows and Linux operating systems. The utility allows you to connect to the MaxPatrol VM API to get data about devices and their attributes, including vulnerabilities, and also lets you edit asset data and import data using the KUMA API. Importing data is supported for MaxPatrol VM 2.6.
Configuring the import of asset information from MaxPatrol VM to KUMA proceeds in stages:
- Preparing KUMA and MaxPatrol VM.
You must create user accounts and a KUMA token for API operations.
- Creating a configuration file with data export and import settings.
- Importing asset data into KUMA using the kuma-ptvm utility:
- The data is exported from MaxPatrol VM and saved in the directory of the utility. Information for each tenant is saved to a separate file in JSON format.
If necessary, you can edit the received files.
- Information from files is imported into KUMA.
- The data is exported from MaxPatrol VM and saved in the directory of the utility. Information for each tenant is saved to a separate file in JSON format.
When re-importing existing assets, assets that already exist in KUMA are overwritten. In this way, fixed vulnerabilities are removed.
Known limitations
If the same IP address is specified for two assets with different FQDNs, KUMA imports such assets as two different assets; the assets are not combined.
If an asset has two softwares with the same data in the name, version, vendor fields, KUMA imports this data as one software, despite the different software installation paths in the asset.
If the FQDN of an asset contains a space or underscore ("_"), data for such assets is not imported into KUMA, and the log indicates that the assets were skipped during import.
If an error occurs during import, error details are logged and the import stops.
Preparatory actions
- Create a separate user account in KUMA and in MaxPatrol VM with the minimum necessary set of permissions to use API requests.
- Create user accounts for which you will lager generate an API token.
Requirements imposed on accounts for which the API token is generated:
- General administrator, Tenant administrator, Tier 2 analyst, or Tier 1 analyst role.
- Access to the tenant into which the assets will be imported.
- In the user account, under API access rights, the check box is selected for POST/api/v1/assets/import.
- Generate a token for access to the KUMA REST API.
Creating the configuration file
To create the configuration file:
- Go to the KUMA installer folder by executing the following command:
cd kuma-ansible-installer - Copy the kuma-ptvm-config-template.yaml template to create a configuration file named kuma-ptvm-config.yaml:
cp kuma-ptvm-config-template.yaml kuma-ptvm-config.yaml - Edit the settings in the kuma-ptvm-config.yaml configuration file.
- Save the changes to the file.
The configuration file will be created. Go to the Importing asset data step.
Importing asset data
To import asset information:
- If you want to import asset information from MaxPatrol VM into KUMA without intermediate verification of the exported data, run the kuma-ptvm utility with the following options:
kuma-ptvm --config <path to the kuma-ptvm-config.yaml file> --download --upload - If you want to check the correctness of data exported from MaxPatrol VM before importing it into KUMA:
- Run the kuma-ptvm utility with the following options:
kuma-ptvm --config <path to the kuma-ptvm-config.yaml file> --downloadFor each tenant specified in the configuration file, a separate file is created with a name of the form <KUMA tenant ID>.JSON. Also, during export, a 'tenants' file is created, containing a list of JSON files to be uploaded to KUMA. All files are saved in the utility's directory.
- Review the exported asset files and if necessary, make the following edits:
- Assign assets to their corresponding tenants.
- Manually transfer asset data from the 'default' tenant file to the files of the relevant tenants.
- In the 'tenants' file, edit the list of tenants whose assets you want to import into KUMA.
- Import asset information into KUMA:
kuma-ptvm --config <path to the kuma-ptvm-config.yaml file> --upload
To view information about the available commands of the utility, run the --help command.
- Run the kuma-ptvm utility with the following options:
The asset information is imported from MaxPatrol VM to KUMA. The console displays information on the number of new and updated assets.
Possible errors
When running the kuma-ptvm utility, the "tls: failed to verify certificate: x509: certificate is valid for localhost" error may be returned.
Solution.
- Issue a certificate in accordance with the MaxPatrol documentation. We recommend resolving the error in this way.
- Disable certificate validation.
To disable certificate validation, add the following line to the configuration file in the 'MaxPatrol settings' section:
ignore_server_cert: true
As a result, the utility is started without errors.
Page top
The table lists the settings that you can specify in the kuma-ptvm-config.yaml file.
Description of settings in the kuma-ptvm-config.yaml configuration file
Setting |
Description |
Values |
|---|---|---|
|
An optional setting in the 'General settings' group. Logging level. |
Available values:
Default setting: |
|
An optional setting in the 'General settings' group. Data for assets that have changed during the specified period is exported from MaxPatrol. |
No limitations apply. Default setting: 30d. |
|
Optional setting in the 'General settings' group. When exporting assets from MaxPatrol, check if the required fields for KUMA are filled. Do not export unverified assets from MaxPatrol. |
Available values:
Default setting: We recommend specifying |
|
Required setting in the 'KUMA settings' group. URL of the KUMA API server. For example, kuma-example.com:7223 |
- |
|
Required setting in the 'KUMA settings' group. KUMA API token. |
- |
|
Optional setting in the 'KUMA settings' group. Validation of the KUMA certificate. |
Available values:
This setting is not included in the configuration file template. You can manually add this setting with a true value, which will prevent the kuma-ptvm utility from validating the certificate at startup. |
|
Required setting in the 'MaxPatrol VM' group. URL of the MaxPatrol API server. |
- |
|
Required setting in the 'MaxPatrol VM' group. MaxPatrol API user name. |
- |
|
Required setting in the 'MaxPatrol VM' group. MaxPatrol API user password. |
- |
|
Required setting in the 'MaxPatrol VM settings' group. MaxPatrol API secret. |
- |
|
Optional setting in the 'MaxPatrol VM settings' group. Validation of the MaxPatrol certificate. |
Available values:
This setting is not included in the configuration file template. You can manually add this setting with a true value if the "tls: failed to verify certificate: x509: certificate is valid for localhost" error occurs. In that case, the kuma-ptvm utility does not validate the certificate when it is started. We recommend issuing a certificate in accordance with the MaxPatrol documentation as the preferred way of resolving the error. |
|
Optional setting in the 'Vulnerability filter' group. Export from MaxPatrol only assets with vulnerabilities for which exploits are known. |
Available values:
Default setting: |
|
Optional setting in the 'Vulnerability filter' group. Import only vulnerabilities of the specified level or higher. |
Available values:
Default value: |
|
Required setting in the 'Tenant map' group. Tenant ID in KUMA. Assets are assigned to tenants in the order in which tenants are specified in the configuration file: the higher a tenant is in the list, the higher its priority. This means you can specify overlapping subnets. |
- |
|
Optional setting in the 'Tenant map' group. Regular expression for searching the FQDN of an asset. |
- |
|
Optional setting in the 'Tenant map' group. One or more subnets. |
- |
|
Optional setting. The default KUMA tenant for data about assets that could not be allocated to tenants specified in the 'Tenants' group of settings. |
- |
Importing asset information from KICS for Networks
After configuring KICS for Networks integration, tasks to obtain data about KICS for Networks assets are created automatically. This occurs:
- Immediately after creating a new integration.
- Immediately after changing the settings of an existing integration.
- According to a regular schedule every several hours. Every 12 hours by default. The schedule can be changed.
Account data update tasks can be created manually.
To start a task to update KICS/KATA asset information for a tenant:
- In the KUMA Console, open the Settings → KICS/KATA section.
- Select the relevant tenant.
This opens the KICS/KATA server integration window.
- Click the Import assets button.
A task to receive account data from the selected tenant is added to the Task manager section of the KUMA Console.
Page top
Examples of asset field comparison during import
Each imported asset is compared to the matching KUMA asset.
Checking for two-field value match in the IP, MAC, and FQDN fields
Compared assets |
Compared fields |
||
|---|---|---|---|
FQDN |
IP |
MAC |
|
KUMA asset |
Filled in |
Filled in |
Empty |
Imported asset 1 |
Filled in, matching |
Filled in, matching |
Filled in |
Imported asset 2 |
Filled in, matching |
Filled in, matching |
Empty |
Imported asset 3 |
Filled in, matching |
Empty |
Filled in |
Imported asset 4 |
Empty |
Filled in, matching |
Filled in |
Imported asset 5 |
Filled in, matching |
Empty |
Empty |
Imported asset 6 |
Empty |
Empty |
Filled in |
Comparison results:
- Imported asset 1 and KUMA asset: the FQDN and IP fields are filled in and match, no conflict in the MAC fields between the two assets. The assets are merged.
- Imported asset 2 and KUMA asset: the FQDN and IP fields are filled in and match. The assets are merged.
- Imported asset 3 and KUMA asset: the FQDN and MAC fields are filled in and match, no conflict in the IP fields between the two assets. The assets are merged.
- Imported asset 4 and KUMA asset: the IP fields are filled in and match, no conflict in the FQDN and MAC fields between the two assets. The assets are merged.
- Imported asset 5 and KUMA asset: the FQDN fields are filled in and match, no conflict in the IP and MAC fields between the two assets. The assets are merged.
- Imported asset 6 and KUMA asset: no matching fields. The assets are not merged.
Checking for single-field value match in the IP, MAC, and FQDN fields
Compared assets |
Compared fields |
||
|---|---|---|---|
FQDN |
IP |
MAC |
|
KUMA asset |
Empty |
Filled in |
Empty |
Imported asset 1 |
Filled in |
Filled in, matching |
Yes |
Imported asset 2 |
Filled in |
Filled in, matching |
Empty |
Imported asset 3 |
Filled in |
Empty |
Filled in |
Imported asset 4 |
Empty |
Empty |
Filled in |
Comparison results:
- Imported asset 1 and KUMA asset: the IP fields are filled in and match, no conflict in the FQDN and MAC fields between the two assets. The assets are merged.
- Imported asset 2 and KUMA asset: the IP fields are filled in and match, no conflict in the FQDN and MAC fields between the two assets. The assets are merged.
- Imported asset 3 and KUMA asset: no matching fields. The assets are not merged.
- Imported asset 4 and KUMA asset: no matching fields. The assets are not merged.
Settings of the kuma-ptvm-config.yaml configuration file
The table lists the settings that you can specify in the kuma-ptvm-config.yaml file.
Setting |
Description |
Values |
|
An optional setting in the 'General settings' group. Logging level. |
Available values:
Default setting: |
|
An optional setting in the 'General settings' group. Data for assets that have changed during the specified period is exported from MaxPatrol. |
No limitations apply. Default setting: 30d. |
|
Optional setting in the 'General settings' group. When exporting assets from MaxPatrol, check if the required fields for KUMA are filled. Do not export unverified assets from MaxPatrol. |
Available values:
Default setting: We recommend specifying true when exporting assets from MaxPatrol, this lets you detect and fix possible errors in JSON files before you import assets into XDR. |
|
Required setting in the 'KUMA settings' group. URL of the XDR API server. For example, |
- |
|
Required setting in the 'KUMA settings' group. XDR API token. |
- |
|
Optional setting in the 'KUMA settings' group. Validation of the XDR certificate. |
Available values:
This setting is not included in the configuration file template. You can manually add this setting with a true value, which will prevent the kuma-ptvm utility from validating the certificate at startup. |
|
Required setting in the 'MaxPatrol VM' group. URL of the MaxPatrol API server. |
- |
|
Required setting in the 'MaxPatrol VM' group. MaxPatrol API user name. |
- |
|
Required setting in the 'MaxPatrol VM' group. MaxPatrol API user password. |
- |
|
Required setting in the 'MaxPatrol VM settings' group. MaxPatrol API secret. |
- |
|
Optional setting in the 'MaxPatrol VM settings' group. Validation of the MaxPatrol certificate. |
Available values:
This setting is not included in the configuration file template. You can manually add this setting with a We recommend issuing a certificate in accordance with the MaxPatrol documentation as the preferred way of resolving the error. |
|
Optional setting in the 'Vulnerability filter' group. Export from MaxPatrol only assets with vulnerabilities for which exploits are known. |
Available values:
Default setting: |
|
Optional setting in the 'Vulnerability filter' group. Import only vulnerabilities of the specified level or higher. |
Available values:
Default value: |
|
Required setting in the 'Tenant map' group. Tenant ID in XDR. Assets are assigned to tenants in the order in which tenants are specified in the configuration file: the higher a tenant is in the list, the higher its priority. This means you can specify overlapping subnets. |
- |
|
Optional setting in the 'Tenant map' group. Regular expression for searching the FQDN of an asset. |
- |
|
Optional setting in the 'Tenant map' group. One or more subnets. |
- |
|
Optional setting. The default XDR tenant for data about assets that could not be allocated to tenants specified in the 'Tenants' group of settings. |
- |
Assigning a category to an asset
To assign a category to one asset:
- In the KUMA Console, go to the Assets section.
- Select the category with the relevant assets.
The assets table is displayed.
- Select an asset.
- In the opened window, click the Edit button.
- In the Categories field, click the button.
- Select a category.
If you want to move an asset to the Uncategorized assets section, you must delete the existing categories for the asset by clicking the
button. - Click the Save button.
The category will be assigned.
To assign a category to multiple assets:
- In the KUMA Console, go to the Assets section.
- Select the category with the relevant assets.
The assets table is displayed.
- Select the check boxes next to the assets for which you want to change the category.
- Click the Link to category button.
- In the opened window, select a category.
- Click the Save button.
The category will be assigned.
Do not assign the Categorized assets category to assets.
Linking a group of assets to a category
To link a group of assets to a category:
- In the Assets section of the KUMA Console, select the check box in the heading of the table of assets.
- Select all assets visible on the page or all assets that match the selection condition.
The Link to category button becomes active and opens the available categories.
- Click the Link to category button and select one or more categories to link to.
- Click OK.
Assets are linked to the selected categories or folder.
Unlinking a group of assets from a category
To unlink a group of assets from a category:
- Select one category (tenant) in the navigation pane.
The list of assets in that category is displayed.
The Clean category button is added to the folder properties.
- In the context menu of the category, select Clean category.
A dialog box is displayed with a confirmation prompt and the number of assets that will be unlinked.
This option lets you unlink all assets in the selected category, not only those that are visible on the page. Assets in child categories are not unlinked.
- In the dialog box, click OK.
All selected assets aer unlinked from the selected category.
Editing the parameters of assets
In KUMA, you can edit asset parameters. All the parameters of manually added assets can be edited. For assets imported from Open Single Management Platform, you can only change the name of the asset and its category.
To change the parameters of an asset:
- In the Assets section of the KUMA Console, click the asset that you want to edit.
The Asset details area opens in the right part of the window.
- Click the Edit button.
The Edit asset window opens.
- Make the changes you need in the available fields:
- Asset name (required) This is the only field available for editing if the asset was imported from Open Single Management Platform or KICS/KATA.
- IP address and/or FQDN (required). You can specify multiple FQDNs separated by commas.
- MAC address
- Owner
- Software info:
- OS name
- OS build
- Hardware info:
- Custom fields.
- CII category.
- Assign or change the category of the asset:
- Click the button.
Select categories window opens.
- Select the check boxes next to the categories that should be assigned to the asset.
- Click Save.
The selected categories appear in the Categories fields.
You can also select the asset and then drag and drop it into the relevant category. This category will be added to the list of asset categories.
Do not assign the
Categorized assetscategory to assets. - Click the
- Click the Save button.
Asset parameters have been changed.
Page top
Archiving assets
In KUMA, the archival functionality is available for the following types of assets:
- For assets imported from KSC and KICS.
If KUMA did not receive information about the asset, at the time of import, the asset is automatically archived and is stored in the database for the time specified in the Archived assets retention period setting. The default setting is 0 days. This means that archived assets are stored indefinitely. An archived asset becomes active if KUMA receives information about the asset from the source before the retention period for archived assets expires.
- Combined assets
When importing, KUMA performs a check for uniqueness among assets imported from KSC and KICS, and among manually added assets. If the fields of an imported asset and a manually added asset match, the assets are combined into a single asset, which is considered imported and can become archived.
Assets added manually in the console or using the API are not archived.
An asset becomes archived under the following conditions:
- KUMA did not receive information about the asset from Open Single Management Platform or KICS/KATA.
- Disabled integration with Open Single Management Platform.
If you disable integration with Open Single Management Platform, the asset is considered active for 30 days. After 30 days, the asset is automatically archived and is stored in the database for the time specified in the Archived assets retention period.
An asset is not updated in the following cases:
- Information about the Open Single Management Platform asset has not been updated for more than the retention period of archived assets.
- Information about the asset does not exist in Open Single Management Platform or KICS/KATA.
- Connection with the Open Single Management Platform server has not been established for more than 30 days.
Archived assets that participate in dynamic categorization remain archived. An archived asset can have its CII category assigned or changed. If such an asset ends up in an alert or incident, the CII category of the alert or incident also changes, which may affect the visibility of the alert or incident for users with restricted CII access.
To configure the archived assets retention period:
- In the KUMA Console, select the Settings → Assets section.
This opens the Assets window.
- Enter the new value in the Archived assets retention period field.
The default setting is 0 days. This means that archived assets are stored indefinitely.
- Click Save.
The retention period for archived assets is configured.
Information about the archived asset remains available for viewing in the alert and incident card.
To view an archived asset card:
- In the KUMA Console, select the Alerts or Incidents section.
A list of alerts or incidents is displayed.
- Open the alert or incident card linked to the archived asset.
You can view the information in the archived asset card.
Deleting assets
If you no longer need to receive information from an asset or information about the asset has not been updated for a long time, you can have KUMA delete the asset. Deletion can be performed by the General administrator, Tenant administrator, Tier 2 analysts, and Tier 1 analysts. If an asset was deleted, but KUMA once again begins receiving information about that asset from Open Single Management Platform, KUMA recreates the asset with a new ID.
In KUMA, you can delete assets in the following ways:
- Automatically.
KUMA automatically deletes only archived assets. KUMA deletes an archived asset if the information about the asset has not been updated for longer than the retention period of archived assets.
- Manually.
To delete an asset manually:
- In KUMA Console, in the Assets section, click the asset that you want to delete.
This opens the Asset information window in the right-hand part of the web interface.
- Click the Delete button.
A confirmation window opens.
- Click OK.
The asset is deleted and no longer appears in the alert or incident card.
Page top
Bulk deletion of assets
In the KUMA Console, you can select multiple assets using a filter and delete all selected assets.
To delete assets, you must have rights to delete assets.
Bulk deletion of assets
To delete all selected assets:
- In the Assets section of the KUMA Console, select the category that contains the relevant assets.
A table of assets is displayed.
- Select the check box in the heading of the table of assets.
You can delete all assets or all assets currently displayed on the page.
- Click Select all in page or Select all.
The Delete button becomes active.
- Click the Delete button.
This opens a window prompting you to confirm deletion and telling you that deleted assets will not be available in alerts, incidents, and widgets.
In the lower part of the page, the number of assets selected for deletion is displayed.
- Click OK.
If you clicked Select all, you must enter the displayed generated string into the text box in the window to confirm deletion.
All selected assets are deleted.
Deleting asset folders
To delete a folder, you can either unlink all assets from the folder (which unlinks the assets but not does not delete them) and then delete the folder itself, or delete all assets and then delete the folder.
Page top
Updating third-party applications and fixing vulnerabilities on Open Single Management Platform assets
You can update third-party applications (including Microsoft applications) that are installed on Open Single Management Platform assets, and fix vulnerabilities in these applications.
First you need to create the Install required updates and fix vulnerabilities task on the selected Open Single Management Platform Administration Server with the following settings:
- Application—Open Single Management Platform.
- Task type—Install required updates and fix vulnerabilities.
- Devices to which the task will be assigned—you need to assign the task to the root administration group.
- Rules for installing updates:
- Install approved updates only.
- Fix vulnerabilities with a severity level equal to or higher than (optional setting).
If this setting is enabled, updates fix only those vulnerabilities for which the severity level set by Kaspersky is equal to or higher than the value selected in the list (Medium, High, or Critical). Vulnerabilities with a severity level lower than the selected value are not fixed.
- Scheduled start—the task run schedule.
For details on how to create a task, please refer to the Open Single Management Platform Help Guide.
The Install required updates and fix vulnerabilities task is available with a Vulnerability and Patch Management license.
Next, you need to install updates for third-party applications and fix vulnerabilities on assets in KUMA.
To install updates and fix vulnerabilities in third-party applications on an asset in KUMA:
- Open the asset details window in one of the following ways:
- In the KUMA Console, select Assets → select a category with the relevant assets → select an asset.
- In the KUMA Console, select Alerts → click the link with the relevant alert → select the asset in the Related endpoints section.
- In the KUMA Console, select Events → search and filter events → select the relevant event → click the link in one of the following fields: SourceAssetID, DestinationAssetID, or DeviceAssetID.
- In the asset details window, expand the list of Open Single Management Platform vulnerabilities.
- Select the check boxes next to the applications that you want to update.
- Click the Upload updates link.
- In the opened window, select the check box next to the ID of the vulnerability that you want to fix.
- If No is displayed in the EULA accepted column for the selected ID, click the Approve updates button.
- Click the link in the EULA URL column and carefully read the text of the End User License Agreement.
- If you agree to it, click the Accept selected EULAs button in the KUMA Console.
The ID of the vulnerability for which the EULA was accepted shows Yes in the EULA accepted successfully column.
- Repeat steps 7–10 for each required vulnerability ID.
- Click OK.
Updates will be uploaded and installed on the assets managed by the Administration Server where the task was started, and on the assets of all secondary Administration Servers.
The terms of the End User License Agreement for updates and vulnerability patches must be accepted on each secondary Administration Server separately.
Updates are installed on assets where the vulnerability was detected.
You can update the list of vulnerabilities for an asset in the asset details window by clicking the Update link.
Page top
Moving assets to a selected administration group
You can move assets to a selected administration group of Open Single Management Platform. In this case, the group policies and tasks will be applied to the assets. For more details on Open Single Management Platform tasks and policies, please refer to the Open Single Management Platform Help Guide.
Administration groups are added to KUMA when the hierarchy is loaded during import of assets from Open Single Management Platform. First, you need to configure KUMA integration with Open Single Management Platform.
To move an asset to a selected administration group:
- Open the asset details window in one of the following ways:
- In the KUMA Console, select Assets → select a category with the relevant assets → select an asset.
- In the KUMA Console, select Alerts → click the link with the relevant alert → select the asset in the Related endpoints section.
- In the asset details window, click the Move to KSC group button.
- Click the Move to KSC group button.
- Select the group in the opened window.
The selected group must be owned by the same tenant as the asset.
- Click the Save button.
The selected asset will be moved.
To move multiple assets to a selected administration group:
- In the KUMA Console, select the Assets section.
- Select the category with the relevant assets.
- Select the check boxes next to the assets that you want to move to the group.
- Click the Move to KSC group button.
The button is active if all selected assets belong to the same Administration Server.
- Select the group in the opened window.
- Click the Save button.
The selected assets will be moved.
You can see the specific group of an asset in the asset details.
Open Single Management Platform assets information is updated in KUMA when information about assets is imported from Open Single Management Platform. This means that a situation may arise when assets have been moved between administration groups in Open Single Management Platform, but this information is not yet displayed in KUMA. When an attempt is made to move such an asset to an administration group in which it is already located, KUMA returns the Failed to move assets to another KSC group error.
Page top
Asset audit
KUMA can be configured to generate asset audit events under the following conditions:
- Asset was added to KUMA. The application monitors manual asset creation, as well as creation during import via the REST API and during import from Open Single Management Platform or KICS/KATA.
- Asset parameters have been changed. A change in the value of the following asset fields is monitored:
- Name
- IP address
- MAC address
- FQDN
- Operating system
Fields may be changed when an asset is updated during import.
- Asset was deleted from KUMA. The program monitors manual deletion of assets, as well as automatic deletion of assets imported from Open Single Management Platform and KICS/KATA, whose data stopped coming.
- Vulnerability info was added to the asset. The program monitors the appearance of new vulnerability data for assets. Information about vulnerabilities can be added to an asset, for example, when importing assets from Open Single Management Platform or KICS/KATA.
- Asset vulnerability was resolved. The program monitors the removal of vulnerability information from an asset. A vulnerability is considered to be resolved if data about this vulnerability is no longer received from any sources from which information about its occurrence was previously obtained.
- Asset was added to a category. The program monitors the assignment of an asset category to an asset.
- Asset was removed from a category. The program monitors the deletion of an asset from an asset category.
By default, if asset audit is enabled, under the conditions described above, KUMA creates not only audit events (Type = 4), but also base events (Type = 1).
Asset audit events can be sent to storage or to correlators, for example.
Configuring an asset audit
To configure an asset audit:
- In the KUMA Console, open Settings → Asset audit.
- Perform one of the following actions with the tenant for which you want to configure asset audit:
- Add the tenant by using the Add tenant button if this is the first time you are configuring asset audit for the relevant tenant.
In the opened Asset audit window, select a name for the new tenant.
- Select an existing tenant in the table if asset audit has already been configured for the relevant tenant.
In the opened Asset audit window, the tenant name is already defined and cannot be edited.
- Clone the settings of an existing tenant to create a copy of the conditions configuration for the tenant for which you are configuring asset audit for the first time. To do so, select the check box next to the tenant whose configuration you need to copy and click Clone. In the opened Asset audit window, select the name of the tenant to use the copied configuration.
- Add the tenant by using the Add tenant button if this is the first time you are configuring asset audit for the relevant tenant.
- For each condition for generating asset audit events, select the destination to where the created events will be sent:
- In the group of settings for the relevant type of asset audit events, use the Add destination drop-down list to select the type of destination to which you want to send the created events:
- Select Storage if you want events to be sent to storage.
- Select Correlator if you want events to be sent to the correlator.
- Select Other if you want to select a different destination.
This type of resource includes correlator and storage services that were created in previous versions of the program.
In the Add destination window that opens you must define the settings for event forwarding.
- Use the Destination drop-down list to select an existing destination or select Create if you want to create a new destination.
If you are creating a new destination, fill in the settings as indicated in the destination description.
- Click Save.
A destination has been added to the condition for generating asset audit events. Multiple destinations can be added for each condition.
- In the group of settings for the relevant type of asset audit events, use the Add destination drop-down list to select the type of destination to which you want to send the created events:
- Click Save.
The asset audit has been configured. Asset audit events will be generated for those conditions for which destinations have been added. Click Save.
Page top
Storing and searching asset audit events
Asset audit events are considered to be base events and do not replace audit events. Asset audit events can be searched based on the following parameters:
Event field |
Value |
DeviceVendor |
|
DeviceProduct |
|
DeviceEventCategory |
|
Enabling and disabling an asset audit
You can enable or disable asset audit for a tenant:
To enable or disable an asset audit for a tenant:
- In the KUMA Console, open Settings → Asset audit and select the tenant for which you want to enable or disable an asset audit.
The Asset audit window opens.
- Select or clear the Disabled check box in the upper part of the window.
- Click Save.
By default, when asset audit is enabled in KUMA, when an audit condition occurs, two types of events are simultaneously created: a base event and an audit event.
You can disable the generation of base events with audit events.
To enable or disable the creation of base events for an individual condition:
- In the KUMA Console, open Settings → Asset audit and select the tenant for which you want to enable or disable a condition for generating asset audit events.
The Asset audit window opens.
- Select or clear the Disabled check box next to the relevant conditions.
- Click Save.
For conditions with the Disabled check box selected, only audit events are created, and base events are not created.
Page top
Custom asset fields
In addition to the existing fields of the asset data model, you can create custom asset fields. Data from the custom asset fields is displayed when you view information about the asset. Custom fields can be filled in with data either manually or using the API.
You can create or edit the custom fields in the KUMA Console in the Settings → Assets section, in the Custom fields table. The table has the following columns:
- Name – the name of the custom field that is displayed when you view information about the asset.
- Default value – the value that is written to the custom field when an asset is added to KUMA.
- Mask – a regular expression to which the value in the custom field must match.
To create a custom asset field:
- In the KUMA Console, in the Settings → Assets section, click the Add field button.
An empty row is added to the Custom fields table. You can add multiple rows with the custom field settings at once.
- Fill in the columns with the settings of the custom field:
- Name (required)–from 1 to 128 characters in Unicode encoding.
- Default value–from 1 to 1,024 Unicode characters.
- Mask–from 1 to 1,024 Unicode characters.
- Click Save.
A custom field is added to the asset data model.
To delete or edit a custom asset field:
- In the KUMA Console, open Settings → Assets.
- Make the necessary changes in the Custom fields table:
- To delete a custom field, click the icon next to the row with the settings of the required field. Deleting a field also deletes the data written in this field for all assets.
- You can change the values of the field settings. Changing the default value does not affect the data written in the asset fields before.
- To change the display order of the fields, drag the lines with the mouse by the .
- To delete a custom field, click the
- Click Save.
The changes are made.
Page top
Critical information infrastructure assets
In KUMA, you can tag assets related to the critical information infrastructure (CII) of the Russian Federation. This allows you to restrict the KUMA users capabilities to handle alerts and incidents, which are associated with the assets related to the CII objects.
You can assign the CII category to assets if the license with the GosSOPKA module is active in KUMA.
General administrators and users with the Access to CII facilities check box selected in their profiles can assign the CII category to an asset. If none of these conditions are met, the following restrictions apply to the user:
- The CII category group of settings is not displayed in the Asset details and Edit asset windows. You cannot view or change the CII category of an asset.
- Alerts and incidents associated with the assets of the CII category are not available for viewing. You cannot perform any actions on such alerts and incidents; they are not displayed in the table of alerts and incidents.
- The CII column is not displayed in the Alerts and Incidents tables.
- Search and closing of the alerts using the REST API is not available.
The CII category of an asset is displayed in the Asset details window in the CII category group of settings.
To change the CII category of an asset:
- In the KUMA Console, in the Assets section, select the required asset.
The Asset details window opens.
- Click the Edit button and select one of the available values in the drop-down list:
- Information resource is not a CII object – default value, indicating that the asset does not have a CII category. The users with the Access to CII facilities check box cleared in their profiles can work with such assets and the alerts and incidents related to these assets.
- CII object without a significance category.
- CII object of the third category of significance.
- CII object of the second category of significance.
- CII object of the first category of significance.
- Click Save.
Integration with other solutions
In this section, you'll learn how to integrate KUMA with other solutions to enrich its functionality.
Integration with Open Single Management Platform
You can configure integration with selected Open Single Management Platform servers for one, several, or all KUMA tenants. If Open Single Management Platform integration is enabled, you can import information about the assets protected by this application, manage assets using tasks, and import events from the Open Single Management Platform event database.
First, you need to make sure that the relevant Open Single Management Platform server allows an incoming connection for the server hosting KUMA.
Configuring KUMA integration with Open Single Management Platform includes the following steps:
- Creating a user account in the Open Single Management Platform Administration Console
The credentials of this account are used when creating a secret to establish a connection with Open Single Management Platform. Different tasks may require different access rights.
For more details about creating a user account and assigning permissions to a user, please refer to the Open Single Management Platform Help Guide.
- Creating a secret of the credentials type for connecting to Open Single Management Platform
- Configuring Open Single Management Platform integration settings
- Creating a connection to the Open Single Management Platform server for importing information about assets
If you want to import information about assets registered on Open Single Management Platform servers into KUMA, you need to create a separate connection to each Open Single Management Platform server for each selected tenant.
If integration is disabled for the tenant or there is no connection to Open Single Management Platform, an error is displayed in the KUMA Console when attempting to import information about assets. In this case, the import process does not start.
Configuring Open Single Management Platform integration settings
To configure the settings for integration with Open Single Management Platform:
- Open the web interface of Kaspersky Unified Monitoring and Analysis Platform and select the Settings → Open Single Management Platform section.
The Open Single Management Platform integration by tenant window opens.
- Select the tenant for which you want to configure integration with Open Single Management Platform.
The Open Single Management Platform integration window opens.
- Enable or disable integration with Open Single Management Platform for the tenant:
- If you want to enable integration, clear the Disabled check box.
- If you want to disable integration, select the Disabled check box.
This check box is cleared by default.
- Specify intervals for automatic import of asset information and asset vulnerability information from Open Single Management Platform:
- In the KSC assets, hardware information field, enter the interval in hours for the automatic import of information about the basic attributes of assets (protection status, anti-virus database version, hardware). and must be an integer. The default setting is
1(1 hour). - In the KSC assets attributes (vulnerabilities, software, owners) field, enter the interval in hours for automatic import of information about other attributes of assets (vulnerabilities, software, owners). and must be an integer. The default setting is
12(12 hours).Importing the information about asset attributes (vulnerabilities, software, owners) may involve downloading a large amount of data, which may take a longer time to complete, we recommend setting a longer interval than for the hardware information import.
If necessary, you can manually import asset information and asset vulnerability information from Open Single Management Platform.
- In the KSC assets, hardware information field, enter the interval in hours for the automatic import of information about the basic attributes of assets (protection status, anti-virus database version, hardware). and must be an integer. The default setting is
- Click the Save button.
The Open Single Management Platform integration settings for the selected tenant will be configured.
If the tenant you need is missing from the list of tenants, you need to add the tenant to the list of tenants.
Page top
Adding a tenant to the list for Open Single Management Platform integration
To add a tenant to the list of tenants for integration with Open Single Management Platform:
- Open the KUMA web console and select Settings → Open Single Management Platform.
The Open Single Management Platform integration by tenant appears.
- Click the Add tenant button.
The Open Single Management Platform integration window appears.
- In the Tenant drop-down list, select the tenant that you need to add.
- Click the Save button.
The selected tenant will be added to the list of tenants for integration with Open Single Management Platform.
Page top
Creating Open Single Management Platform connection
To create a new Open Single Management Platform connection:
- Open the web interface of Kaspersky Unified Monitoring and Analysis Platform and select the Settings → Open Single Management Platform section.
The Open Single Management Platform integration by tenant window opens.
- Select the tenant for which you want to create a connection to Open Single Management Platform.
- Click the Add connection button and define the values for the following settings:
- Name (required)—the name of the connection. The name can contain 1 to 128 Unicode characters.
- URL (required)—the URL of the Open Single Management Platform server in hostname:port or IPv4:port format.
- In the Secret drop-down list, select the secret with the Open Single Management Platform account credentials or create a new secret.
- Click the
 button.
The secret window is displayed.
- Enter information about the secret:
- In the Name field, choose a name for the added secret.
- In the Tenant drop-down list, select the tenant that will own the Open Single Management Platform account credentials.
- In the Type drop-down list, select credentials.
- In the User and Password fields, enter credentials for your Open Single Management Platform server.
- If you want, enter a Description of the secret.
- Click Save.
You can change the selected secret by clicking
 .
. - Click the
- Disabled—the state of the connection to the selected Open Single Management Platform server. If the check box is selected, the connection to the selected server is inactive. If this is the case, you cannot use this connection to connect to the Open Single Management Platform server.
This check box is cleared by default.
- If you want Kaspersky Unified Monitoring and Analysis Platform to import only assets that are connected to secondary servers or included in groups:
- Click the Load hierarchy button.
- Select the check boxes next to the names of the secondary servers and groups from which you want to import asset information.
- If you want to import assets only from new groups, select the Import assets from new groups check box.
If no check boxes are selected, information about all assets of the selected Open Single Management Platform server is uploaded during the import.
- Click the Save button.
The connection to the Open Single Management Platform server is now created. You can use it to import asset information from Open Single Management Platform to Kaspersky Unified Monitoring and Analysis Platform or to create tasks related to assets in Open Single Management Platform from Kaspersky Unified Monitoring and Analysis Platform.
Page top
Editing Open Single Management Platform connection
To edit a Open Single Management Platform connection:
- Open the web interface of Kaspersky Unified Monitoring and Analysis Platform and select the Settings → Open Single Management Platform section.
The Open Single Management Platform integration by tenant window opens.
- Select the tenant for which you want to configure integration with Open Single Management Platform.
The Open Single Management Platform integration window opens.
- Click the Open Single Management Platform connection you want to change.
The window with the selected Open Single Management Platform connection parameters opens.
- Make the necessary changes to the settings.
- Click the Save button.
The Open Single Management Platform connection will be changed.
Page top
Deleting Open Single Management Platform connection
To delete a Open Single Management Platform connection:
- Open the web interface of Kaspersky Unified Monitoring and Analysis Platform and select the Settings → Open Single Management Platform section.
The Open Single Management Platform integration by tenant window opens.
- Select the tenant for which you want to configure integration with Open Single Management Platform.
The Open Single Management Platform integration window opens.
- Select the Open Single Management Platform connection that you want to delete.
- Click the Delete button.
The Open Single Management Platform connection will be deleted.
Page top
Importing events from the Open Single Management Platform database
In KUMA, you can receive events from the Open Single Management Platform SQL database. Events are received using the collector, which uses the following resources:
- Predefined [OOTB] KSC MSSQL, [OOTB] KSC MySQL, or [OOTB] KSC PostgreSQL connector.
- Predefined [OOTB] KSC from SQL normalizer.
Configuring the import of events from Open Single Management Platform proceeds in stages:
- Create a copy of the predefined connector.
The settings of the predefined connector are not editable, therefore, to configure the connection to the database server, you must create a copy of the predefined connector.
- Creating a collector:
- In the web interface.
- On the server.
To configure the import of events from Open Single Management Platform:
- Create a copy of the predefined connector corresponding to the type of database used by Open Single Management Platform:
- In the KUMA Console, in the Resources → Connectors section, find the relevant predefined connector in the folder hierarchy, select the check box next to that connector, and click Duplicate.
- This opens the Create connector window; in that window, on the Basic settings tab, in the Default query field, if necessary, replace the KAV database name with the name of the Open Single Management Platform database you are using.
An example of a query to the Open Single Management Platform SQL database
- Place the cursor in the URL field and in the displayed list, click in the line of the secret that you are using.
- This opens the Secret window; in that window, in the URL field, specify the server connection address in the following format:
sqlserver://user:password@kscdb.example.com:1433/databasewhere:
user—user account with public and db_datareader rights to the required database.password—user account password.kscdb.example.com:1433—address and port of the database server.database—name of the Open Single Management Platform database. 'KAV' by default.
Click Save.
- In the Create connector window, in the Connection section, in the Query field, replace the 'KAV' database name with the name of the Open Single Management Platform database you are using.
You must do this if you want to use the ID column to which the query refers.
Click Save.
- Install the collector in the web interface:
- Start the Collector Installation Wizard in one of the following ways:
- In the web interface of Kaspersky Unified Monitoring and Analysis Platform, in the Resources section, click Add event source.
- In the web interface of Kaspersky Unified Monitoring and Analysis Platform, in the Resources → Collectors section, click Add collector.
- At step 1 of the installation wizard, Connect event sources, specify the collector name and select the tenant.
- At step 2 of the installation wizard, Transport, select the copy of the connector that you created at step 1.
- At step 3 of the installation wizard, Event parsing, on the Parsing schemes tab, click Add event parsing.
- This opens the Basic event parsing window; in that window, on the Normalization scheme tab, select [OOTB] KSC from SQL in the Normalizer drop-down list and click OK.
- If necessary, specify the other settings in accordance with your requirements for the collector. For the purpose of importing events, editing settings at the remaining steps of the Installation Wizard is optional.
- At step 8 of the installation wizard, Setup validation, click Create and save service.
The lower part of the window displays the command that you must use to install the collector on the server. Copy this command to the clipboard.
- Close the Collector Installation Wizard by clicking Save collector.
- Start the Collector Installation Wizard in one of the following ways:
- Install the collector on the server.
To do so, on the server on which you want to receive Open Single Management Platform events, run the command that you copied to the clipboard after creating the collector in the web interface.
As a result, the collector is installed and can receive events from the SQL database of Open Single Management Platform.
You can view Open Single Management Platform events in the Events section of the web interface.
Page top
Kaspersky Endpoint Detection and Response integration
Kaspersky Endpoint Detection and Response (hereinafter also referred to as "KEDR") is a functional unit of Kaspersky Anti Targeted Attack Platform that protects assets in an enterprise LAN.
You can configure KUMA integration with Kaspersky Endpoint Detection and Response 4.1 and 5.0 to manage threat response actions on assets connected to Kaspersky Endpoint Detection and Response servers, and on Open Single Management Platform assets. Commands to perform operations are received by the Kaspersky Endpoint Detection and Response server, which then relays those commands to the Kaspersky Endpoint Agent installed on assets.
You can also import events to KUMA and receive information about Kaspersky Endpoint Detection and Response alerts (for more details, see the Configuring integration with an SIEM system section of the Kaspersky Anti Targeted Attack Platform online help).
When KUMA is integrated with Kaspersky Endpoint Detection and Response, you can perform the following operations on Kaspersky Endpoint Detection and Response assets that have Kaspersky Endpoint Agent:
- Manage network isolation of assets.
- Manage prevention rules.
- Start applications.
To get instructions on configuring integration for response action management, contact your account manager or Technical Support.
Importing Kaspersky Endpoint Detection and Response events using the kafka connector
When importing events from Kaspersky Endpoint Detection and Response, telemetry is transmitted in clear text and may be intercepted by an intruder.
Kaspersky Endpoint Detection and Response 4.0, 4.1, 5.0, and 5.1 events can be imported to KUMA using a Kafka connector.
Several limitations are applicable to the import of events from Kaspersky Endpoint Detection and Response 4.0 and 4.1:
- Import of events is available if the KATA and KEDR license keys are used in Kaspersky Endpoint Detection and Response.
- Import of events is not available if the Sensor component installed on a separate server is used as part of Kaspersky Endpoint Detection and Response.
To import events, perform the actions in Kaspersky Endpoint Detection and Response and in KUMA.
Importing events from Kaspersky Endpoint Detection and Response 4.0 or 4.1
To import Kaspersky Endpoint Detection and Response 4.0 or 4.1 events to KUMA:
In Kaspersky Endpoint Detection and Response:
- Use SSH or a terminal to log in to the management console of the Central Node server from which you want to export events.
- When prompted by the system, enter the administrator account name and the password that was set during installation of Kaspersky Endpoint Detection and Response.
The program component administrator menu is displayed.
- In the program component administrator menu, select Technical Support Mode.
- Press Enter.
The Technical Support Mode confirmation window opens.
- Confirm that you want to operate the application in Technical Support Mode. To do so, select Yes and press Enter.
- Run the following command:
sudo -i - In the
/etc/sysconfig/apt-servicesconfiguration file, in theKAFKA_PORTSfield, delete the value10000.If Secondary Central Node servers or the Sensor component installed on a separate server are connected to the Central Node server, you need to allow the connection with the server where you modified the configuration file via port 10000.
We do not recommend using this port for any external connections other than KUMA. To restrict connections over port 10000 only for KUMA, run the following command:
iptables -I INPUT -p tcp ! -s KUMA_IP_address --dport 10000 -j DROP - In the configuration file
/usr/bin/apt-start-sedr-iptablesadd the value10000in theWEB_PORTSfield, separated by a comma without a space. - Run the following command:
sudo sh /usr/bin/apt-start-sedr-iptables
Preparations for exporting events on the Kaspersky Endpoint Detection and Response side are now complete.
In KUMA:
- On the KUMA server, add the IP address of the Central Node server in the format
<IP address> centralnodeto one of the following files:%WINDIR%\System32\drivers\etc\hosts—for Windows./etc/hosts file—for Linux.
- In the KUMA Console, create a connector of the Kafka type.
When creating a connector, specify the following parameters:
- In the URL field, specify
<Central Node server IP address>:10000. - In the Topic field, specify
EndpointEnrichedEventsTopic. - In the Consumer group field, specify any unique name.
- In the URL field, specify
- In the KUMA Console, create a collector.
Use the connector created at the previous step as the transport for the collector. Use "[OOTB] KEDR telemetry" as the normalizer for the collector.
If the collector is successfully created and installed, Kaspersky Endpoint Detection and Response events will be imported into KUMA. You can find and view these events in the events table.
Importing events from Kaspersky Endpoint Detection and Response 5.0 and 5.1
Several limitations apply when importing events from Kaspersky Endpoint Detection and Response 5.0 and 5.1:
- Import of events is available only for the non-high-availability version of Kaspersky Endpoint Detection and Response.
- Import of events is available if the KATA and KEDR license keys are used in Kaspersky Endpoint Detection and Response.
- Import of events is not available if the Sensor component installed on a separate server is used as part of Kaspersky Endpoint Detection and Response.
To import Kaspersky Endpoint Detection and Response 5.0 or 5.1 events to KUMA:
In Kaspersky Endpoint Detection and Response:
- Use SSH or a terminal to log in to the management console of the Central Node server from which you want to export events.
- When prompted by the system, enter the administrator account name and the password that was set during installation of Kaspersky Endpoint Detection and Response.
The program component administrator menu is displayed.
- In the program component administrator menu, select Technical Support Mode.
- Press Enter.
The Technical Support Mode confirmation window opens.
- Confirm that you want to operate the application in Technical Support Mode. To do so, select Yes and press Enter.
- In the
/usr/local/lib/python3.8/dist-packages/firewall/create_iptables_rules.pyconfiguration file, specify the additional port10000for theWEB_PORTSconstant:WEB_PORTS = f'10000,80,{AppPort.APT_AGENT_PORT},{AppPort.APT_GUI_PORT}'You do not need to perform this step for Kaspersky Endpoint Detection and Response 5.1 because the port is specified by default. - Run the following commands:
kata-firewall stopkata-firewall start --cluster-subnet <network mask for addressing cluster servers>
Preparations for exporting events on the Kaspersky Endpoint Detection and Response side are now complete.
In KUMA:
- On the KUMA server, add the IP address of the Central Node server in the format
<IP address> kafka.services.external.dyn.katato one of the following files:%WINDIR%\System32\drivers\etc\hosts—for Windows./etc/hosts file—for Linux.
- In the KUMA Console, create a connector of the Kafka type.
When creating a connector, specify the following parameters:
- In the URL field, specify
<Central Node server IP address>:10000. - In the Topic field, specify
EndpointEnrichedEventsTopic. - In the Consumer group field, specify any unique name.
- In the URL field, specify
- In the KUMA Console, create a collector.
Use the connector created at the previous step as the transport for the collector. It is recommended to use the [OOTB] KEDR telemetry normalizer as the normalizer for the collector.
If the collector is successfully created and installed, Kaspersky Endpoint Detection and Response events will be imported into KUMA. You can find and view these events in the events table.
Page top
Importing Kaspersky Endpoint Detection and Response events using the kata/edr connector
To import Kaspersky Endpoint Detection and Response 5.1 events from hosts using the kata/edr connector:
- Configure event receipt on the KUMA side. To do this, in KUMA, create and install a collector with the 'kata/edr' connector or edit an existing collector, then save the modified settings and restart the collector.
- On the KEDR side, accept the authorization request from KUMA to begin receiving events in KUMA.
As a result, the integration is configured and KEDR events start arriving in KUMA.
Creating a collector for receiving events from KEDR
To create a collector for receiving events from KEDR:
- In KUMA → Resources → Collectors, select Add collector.
- This opens the Create collector window; in that window, at step 1 "Connect event sources", specify an arbitrary Collector name and in the drop-down list, select the appropriate Tenant.
- At step 2 "Transport", do the following:
- On the Basic settings tab:
- In the Connector field, select Create or start typing the name of the connector if you want to use a previously created connector.
- In the Connector type drop-down list, select the kata/edr connector. After you select the kata/edr connector type, more fields to fill in are displayed.
- In the URL field, specify the address for connecting to the KEDR server in the following <
name or IP address of the host>:<connection port, 443 by default> format. If the KEDR solution is deployed in a cluster, you can click Add to add all nodes. KUMA will connect to each specified node in sequence. If the KEDR solution is installed in a distributed configuration, on the KUMA side, you must configure a separate collector for each KEDR server. - In the Secret field, select Create to create a new secret. This opens the Create secret window; in that window, specify the Name and click Generate and download a certificate and private encryption key.
As a result, the certificate.zip archive is downloaded to the browser's Downloads folder; the archive contains the 'key.pem' key file and the 'cert.pem' certificate file. Unpack the archive. Click Upload certificate and select the cert.pem file. Click Upload private key and select the key.pem file. Click Create; the secret is added to the Secret drop-down list and automatically selected.
You can also select the created secret from the Secret list. KUMA uses the selected secret to connect to KEDR.
- The External ID field contains the ID for external systems. This ID is displayed in the KEDR web interface when authorizing the KUMA server. KUMA generates an ID automatically and the External ID field is automatically pre-populated.
- On the Advanced settings tab:
- To get detailed information in the collector log, move the Debug toggle switch to the enabled position.
- If necessary, in the Character encoding field, select the encoding of the source data to be converted to UTF-8. We only recommend configuring a conversion if you find invalid characters in the fields of the normalized event. By default, no value is selected.
- Specify the maximum Number of events per one request to KEDR. The default value is 0, which means that KUMA uses the value specified on the KEDR server. For details, please refer to KATA Help. You can specify an arbitrary value that must not exceed the value on the KEDR side. If the value you specify exceeds the value of the Maximum number of events setting specified on the KEDR server, the KUMA collector log will display the error "Bad Request: max_events N is greater than the allowed value".
- Fill in the Events fetch timeout field to receive events after a specified period of time. The default value is 0. This means that the default value of the KEDR server is applied. For details, please refer to KATA Help. This field specifies the time after which the KEDR server must send events to KUMA. The KEDR server uses two parameters: the maximum number of events and the events fetch timeout. Events are sent when the specified number of events is collected or the configured time elapses, whichever happens first. If the specified time has elapsed, but the specified number of events has not been collected, the KEDR server sends the events that it already has, without waiting for more.
- In the Client timeout field, specify how long KUMA must wait for a response from the KEDR server, in seconds. Default value: 1,800 s; displayed as 0. The client-side limit is specified in the Client timeout field. The Client timeout must be greater than the Events fetch timeout of the server to wait for the server's response without interrupting the current event collection task with a new request. If the response from the KEDR server does not arrive in the end, KUMA repeats the request.
- In the KEDRQL filter field, specify the conditions for filtering the request. As a result, pre-filtered events are received from KEDR. For details about available filter fields, please refer to the KATA Help.
- On the Basic settings tab:
- At step 3 "Parsing", click Add event parsing and select "[ООТВ] KEDR telemetry" in the Basic event parsing window.
- To finish creating the collector in the web interface, click Create and save service. Then copy the collector installation command from the web interface and run this installation command on the command line on the server where you want to install the collector.
If you were editing an existing collector, click Save and restart services.
As a result, the collector is created and is ready to send requests; the collector is displayed in the Resources → Active services section with the yellow status until KEDR accepts an authorization request from KUMA.
Authorizing KUMA on the KEDR side
After the collector is created in KUMA, for requests from KUMA to start arriving to KEDR, the KUMA authorization request must be accepted on the KEDR side. With the authorization request accepted, the KUMA collector automatically sends scheduled requests to KEDR and waits for a response. While waiting, the status of the collector is yellow, and after receiving the first response to a request, the status of the collector turns green.
As a result, the integration is configured and you can view events arriving from KEDR in the KUMA → Events section.
The initial request fetches part of the historical events that had occurred before the integration was configured. Current events begin arriving after all of the historical events. If you change the value of the URL setting or the External ID of an existing collector, KEDR treats the next request as an initial request, and after starting the KUMA collector with the modified settings, you will receive part of the historical events all over again. If you do not want to receive historical events, go to the settings of the relevant collector, configure the mapping of the KEDR and KUMA timestamp fields in the normalizer, and specify a filter by timestamp at the 'Event filtering' step of the collector installation wizard — the timestamp of the event must be greater than the timestamp when the collector is started.
Possible errors and solutions
If in the collector log, you see the "Conflict: An external system with the following ip and certificate digest already exists. Either delete it or provide a new certificate" error, create a new secret with the a certificate in the connector of the collector.
If in the collector log, you see the "Continuation token not found" error in response to an event request, create a new connector, attach it to the collector and restart the collector; alternatively, create a new secret with a new certificate in the connector of the collector. If you do not want to receive events generated before the error occurred, configure a Timestamp filter in the collector.
Page top
Configuring the display of a link to a Kaspersky Endpoint Detection and Response detection in KUMA event details
When Kaspersky Endpoint Detection and Response detections are received, KUMA creates an alert for each detection. You can configure the display of a link to a Kaspersky Endpoint Detection and Response detection in KUMA alert information.
You can configure the display of a detection link if you use only one Central Node server in Kaspersky Endpoint Detection and Response. If Kaspersky Endpoint Detection and Response is used in a distributed solution mode, it is impossible to configure the display of the links to Kaspersky Endpoint Detection and Response detections in KUMA.
To configure the display of a link to a detection in KUMA alert details, you need to complete steps in the Kaspersky Endpoint Detection and Response web interface and KUMA.
In the Kaspersky Endpoint Detection and Response web interface, you need to configure the integration of the application with KUMA as a SIEM system. For details on configuring integration, refer to the Kaspersky Anti Targeted Attack Platform documentation, Configuring integration with a SIEM system section.
Configuring the display of a link in the KUMA Console includes the following steps:
- Adding an asset that contains information about the Kaspersky Endpoint Detection and Response Central Node server from which you want to receive detections, and assigning a category to that asset.
- Creating a correlation rule.
- Creating a correlator.
You can use a pre-configured correlation rule. In this case configuring the display of a link in the KUMA Console includes the following steps:
- Creating a correlator.
Select the
[OOTB] KATA Alertcorrelation rule. - Adding an asset that contains information about the Kaspersky Endpoint Detection and Response Central Node server from which you want to receive detections and assigning a category
KATA standAloneto that asset.
Step 1. Adding an asset and assigning a category to it
First, you need to create a category that will be assigned to the asset being added.
To add a category:
- In the KUMA Console, select the Assets section.
- On the All assets tab, expand the category list of the tenant by clicking
 next to its name.
 - Select the required category or subcategory and click the Add category button.
The Add category details area appears in the right part of the web interface window.
- Define the category settings:
- In the Name field, enter the name of the category.
- In the Parent field, indicate the position of the category within the categories tree hierarchy. To do so, click the button and select a parent category for the category you are creating.
Selected category appears in Parent fields.
- If required, define the values for the following settings:
- Assign a severity to the category in the Priority drop-down list.
The specified severity is assigned to correlation events and alerts associated with the asset.
- If required, add a description for the category in the Description field.
- In the Categorization kind drop-down list, select how the category will be populated with assets. Depending on your selection, you may need to specify additional settings:
- Manually—assets can only be manually linked to a category.
- Active—assets will be assigned to a category at regular intervals if they satisfy the defined filter.
- Reactive—the category will be filled with assets by using correlation rules.
- Assign a severity to the category in the Priority drop-down list.
- Click the Save button.
To add an asset:
- In the KUMA Console, select the Assets section.
- Click the Add asset button.
The Add asset details area opens in the right part of the window.
- Define the following asset parameters:
- In the Asset name field, enter an asset name.
- In the Tenant drop-down list, select the tenant that will own the asset.
- In the IP address field, specify the IP address of the Kaspersky Endpoint Detection and Response Central Node server from which you want to receive detections.
- In the Categories field, select the category that you added in the previous step.
If you are using a predefined correlation rule, you need to select the
KATA standAlonecategory. - If required, define the values for the following fields:
- In the FQDN field, specify the Fully Qualified Domain Name of the Kaspersky Endpoint Detection and Response server.
- In the MAC address field, specify the MAC address of the Central Node Kaspersky Endpoint Detection and Response Central Node server.
- In the Owner field, define the name of the asset owner.
- Click the Save button.
Step 2. Adding a correlation rule
To add a correlation rule:
- In the KUMA Console, select the Resources section.
- Select Correlation rules and click the Create correlation rule button.
- On the General tab, specify the following settings:
- In the Name field, define the rule name.
- In the Type drop-down list, select simple.
- In the Propagated fields field, add the following fields: DeviceProduct, DeviceAddress, EventOutcome, SourceAssetID, DeviceAssetID.
- If required, define the values for the following fields:
- In the Rate limit field, define the maximum number of times per second that the rule will be triggered.
- In the Severity field, define the severity of alerts and correlation events that will be created as a result of the rule being triggered.
- In the Description field, provide any additional information.
- On the Selectors → Settings tab, specify the following settings:
- In the Filter drop-down list, select Create new.
- In the Conditions field, click the Add group button.
- In the operator field for the group you added, select AND.
- Add a condition for filtering by KATA value:
- In the Conditions field, click the Add condition button.
- In the condition field, select If.
- In the Left operand field, select Event field.
- In the Event field field, select DeviceProduct.
- In the operator field, select =.
- In the Right operand field, select constant.
- In the value field, enter KATA.
- Add a category filter condition:
- In the Conditions field, click the Add condition button.
- In the condition field, select If.
- In the Left operand field, select Event field.
- In the Event field field, select DeviceAssetID.
- In the operator field, select inCategory.
- In the Right operand field, select constant.
- Click the button.
- Select the category in which you placed the Kaspersky Endpoint Detection and Response Central Node server asset.
- Click the Save button.
- In the Conditions field, click the Add group button.
- In the operator field for the group you added, select OR.
- Add a condition for filtering by event class identifier:
- In the Conditions field, click the Add condition button.
- In the condition field, select If.
- In the Left operand field, select Event field.
- In the Event field field, select DeviceEventClassID.
- In the operator field, select =.
- In the Right operand field, select constant.
- In the value field, enter taaScanning.
- Repeat steps 1–7 in F for each of the following event class IDs:
- file_web.
- file_mail.
- file_endpoint.
- file_external.
- ids.
- url_web.
- url_mail.
- dns.
- iocScanningEP.
- yaraScanningEP.
- On the Actions tab, specify the following settings:
- In the Actions section, open the On every event drop-down list.
- Select the Output check box.
- In the Enrichment section, click the Add enrichment button.
- In the Source kind drop-down list, select template.
- In the Template field, enter https://{{.DeviceAddress}}:8443/katap/#/alerts?id={{.EventOutcome}}.
- In the Target field drop-down list, select DeviceExternalID.
- If necessary, turn on the Debug toggle switch to log information related to the operation of the resource.
- Click the Save button.
Step 3. Creating a correlator
You need to launch the correlator installation wizard. At step 3 of the wizard, you are required to select the correlation rule that you added by following this guide.
After the correlator is created, a link to these detections will be displayed in the details of alerts created when receiving detections from Kaspersky Endpoint Detection and Response. The link is displayed in the correlation event details (Related events section), in the DeviceExternalID field.
If you want the FQDN of the Kaspersky Endpoint Detection and Response Central Node server to be displayed in the DeviceHostName field, in the detection details, you need to create a DNS record for the server and create a DNS enrichment rule at step 4 of the wizard.
Page top
Integration with Kaspersky CyberTrace
Kaspersky CyberTrace (hereinafter CyberTrace) is a tool that integrates threat data streams with SIEM solutions. It provides users with instant access to analytics data, increasing their awareness of security decisions.
You can integrate CyberTrace with KUMA in one of the following ways:
- Integrate CyberTrace indicator search feature to enrich KUMA events with information from CyberTrace data streams.
- Integrate the entire CyberTrace web interface into KUMA to get full access to CyberTrace.
Integration with the CyberTrace web interface requires the CyberTrace TIP Enterprise license.
Integrating CyberTrace indicator search
To integrate CyberTrace indicator search:
- Configure CyberTrace to receive and process KUMA requests.
You can configure the integration with KUMA immediately after installing CyberTrace in the Quick Start Wizard or later in the CyberTrace web interface.
- Create an event enrichment rule in KUMA.
In the enrichment rule, you can specify which data from CyberTrace you want to enrich the event with. We recommend selecting cybertrace-http as the source kind.
- Create a collector to receive events that you want to enrich with CyberTrace data.
- Link the enrichment rule to the collector.
- Save and create the service:
- If you linked the rule to a new collector, click Save and create, copy the collector ID in the opened window and use the copied ID to install the collector on the server using the command line interface.
- If you linked the rule to an existing collector, click Save and restart services to apply the settings.
The configuration of the integration of CyberTrace indicator search is complete and KUMA events will be enriched with CyberTrace data.
Example of testing CyberTrace data enrichment.
Configuring CyberTrace to receive and process requests
You can configure CyberTrace to receive and process requests from KUMA immediately after its installation in the Quick Start Wizard or later in the program web interface.
To configure CyberTrace to receive and process requests in the Quick Start Wizard:
- Wait for the CyberTrace Quick Start Wizard to start after the program is installed.
The wizard starts at step 1, Welcome to Kaspersky CyberTrace. You can go to the next step of the wizard by clicking Next.
- At step 2, Proxy settings, if your organization uses a proxy server, enter its connection settings. If your organization does not use a proxy server, leave all fields blank.
- At step 3, Licensing settings, select the method for adding a license key for CyberTrace: an activation code or a license key file. Depending on the selected method, specify the activation code or upload a license key file.
- At step 4, Service settings, keep default settings.
- At step 5, Data management settings:
- In the SIEM system drop-down list, select KUMA.
- Under Listen on, select the IP and port option.
- In the IP address field, enter
0.0.0.0. - In the Port field, enter the port to listen on for events. The default port is
9999. - Under Send detection alerts, in the IP address field, enter
127.0.0.1, and in the Port field, enter9998.
Leave the default values for everything else.
- At step 6, Certificate settings, select Commercial certificate and add a certificate that allows you to download data feeds from update servers.
- At step 7, Feeds settings, keep default settings.
CyberTrace is configured.
To configure CyberTrace to receive and process requests in the program web interface:
- In the window of the CyberTrace web interface, switch Data management mode: in the left menu, select System, and then in the displayed menu, select General.
- Select the Settings → General section.
- Under Listen on:
- Select IP and port.
- In the IP address field, enter
0.0.0.0. - In the Port field, enter the port to listen on for events. The default port is
9999.
- Select the Settings → Service alerts section.
- In the Service alert format field, enter
%Date% alert=%Alert%%RecordContext%. - In the Records context format field, enter
|%ParamName%=%ParamValue%. - Select the Settings → Detection alerts section.
- In the Alert format field, enter
Category=%Category%|MatchedIndicator=%MatchedIndicator%%RecordContext%. - On the Context tab, in the Actionable fields field, enter
%ParamName%:%ParamValue%. - Switch to the System management mode: in the left menu, select General, then in the displayed menu, select System.
- Select the Settings → Service section.
- Under Web interface, in the IP address or host name, enter
127.0.0.1. - In the upper toolbar, click Restart service.
- Restart the CyberTrace server.
CyberTrace is configured.
Page top
Creating event Enrichment rules
To create event enrichment rules:
- In the KUMA Console, open the Resources → Enrichment rules section and in the left part of the window, select or create a folder for the new rule.
The list of available enrichment rules will be displayed.
- Click Add enrichment rule to create a new rule.
The enrichment rule window will be displayed.
- Enter the rule configuration parameters:
- In the Name field, enter a unique name for the rule. The name must contain 1 to 128 Unicode characters.
- In the Tenant drop-down list, select the tenant that will own this resource.
- In the Source kind drop-down list, select cybertrace-http.
- Specify the URL of the CyberTrace server to which you want to connect. For example, example.domain.com:9999.
- If necessary, use the Number of connections field to specify the maximum number of connections to the CyberTrace server that can be simultaneously established by KUMA. By default, this value is equal to the number of vCPUs of the KUMA Core server.
- In the RPS field, enter the number of requests to the CyberTrace server per second that KUMA can make. The default value is
1000. - In the Timeout field, specify the maximum number of seconds KUMA should wait for a response from the CyberTrace server. Until a response is received or the time expires, the event is not sent to the Correlator. If a response is received before the timeout, it is added to the
TIfield of the event and the event processing continues. The default value is30. - In the Mapping settings block, you must specify the fields of events to be checked via CyberTrace, and define the rules for mapping fields of KUMA events to CyberTrace indicator types:
- In the KUMA field column, select the field whose value must be sent to CyberTrace.
- In the CyberTrace indicator column, select the CyberTrace indicator type for every field you selected:
- ip
- url
- hash
You must provide at least one string to the table. You can use the Add row button to add a string, and can use the
button to remove a string. - Use the Debug toggle switch to indicate whether or not to enable logging of service operations. Logging is disabled by default.
- If necessary, in the Description field, add up to 4,000 Unicode characters describing the resource.
- In the Filter section, you can specify conditions to identify events that will be processed using the enrichment rule. You can select an existing filter from the drop-down list or create a new filter.
Creating a filter in resources
To create a filter:
- In the Filter drop-down list, select Create new.
- If you want to keep the filter as a separate resource, select the Save filter check box. In this case, you will be able to use the created filter in various services. This check box is cleared by default.
- If you selected the Save filter check box, enter a name for the created filter resource in the Name field. Maximum length of the name: 128 Unicode characters.
- In the Conditions settings block, specify the conditions that the events must meet:
- Click the Add condition button.
- In the Left operand and Right operand drop-down lists, specify the search parameters. Depending on the data source selected in the Right operand field, there may be fields of additional parameters for identifying the value to be passed to the filter. For example, when you select active list, you must specify the name of the active list, the entry key, and the entry key field.
- In the operator drop-down list, select an operator.
- If you want the operator to be case-insensitive, select the do not match case check box. The selection of this check box does not apply to the InSubnet, InActiveList, InCategory or InActiveDirectoryGroup operators. This check box is cleared by default.
- If you want to add a negative condition, select If not from the If drop-down list.
You can add multiple conditions or a group of conditions.
- If you have added multiple conditions or groups of conditions, choose a selection condition (and, or, not) by clicking the AND button.
- If you want to add existing filters that are selected from the Select filter drop-down list, click the Add filter button. You can view the nested filter settings by clicking the button.
- Click Save.
A new enrichment rule will be created.
CyberTrace indicator search integration is now configured. You can now add the created enrichment rule to a collector. You must restart KUMA collectors to apply the new settings.
If any of the CyberTrace fields in the events details area contains "[{" or "}]" values, it means that information from CyberTrace data feed was processed incorrectly and it's possible that some of the data is not displayed. You can get all data feed information by copying the TI indicator field value from the KUMA event and searching for this value on the CyberTrace portal in the Indicators section. All information about the found indicator is displayed on the Indicator details page.
Integrating CyberTrace interface
You can integrate the CyberTrace web interface into the KUMA Console. When this integration is enabled, the KUMA Console includes a CyberTrace section that provides access to the CyberTrace web interface. You can configure the integration in the Settings → Kaspersky CyberTrace section of the KUMA Console.
To integrate the CyberTrace web interface in KUMA:
- In the KUMA Console, open Resources → Secrets.
The list of available secrets will be displayed.
- Click the Add secret button to create a new secret. This resource is used to store credentials of the CyberTrace server.
The secret window is displayed.
- Enter information about the secret:
- In the Name field, choose a name for the added secret. The name must contain 1 to 128 Unicode characters.
- In the Tenant drop-down list, select the tenant that will own this resource.
- In the Type drop-down list, select credentials.
- In the User and Password fields, enter credentials for your CyberTrace server.
- If necessary, in the Description field, add up to 4,000 Unicode characters describing the resource.
- Click Save.
The CyberTrace server credentials are now saved and can be used in other KUMA resources.
- In the KUMA Console, open Settings → Kaspersky CyberTrace.
The window with CyberTrace integration parameters opens.
- Make the necessary changes to the following parameters:
- Disabled—clear this check box if you want to integrate the CyberTrace web interface into the KUMA Console.
- Host (required)—enter the address of the CyberTrace server.
- Port (required)—enter the port of the CyberTrace server; the default port for managing the web interface is 443.
- In the Secret drop-down list, select the secret you created before.
- You can configure access to the CyberTrace web interface in the following ways:
- Use hostname or IP when logging into the KUMA Console.
To do so, in the Allow hosts section, click Add host and in the field that appears, enter the IP or hostname of the device
on which the KUMA Console is deployed
. - Use the FQDN when logging into the KUMA Console.
If you are using the Mozilla Firefox browser to work with the program web interface, the CyberTrace section may fail to display data. In this case, configure the data display (see below).
- Use hostname or IP when logging into the KUMA Console.
- Click Save.
CyberTrace is now integrated with KUMA, and the CyberTrace section is displayed in the KUMA Console.
To configure the data display in the CyberTrace section when using the FQDN to log in to KUMA in Mozilla Firefox:
- Clear your browser cache.
- In the browser's address bar, enter the FQDN of the KUMA Console with port number 7222 as follows: https://kuma.example.com:7222.
A window will open to warn you of a potential security threat.
- Click the Details button.
- In the lower part of the window, click the Accept risk and continue button.
An exclusion will be created for the URL of the KUMA Console.
- In the browser's address bar, enter the URL of the KUMA Console with port number 7220.
- Go to the CyberTrace section.
Data will be displayed in this section.
Updating CyberTrace deny list (Internal TI)
When the CyberTrace web interface is integrated into the KUMA Console, you can update the CyberTrace denylist or Internal TI with information from KUMA events.
To update CyberTrace Internal TI:
- Open the event details area from the events table, Alert window, or correlation event window and click the link on a domain, web address, IP address, or file hash.
The context menu opens.
- Select Add to Internal TI of CyberTrace.
A confirmation window opens.
- If you want to confirm your actions and update the Internal TI with data from KUMA events, click Yes.
The selected object is now added to the CyberTrace denylist.
Page top
Integration with Kaspersky Threat Intelligence Portal
The Kaspersky Threat Intelligence Portal combines all of Kaspersky's knowledge about cyberthreats and how they're related into a single web service. When integrated with KUMA, it helps KUMA users to make faster and better-informed decisions, providing them with data about URLs, domains, IP addresses, WHOIS / DNS data.
Access to the Kaspersky Threat Intelligence Portal is provided based on a fee. License certificates are created by Kaspersky experts. To obtain a certificate for Kaspersky Threat Intelligence Portal, contact your Technical Account Manager.
Initializing integration
To integrate Kaspersky Threat Intelligence Portal into KUMA:
- In the KUMA Console, open Resources → Secrets.
The list of available secrets will be displayed.
- Click the Add secret button to create a new secret. This resource is used to store credentials of your Kaspersky Threat Intelligence Portal account.
The secret window is displayed.
- Enter information about the secret:
- In the Name field, choose a name for the added secret.
- In the Tenant drop-down list, select the tenant that will own the created resource.
- In the Type drop-down list, select ktl.
- In the User and Password fields, enter credentials for your Kaspersky Threat Intelligence Portal account.
- If you want, enter a Description of the secret.
- Upload your Kaspersky Threat Intelligence Portal certificate key:
- Click the Upload PFX button and select the PFX file with your certificate.
The name of the selected file appears to the right of the Upload PFX button.
- Enter the password to the PFX file in the PFX password field.
- Click the Upload PFX button and select the PFX file with your certificate.
- Click Save.
The Kaspersky Threat Intelligence Portal account credentials are now saved and can be used in other KUMA resources.
- In the Settings section of the KUMA Console, open the Kaspersky Threat Lookup tab.
The list of available connections will be displayed.
- Make sure the Disabled check box is cleared.
- In the Secret drop-down list, select the secret you created before.
You can create a new secret by clicking the button with the plus sign. The created secret will be saved in the Resources → Secrets section.
- If necessary, select a proxy server in the Proxy drop-down list.
- Click Save.
- After you save the settings, log in to the web interface and accept the Terms of Use. Otherwise, an error will be returned in the API.
The integration process of Kaspersky Threat Intelligence Portal with KUMA is completed.
Once Kaspersky Threat Intelligence Portal and KUMA are integrated, you can request additional information from the event details area about hosts, domains, URLs, IP addresses, and file hashes (MD5, SHA1, SHA256).
Page top
Requesting information from Kaspersky Threat Intelligence Portal
To request information from Kaspersky Threat Intelligence Portal:
- Open the event details area from the events table, Alert window, or correlation event window, and click the link on a domain, web address, IP address, or file hash.
The Threat Lookup enrichment area opens in the right part of the screen.
- Select check boxes next to the data types you want to request.
If neither check box is selected, all information types are requested.
- In the Maximum number of records in each data group field enter the number of entries per selected information type you want to receive. The default value is
10. - Click Request.
A ktl task has been created. When it is completed, events are enriched with data from Kaspersky Threat Intelligence Portal which can be viewed from the events table, Alert window, or correlation event window.
Page top
Viewing information from Kaspersky Threat Intelligence Portal
To view information from Kaspersky Threat Intelligence Portal:
Open the event details area from the events table, alert window, or correlation event window and click the link on a domain, web address, IP address, or file hash for which you previously requested information from Kaspersky Threat Intelligence Portal.
The event details area opens in the right part of the screen with data from Kaspersky Threat Intelligence Portal; the time when it was received is indicated at the bottom of the screen.
Information received from Kaspersky Threat Intelligence Portal is cached. If you click a domain, web address, IP address, or file hash in the event details pane for which KUMA has information available, the data from Kaspersky Threat Intelligence Portal opens, with the time it was received indicated at the bottom, instead of the Threat Lookup enrichment window. You can update the data.
Page top
Updating information from Kaspersky Threat Intelligence Portal
To update information, received from Kaspersky Threat Intelligence Portal:
- Open the event details area from the events table, alert window, or correlation event window and click the link on a domain, web address, IP address, or file hash for which you previously requested information from Kaspersky Threat Intelligence Portal.
- Click Update in the event details area containing the data received from the Kaspersky Threat Intelligence Portal.
The Threat Lookup enrichment area opens in the right part of the screen.
- Select the check boxes next to the types of information you want to request.
If neither check box is selected, all information types are requested.
- In the Maximum number of records in each data group field enter the number of entries per selected information type you want to receive. The default value is
10. - Click Update.
The KTL task is created and the new data received from Kaspersky Threat Intelligence Portal is requested.
- Close the Threat Lookup enrichment window and the details area with KTL information.
- Open the event details area from the events table, Alert window or correlation event window and click the link on a domain, URL, IP address, or file hash for which you updated Kaspersky Threat Intelligence Portal information and select Show info from Threat Lookup.
The event details area opens on the right with data from Kaspersky Threat Intelligence Portal, indicating the time when it was received on the bottom of the screen.
Page top
Connecting over LDAP
LDAP connections are created and managed under Settings → LDAP server in the KUMA Console. The LDAP server integration by tenant section shows the tenants for which LDAP connections were created. Tenants can be created or deleted.
If you select a tenant, the LDAP server integration window opens to show a table containing existing LDAP connections. Connections can be created or edited. In this window, you can change the frequency of queries sent to LDAP servers and set the retention period for obsolete data.
After integration is enabled, information about Active Directory accounts becomes available in the alert window, the correlation events detailed view window, and the incidents window. If you click an account name in the Related users section of the window, the Account details window opens with the data imported from Active Directory.
Data from LDAP can also be used when enriching events in collectors and in analytics.
Imported Active Directory attributes
Enabling and disabling LDAP integration
You can enable or disable all LDAP connections of the tenant at the same time, or enable and disable an LDAP connection individually.
To enable or disable all LDAP connections of a tenant:
- In the KUMA Console, open Settings → LDAP server and select the tenant for which you want to enable or disable all LDAP connections.
The LDAP server integration by tenant window opens.
- Select or clear the Disabled check box.
- Click Save.
To enable or disable a specific LDAP connection:
- In the KUMA Console, open Settings → LDAP server and select the tenant for which you want to enable or disable an LDAP connection.
The LDAP server integration window opens.
- Select the relevant connection and either select or clear the Disabled check box in the opened window.
- Click Save.
Adding a tenant to the LDAP server integration list
To add a tenant to the list of tenants for integration with an LDAP server:
- Open the KUMA Console and select Settings → LDAP server.
The LDAP server integration by tenant window opens.
- Click the Add tenant button.
The LDAP server integration window is displayed.
- In the Tenant drop-down list, select the tenant that you need to add.
- Click Save.
The selected tenant is added to the LDAP server integration list.
To delete a tenant from the list of tenants for integration with an LDAP server:
- Open the KUMA Console and select Settings → LDAP server.
The LDAP server integration by tenant window is displayed.
- Select the check box next to the tenant that you need to delete, and click Delete.
- Confirm deletion of the tenant.
The selected tenant is deleted from the LDAP server integration list.
Page top
Creating an LDAP server connection
To create a new LDAP connection to Active Directory:
- In the KUMA Console, open the Settings → LDAP server section.
- Select or create a tenant for which you want to create a LDAP connection.
The LDAP server integration by tenant window opens.
- Click the Add connection button.
The Connection parameters window opens.
- Add a secret containing the account credentials for connecting to the Active Directory server. To do so:
- If you previously added a secret, in the Secret drop-down list, select the existing secret (with the credentials type).
The selected secret can be changed by clicking on the
button. - If you want to create a new secret, click the button.
The Secret window opens.
- In the Name (required) field, enter the name of the secret containing 1 to 128 Unicode characters.
- In the User and Password (required) fields, enter the account credentials for connecting to the Active Directory server.
You can enter the user name in one of the following formats: <user name>@<domain> or <domain><user name>.
- In the Description field, enter a description of up to 4,000 Unicode characters.
- Click the Save button.
- If you previously added a secret, in the Secret drop-down list, select the existing secret (with the credentials type).
- In the Name (required) field, enter the unique name of the LDAP connection.
The length of the string must be 1 to 128 Unicode characters.
- In the URL (required) field, enter the address of the domain controller in the format
<hostname or IP address of server>:<port>.In case of server availability issues, you can specify multiple servers with domain controllers by separating them with commas. All of the specified servers must reside in the same domain.
- If you want to use TLS encryption for the connection with the domain controller, select one of the following options from the Type drop-down list:
- startTLS.
When the
method is used, first it establishes an unencrypted connection on port 389, then it sends an encryption request. If the STARTTLS command ends with an error, the connection is terminated.Make sure that port 389 is open. Otherwise, a connection with the domain controller will be impossible.
- LDAPS.
When using LDAPS, an encrypted connection is immediately established over port 636.
- insecure.
When using an encrypted connection, it is impossible to specify an IP address as a URL.
- startTLS.
- If you enabled TLS encryption at the previous step, add a TLS certificate. You must use the certificate of the certification authority that signed the LDAP server certificate. You may not use custom certificates. To add a certificate:
- If you previously uploaded a certificate, select it from the Certificate drop-down list.
If no certificate was previously added, the drop-down list shows No data.
- If you want to upload a new certificate, click the
 button on the right of the Certificate list.
The Secret window opens.
- In the Name field, enter the name that will be displayed in the list of certificates after the certificate is added.
- Click the Upload certificate file button to add the file containing the Active Directory certificate. X.509 certificate public keys in Base64 are supported.
- If necessary, provide any relevant information about the certificate in the Description field.
- Click the Save button.
The certificate will be uploaded and displayed in the Certificate list.
- If you previously uploaded a certificate, select it from the Certificate drop-down list.
- In the Timeout in seconds field, indicate the amount of time to wait for a response from the domain controller server.
If multiple addresses are indicated in the URL field, KUMA will wait the specified number of seconds for a response from the first server. If no response is received during that time, the program will contact the next server, and so on. If none of the indicated servers responds during the specified amount of time, the connection will be terminated with an error.
- In the Base DN field, enter the base distinguished name of the directory where the search request should be performed.
- In the Custom AD Account Attributes field, specify the additional attributes that you want to use to enrich events.
- Select the Disabled check box if you do not want to use this LDAP connection.
This check box is cleared by default.
- Click the Save button.
The LDAP connection to Active Directory will be created and displayed in the LDAP server integration window.
Account information from Active Directory will be requested immediately after the connection is saved, and then it will be updated at the specified frequency.
If you want to use multiple LDAP connections simultaneously for one tenant, you need to make sure that the domain controller address indicated in each of these connections is unique. Otherwise KUMA lets you enable only one of these connections. When checking the domain controller address, the program does not check whether the port is unique.
Page top
Creating a copy of an LDAP server connection
You can create an LDAP connection by copying an existing connection. In this case, all settings of the original connection are duplicated in the newly created connection.
To copy an LDAP connection:
- In the KUMA Console, open Settings → LDAP server and select the tenant for which you want to copy an LDAP connection.
The LDAP server integration window opens.
- Select the relevant connection.
- In the opened Connection parameters window, click the Duplicate connection button.
The New Connection window opens. The word
copywill be added to the connection name. - If necessary, change the relevant settings.
- Click the Save button.
The new connection is created.
If you want to use multiple LDAP connections simultaneously for one tenant, you need to make sure that the domain controller address indicated in each of these connections is unique. Otherwise KUMA lets you enable only one of these connections. When checking the domain controller address, the program does not check whether the port is unique.
Page top
Changing an LDAP server connection
To change an LDAP server connection:
- Open the KUMA Console and select Settings → LDAP server.
The LDAP server integration by tenant window opens.
- Select the tenant for which you want to change the LDAP server connection.
The LDAP server integration window opens.
- Click the LDAP server connection that you want to change.
The window with the settings of the selected LDAP server connection opens.
- Make the necessary changes to the settings.
- Click the Save button.
The LDAP server connection is changed. Restart the KUMA services that use LDAP server data enrichment for the changes to take effect.
Page top
Changing the data update frequency
KUMA queries the LDAP server to update account data. This occurs:
- Immediately after creating a new connection.
- Immediately after changing the settings of an existing connection.
- According to a regular schedule every several hours. Every 12 hours by default.
- Whenever a user creates a task to update account data.
When querying LDAP servers, a task is created in the Task manager section of the KUMA Console.
To change the schedule of KUMA queries to LDAP servers:
- In the KUMA Console, open Settings → LDAP server → LDAP server integration by tenant.
- Select the relevant tenant.
The LDAP server integration window opens.
- In the Data refresh interval field, specify the required frequency in hours. The default value is 12.
The query schedule has been changed.
Page top
Changing the data storage period
Received user account data is stored in KUMA for 90 days by default if information about these accounts is no longer received from the Active Directory server. After this period, the data is deleted.
After KUMA account data is deleted, new and existing events are no longer enriched with this information. Account information will also be unavailable in alerts. If you want to view information about accounts throughout the entire period of alert storage, you must set the account data storage period to be longer than the alert storage period.
To change the storage period for the account data:
- In the KUMA Console, open Settings → LDAP server → LDAP server integration by tenant.
- Select the relevant tenant.
The LDAP server integration window opens.
- In the Data storage time field, specify the number of days you need to store data received from the LDAP server.
The account data storage period is changed.
Page top
Starting account data update tasks
After a connection to an Active Directory server is created, tasks to obtain account data are created automatically. This occurs:
- Immediately after creating a new connection.
- Immediately after changing the settings of an existing connection.
- According to a regular schedule every several hours. Every 12 hours by default. The schedule can be changed.
Account data update tasks can be created manually. You can download data for all connections or for one connection of the required tenant.
To start an account data update task for all LDAP connections of a tenant:
- In the KUMA Console, open Settings → LDAP server → LDAP server integration by tenant.
- Select the relevant tenant.
The LDAP server integration window opens.
- Click the Import accounts button.
A task to receive account data from the selected tenant is added to the Task manager section of the KUMA Console.
To start an account data update task for one LDAP connection of a tenant:
- In the KUMA Console, open Settings → LDAP server → LDAP server integration by tenant.
- Select the relevant tenant.
The LDAP server integration window opens.
- Select the relevant LDAP server connection.
The Connection parameters window opens.
- Click the Import accounts button.
A task to receive account data from the selected connection of the tenant is added to the Task manager section of the KUMA Console.
Page top
Deleting an LDAP server connection
To delete LDAP connection to Active Directory:
- In the KUMA Console, open Settings → LDAP server and select the tenant that owns the relevant LDAP connection.
The LDAP server integration window opens.
- Click the LDAP connection that you want to delete and click the Delete button.
- Confirm deletion of the connection.
The LDAP connection to Active Directory will be deleted.
Page top
Integration with the Security Orchestration Automation and Response Platform (SOAR)
Security Orchestration, Automation and Response Platform (hereinafter referred to as SOAR) is a software platform used for automation of monitoring, processing, and responding to information security incidents. It aggregates cyberthreat data from various sources into a single database for further analysis and investigation to facilitate incident response capabilities.
SOAR can be integrated with KUMA. After configuring integration, you can perform the following tasks in SOAR:
- Request information about alerts from KUMA. In SOAR, incidents are created based on received data.
- Send requests to KUMA to close alerts.
Integration is implemented by using the KUMA REST API. On the Security Vision IRP side, integration is carried out by using the preconfigured Kaspersky KUMA connector. Contact your SOAR vendor to learn more about the methods and conditions for obtaining a Kaspersky KUMA connector.
Managing SOAR incidents
SOAR incidents generated from KUMA alert data can be viewed in SOAR under Incidents → Incidents (2 lines) → All incidents (2 lines). Events related to KUMA alerts are logged in each SOAR incident. Imported events can be viewed on the Response tab.
KUMA alert imported into SOAR as an incident
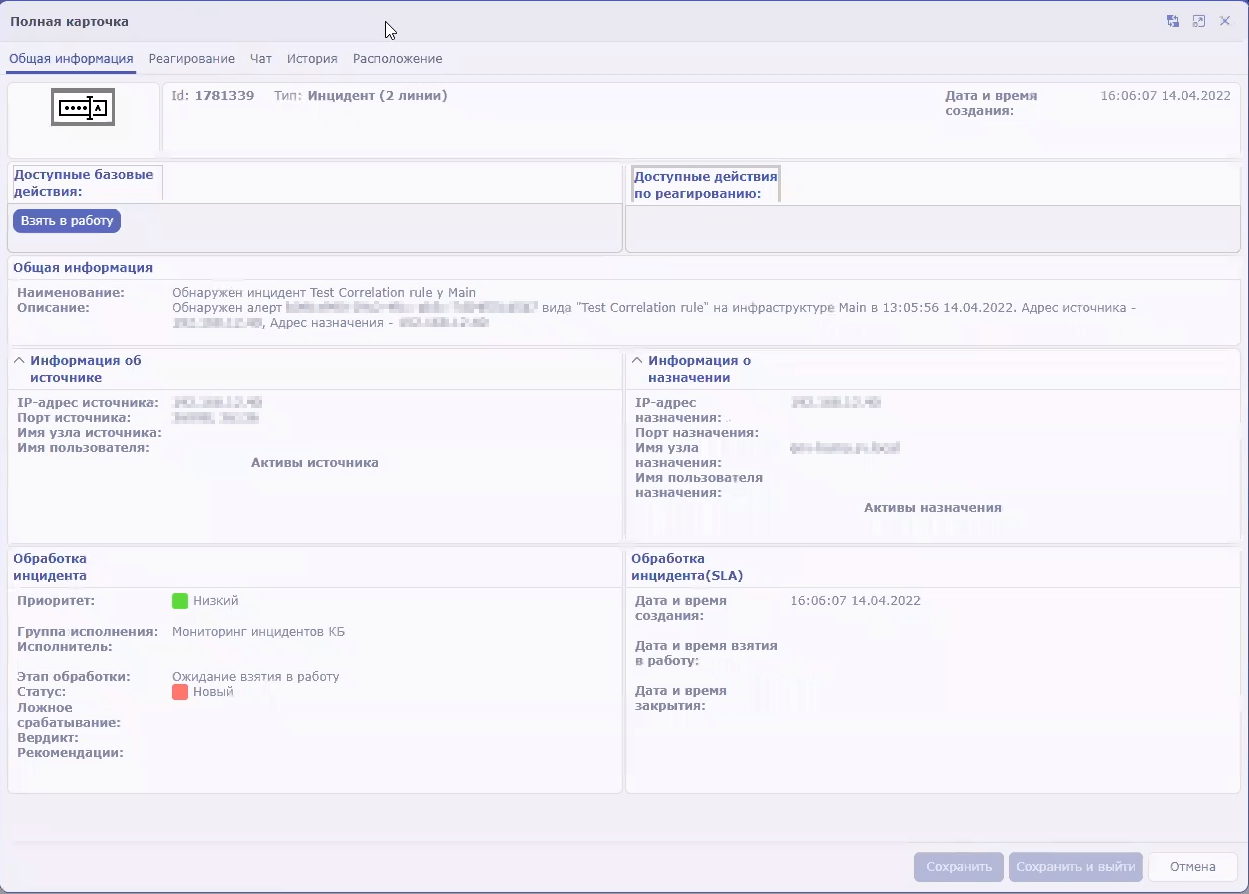
Security Vision IRP incident that was created based on KUMA alert
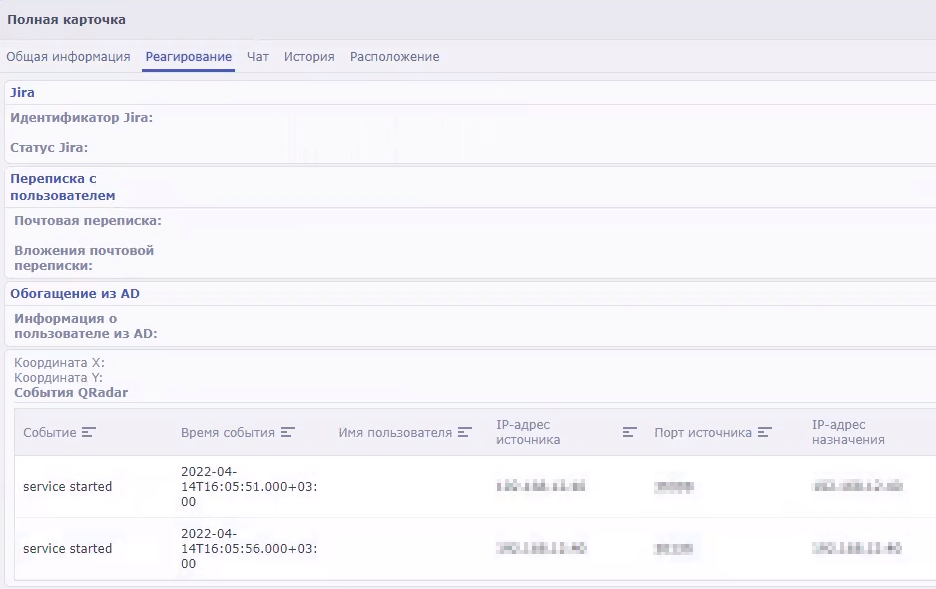
Events from KUMA alert that were imported to Security Vision IRP
Configuring integration in KUMA
To configure KUMA integration with SOAR, you must configure authorization of API requests in KUMA. To do so, you need to create a token for the KUMA user on whose behalf the API requests will be processed on KUMA side.
A token can be generated in your account profile. Users with the General Administrator role can generate tokens in the accounts of other users. You can always generate a new token.
To generate a token in your account profile:
- In the KUMA Console, click the user account name in the lower-left corner of the window and click the Profile button in the opened menu.
The User window with your user account parameters opens.
- Click the Generate token button.
- Copy the generated token displayed in the opened window. You will need it to configure SOAR.
When the window is closed, the token is no longer displayed. If you did not copy the token before closing the window, you will have to generate a new token.
The generated token must be specified in the SOAR connector settings.
Configuring integration in SOAR
Configuration of integration in SOAR consists of importing and configuring a connector. If necessary, you can also change other SOAR settings related to KUMA data processing, such as the data processing schedule and worker.
For more detailed information about configuring SOAR, please refer to the product documentation.
Importing and configuring a connector
Adding a connector to SOAR
Integration of SOAR and KUMA is performed using the Kaspersky KUMA connector. Contact your SOAR vendor to learn more about the methods and conditions for obtaining a Kaspersky KUMA connector.
To import the Kaspersky KUMA connector to SOAR:
- In SOAR, open the Settings → Connectors → Connectors section.
A list of connectors added to SOAR is displayed.
- At the top of the screen, click the import button and select the ZIP archive containing the Kaspersky KUMA connector.
The connector is imported into SOAR and is ready to be configured.
Configuring a connector for a connection to KUMA
To use a connector, you need to configure its connection to KUMA.
To configure a connection to KUMA in SOAR using the Kaspersky KUMA connector:
- In SOAR, open the Settings → Connectors → Connectors section.
A list of connectors added to your SOAR is displayed.
- Select the Kaspersky KUMA connector.
The general settings of the connector will be displayed.
- Under Connector settings, click the Edit button.
The connector configuration will be displayed.
- In the URL field, specify the address and port of KUMA. For example,
kuma.example.com:7223. - In the Token field, specify KUMA user API token.
The connection to KUMA is configured in the SOAR connector.
Security Vision IRP connector settings
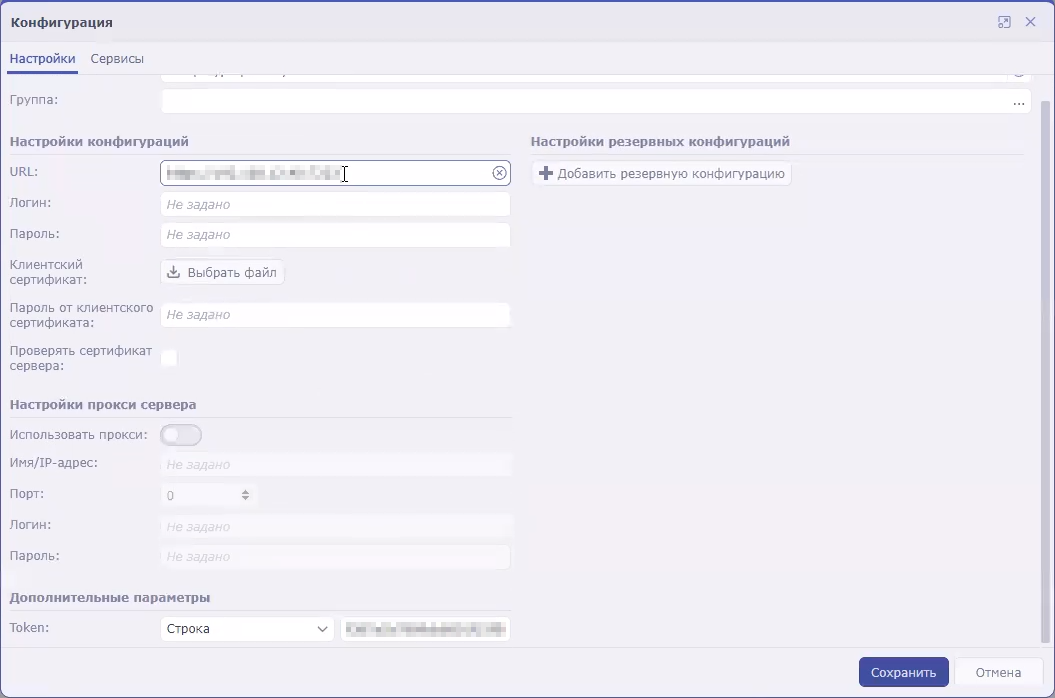
Configuring commands for interaction with KUMA in the SOAR connector
You can use SOAR to receive information about KUMA alerts (referred to as incidents in SOAR terminology) and send requests to close these alerts. To perform these actions, you need to configure the appropriate commands in the SOAR connector.
The instructions below describe how to add commands to receive and close alerts. However, if you need to implement more complex logic of interaction between SOAR and KUMA, you can similarly create your own commands containing other API requests.
To configure a command to receive alert information from KUMA:
- In SOAR, open the Settings → Connectors → Connectors section.
A list of connectors added to SOAR is displayed.
- Select the Kaspersky KUMA connector.
The general settings of the connector will be displayed.
- Click the +Command button.
The command creation window opens.
- Specify the command settings for receiving alerts:
- In the Name field, enter the command name:
Receive incidents. - In the Request type drop-down list, select GET.
- In the Called method field, enter the API request to search for alerts:
api/v1/alerts/?withEvents&status=new - Under Request headers, in the Name field, indicate
authorization. In the Value field, indicate Bearer <token>. - In the Content type drop-down list, select application/json.
- In the Name field, enter the command name:
- Save the command and close the window.
The connector command is configured. When this command is executed, the SOAR connector queries KUMA for information about all alerts with the New status and all events related to those alerts. The received data is sent to the SOAR processor, which uses it to create SOAR incidents. If new data appears in an alert that has been already imported into SOAR, incident information is updated in SOAR.
To configure a command to close KUMA alerts:
- In SOAR, open the Settings → Connectors → Connectors section.
A list of connectors added to SOAR is displayed.
- Select the Kaspersky KUMA connector.
The general settings of the connector will be displayed.
- Click the +Command button.
The command creation window will be displayed.
- Specify the command settings for receiving alerts:
- In the Name field, enter the command name:
Close incident. - In the Request type drop-down list, select POST.
- In the Called method field, enter API request to close an alert:
api/v1/alerts/close - In the Request field, enter the contents of the sent API request:
{"id":"<Alert ID>","reason":"responded"}You can create multiple commands for different reasons for closing alerts, such as responded, incorrect data, and incorrect correlation rule.
- Under Request headers, in the Name field, indicate
authorization. In the Value field, indicate Bearer <token>. - In the Content type drop-down list, select application/json.
- In the Name field, enter the command name:
- Save the command and close the window.
The connector command is configured. When this command is executed, the incident is closed in SOAR and the corresponding alert is closed in KUMA.

After the SOAR connector is configured, KUMA alerts are sent to the platform as SOAR incidents. Then you need to configure incident handling in SOAR based on the security policies of your organization.
Page top
Configuring the handler, schedule, and worker process
SOAR handler
The SOAR handler receives information about KUMA alerts from the SOAR connector and uses the information to create SOAR incidents. A predefined KUMA (Incidents) handler is used for processing data. The settings of the KUMA (Incidents) handler are available in SOAR under Settings → Event processing → Event handlers:
- You can view the rules for processing KUMA alerts in the handler settings on the Normalization tab.
- You can view the actions available when creating new objects in the handler settings on the Actions tab for creating objects of the Incident (2 lines) type.
Handler run schedule
The connector and handler are started according to a predefined KUMA schedule. This schedule can be configured in SOAR under Settings → Event processing → Schedule:
- In the Connector settings block, you can configure the settings for starting the connector.
- In the Handler settings block, you can configure the settings for starting the handler.
SOAR workflow
The life cycle of SOAR incidents created based on KUMA alerts follows the preconfigured Incident processing (2 lines) worker. The worker can be configured in SOAR under Settings → Workers → Worker templates: select the Incident processing (2 lines) worker and click the transaction or state that you need to change.
Page top
Integration with KICS/KATA
Kaspersky Industrial CyberSecurity for Networks (hereinafter referred to as "KICS/KATA") is an application designed to protect the industrial enterprise infrastructure from information security threats, and to ensure uninterrupted operation. The application analyzes industrial network traffic to identify deviations in the values of process parameters, detect signs of network attacks, and monitor the operation and current state of network devices.
KICS/KATA version 4.0 or later can be integrated with KUMA. After configuring integration, you can perform the following tasks in KUMA:
- Import asset information from KICS/KATA to KUMA.
- Send asset status change commands from KUMA to KICS/KATA.
Unlike KUMA, KICS/KATA refers to assets as devices.
The integration of KICS/KATA and KUMA must be configured in both applications:
- In KICS for Networks, you need to create a KUMA connector and save the communication data package of this connector.
- In KUMA, the communication data package of the connector is used to create a connection to KICS/KATA.
The integration described in this section applies to importing asset information. KICS/KATA can also be configured to send events to KUMA. To do so, you need to create a SIEM/Syslog connector in KICS/KATA and configure a collector on the KUMA side.
Configuring integration in KICS for Networks
The program supports integration with KICS for Networks version 4.0 or later.
It is recommended to configure integration of KICS for Networks and KUMA after ending Process Control rules learning mode. For more details, please refer to the documentation on KICS for Networks.
On the KICS for Networks side, integration configuration consists of creating a KUMA-type connector. In KICS for Networks, connectors are specialized application modules that enable KICS for Networks to exchange data with recipient systems, including KUMA. For more details on creating connectors, please refer to the KICS for Networks documentation.
When a connector is added to KICS for Networks, a communication data package is automatically created for this connector. This is an encrypted configuration file for connecting to KICS for Networks that is used when configuring integration on the KUMA side.
Page top
Configuring integration in KUMA
It is recommended to configure integration of KICS for Networks and KUMA after ending Process Control rules learning mode. For more details, please refer to the documentation on KICS for Networks.
To configure integration with KICS/KATA in KUMA:
- Open the KUMA Console and select Settings → Kaspersky Industrial CyberSecurity for Networks.
This opens the KICS/KATA server integration by tenant window.
- Select or create a tenant for which you want to create an integration with KICS for Networks.
This opens the KICS/KATA server integration window.
- Click the Communication data package field and select the communication data package that was created in KICS for Networks.
- In the Communication data package password field, enter the password of the communication data package.
- Select the Enable response check box if you want to change the statuses of KICS for Networks assets by using KUMA response rules.
- Click Save.
Integration with KICS/KATA is configured in KUMA, and the window displays the IP address of the node where the KICS/KATA connector will be running and its ID.
Page top
Enabling and disabling integration with KICS for Networks
To enable or disable KICS for Networks integration for a tenant:
- In the KUMA Console, open the Settings → KICS/KATA section and select the tenant for which you want to enable or disable KICS for Networks integration.
This opens the KICS/KATA server integration window.
- Select or clear the Disabled check box.
- Click Save.
Changing the data update frequency
KUMA queries KICS for Networks to update its asset information. This occurs:
- Immediately after creating a new integration.
- Immediately after changing the settings of an existing integration.
- According to a regular schedule every several hours. This occurs every 3 hours by default.
- Whenever a user creates a task for updating asset data.
When querying KICS for Networks, a task is created in the Task manager section of the KUMA Console.
To edit the schedule for importing information about KICS for Networks assets:
- In the KUMA Console, open the Settings → KICS/KATA section.
- Select the relevant tenant.
This opens the KICS/KATA server integration window.
- In the Data refresh interval field, specify the required frequency in hours. The default value is 3.
The import schedule has been changed.
Special considerations when importing asset information from KICS for Networks
Importing assets
Assets are imported according to the asset import rules. Only assets with the Authorized and Unauthorized statuses are imported.
KICS for Networks assets are identified by a combination of the following parameters:
- IP address of the KICS for Networks instance with which the integration is configured.
- KICS for Networks connector ID is used to configure the integration.
- ID assigned to the asset (or "device") in the KICS for Networks instance.
Importing vulnerability information
When importing assets, KUMA also receives information about active vulnerabilities in KICS for Networks. If a vulnerability has been flagged as Remediated or Negligible in KICS for Networks, the information about this vulnerability is deleted from KUMA during the next import.
Information about asset vulnerabilities is displayed in the localization language of KICS for Networks in the Asset details window in the Vulnerabilities settings block.
In KICS for Networks, vulnerabilities are referred to as risks and are divided into several types. All types of risks are imported into KUMA.
Imported data storage period
If information about a previously imported asset is no longer received from KICS for Networks, the asset is deleted after 30 days.
Page top
Changing the status of a KICS for Networks asset
After configuring integration, you can change the statuses of KICS for Networks assets from KUMA. Statuses can be changed either automatically or manually.
Asset statuses can be changed only if you enabled a response in the settings for connecting to KICS for Networks.
Manually changing the status of a KICS for Networks asset
Users with the General administrator, Tenant administrator, and Tier 2 analyst roles can manually change the statuses of assets imported from KICS for Networks in the tenants available to them.
To manually change a KICS for Networks asset status:
- In the Assets section of the KUMA Console, click the asset that you want to edit.
The Asset details area opens in the right part of the window.
- In the Status in KICS/KATA drop-down list, select the status that you want to assign to the KICS for Networks asset. The Authorized or Unauthorized statuses are available.
The asset status is changed. The new status is displayed in KICS for Networks and in KUMA.
Automatically changing the status of a KICS for Networks asset
Automatic changes to the statuses of KICS for Networks assets are implemented using response rules. The rules must be added to the correlator, which will determine the conditions for triggering these rules.
Page top
Integration with Neurodat SIEM IM
Neurodat SIEM IM is an information security monitoring system.
You can configure the export of KUMA events to Neurodat SIEM IM. Based on incoming events and correlation rules, Neurodat SIEM IM automatically generates information security incidents.
To configure integration with Neurodat SIEM IM:
- Connect to the Neurodat SIEM IM server over SSH using an account with administrative privileges.
- Create a backup copy of the /opt/apache-tomcat-<server version>/conf/neurodat/soz_settings.properties configuration file.
- In the /opt/apache-tomcat-<server version>/conf/neurodat/soz_settings.properties configuration file, edit the following settings as follows:
kuma.on=trueThis setting is an attribute of Neurodat SIEM IM interaction with KUMA.
job_kuma=com.cbi.soz.server.utils.scheduler.KumaIncidentsJobjobDelay_kuma=5000jobPeriod_kuma=60000
- Save changes of the configuration file.
- Run the following command to restart the tomcat service:
sudo systemctl restart tomcat - Obtain a token for the user in KUMA. To do so:
- Open the KUMA Console, click the name of your user account in the bottom-left corner of the window and click the Profile button in the opened menu.
The User window with your user account parameters opens.
- Click the Generate token button.
The New token window opens.
- If necessary, set the token expiration date:
- Select the No expiration date check box.
- In the Expiration date field, use the calendar to specify the date and time when the created token will expire.
- Click the Generate token button.
The Token field with an automatically generated token is displayed in the user details area. Copy it.
When the window is closed, the token is no longer displayed. If you did not copy the token before closing the window, you will have to generate a new token.
- Click Save.
- Open the KUMA Console, click the name of your user account in the bottom-left corner of the window and click the Profile button in the opened menu.
- Log in to Neurodat SIEM IM using the 'admin' account or another account that has the Administrator role for the organization you are configuring or the Administrator role for all organizations.
- In the Administration → Organization structure menu item, select or create an organization that you want to receive incidents from KUMA.
- On the organization form, do the following:
- Select the Configure integration with KUMA check box.
- In the KUMA IP address and port field, specify the KUMA API address, for example,
https://192.168.58.27:7223/api/v1/. - In the KUMA API key field, specify the user token obtained at step 6.
- Save the organization information.
Integration with KUMA is configured.
Neurodat SIEM IM tests access to KUMA and, if successful, displays a message about being ready to receive data from KUMA.
Page top
Kaspersky Automated Security Awareness Platform
Kaspersky Automated Security Awareness Platform (hereinafter also referred to as "ASAP") is an online learning platform that allows users to learn the rules of information security and threats related to it in their daily work, as well as to practice using real examples.
ASAP can be integrated with KUMA. After configuring integration, you can perform the following tasks in KUMA:
- Change user learning groups.
- View information about the courses taken by the users and the certificates they received.
Integration between ASAP and KUMA includes configuring API connection to ASAP. The process takes place in both solutions:
- In ASAP, create an authorization token and obtain an address for API requests.
- In KUMA, specify the address for API requests in ASAP, add an authorization token for API requests, and specify the email address of the ASAP administrator to receive notifications.
Creating a token in ASAP and getting a link for API requests
In order to be authorized, the API requests from KUMA to ASAP must be signed by a token created in ASAP. Only the company administrators can create tokens.
Creating a token
To create a token:
- Sign in to the ASAP web interface.
- In the Control panel section, click Import and synchronization, and then open the Open API tab.
- Click the New token button and select the API methods used for integration in the window that opens:
- GET /openapi/v1/groups
- POST /openapi/v1/report
- PATCH /openapi/v1/user/:userid
- Click the Generate token button.
- Copy the token and save it in any convenient way. This token is required to configure integration in KUMA.
The token is not stored in the ASAP system in the open form. After you close the Get token window, the token is unavailable for viewing. If you close the window without copying the token, you will need to click the New token button again for the system to generate a new token.
The issued token is valid for 12 months. After this period, the token is revoked. The issued token is also revoked if it is not used for 6 months.
Getting a link for API requests
To get the link used in ASAP for API requests:
- Sign in to the ASAP web interface.
- In the Control panel section, click Import and synchronization, and then open the Open API tab.
- A link for accessing ASAP using the Open API is located at the bottom part of the window. Copy the link and save it in any convenient way. This link is required to configure integration in KUMA.
Configuring integration in KUMA
To configure KUMA integration with ASAP:
- Open the KUMA Console and select Settings → Kaspersky Automated Security Awareness Platform.
The Kaspersky Automated Security Awareness Platform window opens.
- In the Secret field click the button to create a secret of the token by entering the token received from ASAP:
- In the Name field, enter the name of the secret. Must contain 1 to 128 Unicode characters.
- In the Token field, enter the authorization token for API requests to ASAP.
- If necessary, add the secret description in the Description field.
- Click Save.
- In the ASAP Open API URL field, specify the address used by ASAP for API requests.
- In the ASAP administrator email field, specify the email address of the ASAP administrator who receives notifications when users are added to the learning groups using KUMA.
- If necessary, in the Proxy drop-down list select the proxy server resource to be used to connect to ASAP.
- To disable or enable integration with ASAP, select or clear the Disabled check box.
- Click Save.
Integration with ASAP is configured in KUMA. When viewing information about alerts and incidents, you can select associated users to view which learning courses they have taken and to change their learning group.
Page top
Viewing information about the users from ASAP and changing learning groups
After configuring the integration between ASAP and KUMA, the following information from ASAP becomes available in alerts and incidents when you view data about associated users:
- The learning group to which the user belongs.
- The trainings passed by the user.
- The planned trainings and the current progress.
- The received certificates.
To view data about the user from ASAP:
- In the KUMA Console, in the Alerts or Incidents section, select the required alert or incident.
- In the Related users section, click the desired account.
The Account details window opens on the right side of the screen.
- Select the ASAP courses details tab.
The window displays information about the user from ASAP.
You can change the learning group of a user in ASAP.
To change a user learning group in ASAP:
- In the KUMA Console, in the Alerts or Incidents section, select the required alert or incident.
- In the Related users section, click the desired account.
The Account details window opens on the right side of the screen.
- In the Assign ASAP group drop-down list, select the ASAP learning group you want to assign the user to.
- Click Apply.
The user is moved to the selected ASAP group, the ASAP company administrator is notified of the change in the learning group, and the study plan is recalculated for the selected learning group.
For details on learning groups and how to get started, refer to the ASAP documentation.
Page top
Sending notifications to Telegram
This integration is an example and may require additional configuration depending on the versions used and the specifics of the infrastructure.
Compatibility is confirmed only for KUMA 2.0 and later.
The terms and conditions of premium technical support do not apply to this integration; support requests are processed without a guaranteed response time.
You can configure sending notifications to Telegram when KUMA correlation rules are triggered. This can reduce the response time to threats and, if necessary, make more persons informed.
Configure Telegram notifications proceeds in stages:
- Creating and configuring a Telegram bot
A special bot sends notifications about triggered correlation rules. It can send notifications to a private or group Telegram chat.
- Creating a script for sending notifications
You must create a script and save it on the server where the correlator is installed.
- Configuring notifications in KUMA
Configure a KUMA response rule that starts a script to send notifications and add this rule to the correlator.
Creating and configuring a Telegram bot
To create and configure a Telegram bot:
- In the Telegram application, find the BotFather bot and open a chat with it.
- In the chat, click Start.
- Create a new bot using the following command:
/newbot - Enter the name of the bot.
- Enter the login name of the bot.
The bot is created. You receive a link to the chat that looks like t.me/<bot login> and a token for contacting the bot.
- If you want to use the bot in a group chat, and not in private messages, edit privacy settings:
- In the BotFather chat, enter the command:
/mybots - Select the relevant bot from the list.
- Click Bot Settings → Group Privacy and select Turn off.
The bot can now send messages to group chats.
- In the BotFather chat, enter the command:
- To open a chat with the bot you created, use the t.me/<botlogin> link that you obtained at step 5, and click Start.
- If you want the bot to send private messages to the user:
- In the chat with the bot, send any message.
- Follow the https://t.me/getmyid_bot link and click Start.
- The response contains the
Current chat ID. You need this value to configure the sending of messages.
- If you want the bot to send messages to the group chat:
- Add https://t.me/getmyid_bot to the group chat for receiving notifications from KUMA.
The bot sends a message to the group chat, the message contains the
Current chat IDvalue. You need this value to configure the sending of messages. - Remove the bot from the group.
- Add https://t.me/getmyid_bot to the group chat for receiving notifications from KUMA.
- Send a test message through the bot. To do so, paste the following link into the address bar of your browser:
https://api.telegram.org/bot<token>/sendMessage?chat_id=<chat_id>&text=testwhere
<token>is the value obtained at step 5, and<chat_id>is the value obtained at step 8 or 9.
As a result, a test message should appear in the personal or group chat, and the JSON in the browser response should be free of errors.
Page top
Creating a script for sending notifications
To create a script:
- In the console of the server on which the correlator is installed, create a script file and add the following lines to it:
#!/bin/bash
set -eu
CHAT_ID=
<Current chat ID value obtained at step 8 or 9 of the Telegram bot setup instructions>TG_TOKEN=
<token value obtained at step 5 of the Telegram bot setup instructions>RULE=$1
TEXT="<b>$RULE</b> rule triggered"
curl --data-urlencode "chat_id=$CHAT_ID" --data-urlencode "text=$TEXT" --data-urlencode "parse_mode=HTML" https://api.telegram.org/bot$TG_TOKEN/sendMessage
If the correlator server does not have Internet access, you can use a proxy server:
#!/bin/bash
set -eu
CHAT_ID=
<Current chat ID value obtained at step 8 or 9 of the Telegram bot setup instructions>TG_TOKEN=
<token value obtained at step 5 of the Telegram bot setup instructions>RULE=$1
TEXT="<b>$RULE</b> rule triggered"
PROXY=<
address and port of the proxy server>curl --proxy $PROXY --data-urlencode "chat_id=$CHAT_ID" --data-urlencode "text=$TEXT" --data-urlencode "parse_mode=HTML" https://api.telegram.org/bot$TG_TOKEN/sendMessage
- Save the script to the correlator directory at /opt/kaspersky/kuma/correlator/<
ID of the correlator that must respond to events>/scripts/.For information about obtaining the correlator ID, see the Getting service identifier section.
- Make the 'kuma' user the owner of the file and grant execution rights:
chown kuma:kuma /opt/kaspersky/kuma/correlator/<ID of the correlator that must respond>/scripts/<script name>.shchmod +x /opt/kaspersky/kuma/correlator/<ID of the correlator that must respond>/scripts/<script name>.sh
Configuring notifications in KUMA
To configure the sending of KUMA notifications to Telegram:
- Create a response rule:
- In the KUMA Console, select the Resources → Response rules section and click Add response rule.
- This opens the Create response rule window; in that window, in the Name field, enter the name of the rule.
- In the Tenant drop-down list, select the tenant that owns the resource.
- In the Type drop-down list, select Run script.
- In the Script name field, enter the name of the script.
- In the Script arguments field, enter
{{.Name}}.This passes the name of the correlation event as the argument of the script.
- Click Save.
- Add the response rule to the correlator:
- In the Resources → Correlators section, select the correlator in whose folder you placed the created script for sending notifications.
- In the steps tree, select Response rules.
- Click Add.
- In the Response rule drop-down list, select the rule added at step 1 of these instructions.
- In the steps tree, select Setup validation.
- Click the Save and restart services button.
- Click the Save button.
Sending notifications about triggered KUMA rules to Telegram is configured.
UserGate integration
This integration is an example and may require additional configuration depending on the versions used and the specifics of the infrastructure.
Compatibility is confirmed only for KUMA 2.0 or later and UserGate 6.0 or later.
The terms and conditions of premium technical support do not apply to this integration; support requests are processed without a guaranteed response time.
UserGate is a network infrastructure security solution that protects personal information from the risks of external intrusions, unauthorized access, viruses, and malware.
Integration with UserGate allows automatically blocking threats by IP address, URL, or domain name whenever KUMA response rules are triggered.
Configuring the integration proceeds in stages:
- Configuring integration in UserGate
- Preparing a script for the response rule
- Configuring the KUMA response rule
Configuring integration in UserGate
To configure integration in UserGate:
- Connect to the UserGate web interface under an administrator account.
- Go to UserGate → Administrators → Administrator profiles, and click Add.
- In the Profile settings window, specify the profile name, for example,
API. - On the API Permissions tab, add read and write permissions for the following objects:
- content
- core
- firewall
- nlists
- Click Save.
- In the UserGate → Administrators section, click Add → Add local administrator.
- In the Administrator properties window, specify the login and password of the administrator.
In the Administrator profile field, select the profile created at step 3.
- Click Save.
- In the address bar of your browser, after the address and port of UserGate, add
?features=zone-xml-rpcand press ENTER. - Go to the Network → Zones section and for the zone of the interface that you want to use for API interaction, go to the Access Control tab and select the check box next to the XML-RPC for management service.
If necessary, you can add the IP address of the KUMA correlator whose correlation rules must trigger blocking in UserGate, to the list of allowed addresses.
- Click Save.
Preparing a script for integration with UserGate
To prepare a script for use:
- Copy the ID of the correlator whose correlation rules you want to trigger blocking of URL, IP address, or domain name in UserGate:
- In the KUMA Console, go to the Resources → Active services.
- Select the check box next to the correlator whose ID you want to obtain, and click Copy ID.
The correlator ID is copied to the clipboard.
- Download the script:
- Open the script file and in the Enter UserGate Parameters section, in the login and password parameters, specify the credentials of the UserGate administrator account that was created at step 7 of configuring the integration in UserGate.
- Place the downloaded script on the KUMA correlator server at the following path: /opt/kaspersky/kuma/correlator/<
correlator ID from step 1>/scripts/. - Connect to the correlator server via SSH and go to the path from step 4:
cd /opt/kaspersky/kuma/correlator/<correlator ID from step 1>/scripts/ - Run the following command:
chmod +x ug.py && chown kuma:kuma ug.py
The script is ready to use.
Page top
Configuring a response rule for integration with UserGate
To configure a response rule:
- Create a response rule:
- In the KUMA Console, select the Resources → Response rules section and click Add response rule.
- This opens the Create response rule window; in that window, in the Name field, enter the name of the rule.
- In the Tenant drop-down list, select the tenant that owns the resource.
- In the Type drop-down list, select Run script.
- In the Script name field, enter the name of the script.
ug.py. - In the Script arguments field, specify:
- one of the operations depending on the type of the object being blocked:
blockurlto block access by URLblockipto block access by IP addressblockdomainto block access by domain name
-i {{<KUMA field from which the value of the blocked object must be taken, depending on the operation>}}Example:
blockurl -i {{.RequetstUrl}}
- one of the operations depending on the type of the object being blocked:
- In the Conditions section, add conditions corresponding to correlation rules that require blocking in UserGate when triggered.
- Click Save.
- Add the response rule to the correlator:
- In the Resources → Correlators section, select the correlator that must respond and in whose directory you placed the script.
- In the steps tree, select Response rules.
- Click Add.
- In the Response rule drop-down list, select the rule added at step 1 of these instructions.
- In the steps tree, select Setup validation.
- Click Save and reload services.
- Click the Save button.
The response rule is linked to the correlator and ready to use.
Page top
Integration with Kaspersky Web Traffic Security
This integration is an example and may require additional configuration depending on the versions used and the specifics of the infrastructure.
Compatibility is confirmed only for KUMA 2.0 or later and Kaspersky Web Traffic Security 6.0 or later.
The terms and conditions of premium technical support do not apply to this integration; support requests are processed without a guaranteed response time.
You can configure integration with the Kaspersky Web Traffic Security web traffic analysis and filtering system (hereinafter also referred to as "KWTS").
Configuring the integration involves creating KUMA response rules that allow running KWTS tasks. Tasks must be created in advance in the KWTS web interface.
Configuring the integration proceeds in stages:
- Configuring integration in KWTS
- Preparing a script for the response rule
- Configuring the KUMA response rule
Configuring integration in KWTS
To prepare the integration in KWTS:
- Connect to the KWTS web interface under an administrator account and create a role with permissions to view and create/edit a rule.
For more details on creating a role, see the Kaspersky Web Traffic Security Help.
- Assign the created role to a user with NTML authentication.
You can use a local administrator account instead.
- In the Rules section, go to the Access tab and click Add rule.
- In the Action drop-down list, select Block.
- In the Traffic filtering drop-down list, select the URL value, and in the field on the right, enter a nonexistent or known malicious address.
- In the Name field, enter the name of the rule.
- Enable the rule using the Status toggle switch.
- Click Add.
- In the KWTS web interface, open the rule you just created.
- Make a note of the ID value that is displayed at the end of the page address in the browser address bar.
You must use this value when configuring the response rule in KUMA.
The integration is prepared on the KWTS side.
Page top
Preparing a script for integration with KWTS
To prepare a script for use:
- Copy the ID of the correlator whose correlation rules you want to trigger blocking of URL, IP address, or domain name in KWTS:
- In the KUMA Console, go to the Resources → Active services.
- Select the check box next to the correlator whose ID you want to obtain, and click Copy ID.
The correlator ID is copied to the clipboard.
- To get the script and the library, please contact Technical Support.
- Place the script provided by Technical Support on the KUMA correlator server at the following path: /opt/kaspersky/kuma/correlator/<
correlator ID from step 1>/scripts/. - Connect to the correlator server via SSH and go to the path from step 3:
cd /opt/kaspersky/kuma/correlator/<correlator ID from step 1>/scripts/ - Run the following command:
chmod +x kwts.py kwtsWebApiV6.py && chown kuma:kuma kwts.py kwtsWebApiV6.py
The script is ready to use.
Page top
Configuring a response rule for integration with KWTS
To configure a response rule:
- Create a response rule:
- In the KUMA Console, select the Resources → Response rules section and click Add response rule.
- This opens the Create response rule window; in that window, in the Name field, enter the name of the rule.
- In the Tenant drop-down list, select the tenant that owns the resource.
- In the Type drop-down list, select Run script.
- In the Script name field, enter the name of the script. kwts.py.
- In the Script arguments field, specify:
--host— address of the KWTS server.--username— name of the user account created in KWTS or local administrator.--password— KWTS user account password.--rule_id— ID of the rule created in KWTS.- Specify one of the options depending on the type of the object being blocked:
--url— specify the field of the KUMA event from which you want to obtain the URL, for example,{{.RequestUrl}}.--ip— specify the field of the KUMA event from which you want to obtain the IP address, for example,{{.DestinationAddress}}.--domain— specify the field of the KUMA event from which you want to obtain the domain name, for example,{{.DestinationHostName}}.
--ntlm— specify this option if the KWTS user was created with NTLM authentication.Example:
--host <address> --username <user> --password <pass> --rule_id <id> --url {{.RequestUrl}}
- In the Conditions section, add conditions corresponding to correlation rules that require blocking in KWTS when triggered.
- Click Save.
- Add the response rule to the correlator:
- In the Resources → Correlators section, select the correlator that must respond and in whose directory you placed the script.
- In the steps tree, select Response rules.
- Click Add.
- In the Response rule drop-down list, select the rule added at step 1 of these instructions.
- In the steps tree, select Setup validation.
- Click Save and reload services.
- Click the Save button.
The response rule is linked to the correlator and ready to use.
Page top
Integration with Kaspersky Secure Mail Gateway
This integration is an example and may require additional configuration depending on the versions used and the specifics of the infrastructure.
Compatibility is confirmed only for KUMA 2.0 or later and Kaspersky Secure Mail Gateway 2.0 or later.
The terms and conditions of premium technical support do not apply to this integration; support requests are processed without a guaranteed response time.
You can configure integration with the Kaspersky Secure Mail Gateway mail traffic analysis and filtering system (hereinafter also referred to as "KSMG").
Configuring the integration involves creating KUMA response rules that allow running KSMG tasks. Tasks must be created in advance in the KSMG web interface.
Configuring the integration proceeds in stages:
- Configuring integration in KSMG
- Preparing a script for the response rule
- Configuring the KUMA response rule
Configuring integration in KSMG
To prepare the integration in KSMG:
- Connect to the KSMG web interface under an administrator account and create a role with permissions to view and create/edit a rule.
For more details on creating a role, see the Kaspersky Secure Mail Gateway Help.
- Assign the created role to a user with NTML authentication.
You can use the 'Administrator' local administrator account.
- In the Rules section, click Create.
- In the left pane, select the General section.
- Enable the rule using the Status toggle switch.
- In the Rule name field, enter the name of the new rule.
- Under Mode, select one of the message processing options that meets the criteria of this rule.
- Under Sender on the Email addresses tab, enter a nonexistent or known malicious sender address.
- Under Recipient on the Email addresses tab, specify the relevant recipients or the "*" character to select all recipients.
- Click the Save button.
- In the KSMG web interface, open the rule you just created.
- Make a note of the ID value that is displayed at the end of the page address in the browser address bar.
You must use this value when configuring the response rule in KUMA.
The integration is prepared on the KSMG side.
Page top
Preparing a script for integration with KSMG
To prepare a script for use:
- Copy the ID of the correlator whose correlation rules must trigger the blocking of the IP address or email address of the message sender in KSMG:
- In the KUMA Console, go to the Resources → Active services.
- Select the check box next to the correlator whose ID you want to obtain, and click Copy ID.
The correlator ID is copied to the clipboard.
- To get the script and the library, please contact Technical Support.
- Place the script provided by Technical Support on the KUMA correlator server at the following path: /opt/kaspersky/kuma/correlator/<
correlator ID from step 1>/scripts/. - Connect to the correlator server via SSH and go to the path from step 3:
cd /opt/kaspersky/kuma/correlator/<correlator ID from step 1>/scripts/ - Run the following command:
chmod +x ksmg.py ksmgWebApiV2.py && chown kuma:kuma ksmg.py ksmgWebApiV2.py
The script is ready to use.
Page top
Configuring a response rule for integration with KSMG
To configure a response rule:
- Create a response rule:
- In the KUMA Console, select the Resources → Response rules section and click Add response rule.
- This opens the Create response rule window; in that window, in the Name field, enter the name of the rule.
- In the Tenant drop-down list, select the tenant that owns the resource.
- In the Type drop-down list, select Run script.
- In the Script name field, enter the name of the script. ksmg.py.
- In the Script arguments field, specify:
--host— address of the KSMG server.--username— name of the user account created in KSMG.You can specify the Administrator account.
--password— KSMG user account password.--rule_id— ID of the rule created in KSMG.- Specify one of the options depending on the type of the object being blocked:
--email— specify the field of the KUMA event from which you want to obtain the URL, for example,{{.SourceUserName}}.--ip— specify the field of the KUMA event from which you want to obtain the IP address, for example,{{.SourceAddress}}.
--ntlm— specify this option if the KSMG user was created with NTLM authentication.Example:
--host <address> --username <user> --password <pass> --ntlm --rule_id <id> --email {{.SourceUserName}}
- In the Conditions section, add conditions corresponding to the correlation rules that when triggered require blocking the IP address or email address of the message sender in KSMG.
- Click Save.
- Add the response rule to the correlator:
- In the Resources → Correlators section, select the correlator that must respond and in whose directory you placed the script.
- In the steps tree, select Response rules.
- Click Add.
- In the Response rule drop-down list, select the rule added at step 1 of these instructions.
- In the steps tree, select Setup validation.
- Click Save and reload services.
- Click the Save button.
The response rule is linked to the correlator and ready to use.
Page top
Importing asset information from RedCheck
This integration is an example and may require additional configuration depending on the versions used and the specifics of the infrastructure.
Compatibility is confirmed only for KUMA 2.0 or later and RedCheck 2.6.8 or later.
The terms and conditions of premium technical support do not apply to this integration; support requests are processed without a guaranteed response time.
RedCheck is a system for monitoring and managing the information security of an organization.
You can import asset information from RedCheck network device scan reports into KUMA.
Import is available from simple "Vulnerabilities" and "Inventory" reports in CSV format, grouped by hosts.
Imported assets are displayed in the KUMA Console in the Assets section. If necessary, you can edit the settings of assets.
Data is imported through the API using the redcheck-tool.py utility. The utility requires Python 3.6 or later and the following libraries:
- csv
- re
- json
- requests
- argparse
- sys
To import asset information from a RedCheck report:
- Generate a network asset scan report in RedCheck in CSV format and copy the report file to the server where the script is located.
For more details about scan tasks and output file formats, refer to the RedCheck documentation.
- Create a file with the token for accessing the KUMA REST API.
The account for which the token is created must satisfy the following requirements:
- Tenant administrator or Tier 2 analyst role.
- Access to the tenant into which the assets will be imported.
- Rights to use API requests: GET /assets, GET /tenants, POST/assets/import.
- Download the script:
- Copy the redcheck-tool.py tool to the server hosting the KUMA Core and make the tool's file executable:
chmod +x <path to the redcheck-tool.py file> - Run the redcheck-tool.py utility:
python3 redcheck-tool.py --kuma-rest <address and port of the KUMA REST API server> --token <API token> --tenant <name of the tenant in which the assets must be placed> --vuln-report <full path to the "Vulnerabilities" report file> --inventory-report <full path to the "Inventory" report file>Example:
python3 --kuma-rest example.kuma.com:7223 --token 949fc03d97bad5d04b6e231c68be54fb --tenant Main --vuln-report /home/user/vuln.csv --inventory-report /home/user/inventory.csvYou can use additional flags and commands for import operations. For example, the
-vcommand displays an extended report on the received assets. A detailed description of the available flags and commands is provided in the "Flags and commands of redcheck-tool.py" table. You can also use the--helpcommand to view information on the available flags and commands.
The asset information is imported from the RedCheck report to KUMA. The console displays information on the number of new and updated assets.
Example:
|
Example of extended import information:
|
The tool works as follows when importing assets:
- KUMA overwrites the data of assets imported through the API, and deletes information about their resolved vulnerabilities.
- KUMA skips assets with invalid data.
Flags and commands of redcheck-tool.py
Flags and commands
Mandatory
Description
--kuma-rest <address and port of the KUMA server>Yes
Port 7223 is used for API requests by default. You can change the port if necessary.
--token <token>Yes
The value of the option must contain only the token.
The Tenant administrator or Tier 2 analyst role must be assigned to the user account for which the API token is being generated.
--tenant <tenant name>Yes
Name of the KUMA tenant in which the assets from the RedCheck report will be imported.
--vuln-report <full path to the "Vulnerabilities" report>Yes
"Vulnerabilities" report file in CSV format.
--inventory-report <full path to the "Inventory" report file>No
"Inventory" report file in CSV format.
-vNo
Display extended information about the import of assets.
Possible errors
Error message
Description
Tenant %w not found
The tenant name was not found.
Tenant search error: Unexpected status Code: %d
An unexpected HTTP response code was received while searching for the tenant.
Asset search error: Unexpected status Code: %d
An unexpected HTTP response code was received while searching for an asset.
[%w import][error] Host: %w Skipped asset with FQDNlocalhost or IP 127.0.0.1
When importing inventory/vulnerabilities information, host cfqdn=localhost or ip=127.0.0.1 was skipped.
Configuring receipt of Sendmail events
You can configure the receipt of Sendmail mail agent events in the KUMA SIEM system.
Configuring event receiving consists of the following steps:
- Configuring Sendmail logging.
- Configuring the event source server.
- Creating a KUMA collector.
To receive Sendmail events, use the following values in the Collector Installation Wizard:
- At the Event parsing step, select the [OOTB] Sendmail syslog normalizer.
- At the Transport step, select the tcp or udp connector type.
- Installing the KUMA collector.
- Verifying receipt of Sendmail events in the KUMA collector
You can verify that the Sendmail event source server is correctly configured in the Searching for related events section of the KUMA Console.
Configuring Sendmail logging
By default, events of the Sendmail system are logged to syslog.
To make sure that logging is configured correctly:
- Connect via SSH to the server on which the Sendmail system is installed.
- Run the following command:
cat /etc/rsyslog.d/50-default.confThe command should return the following string:
mail.* -/var/log/mail.log
If logging is configured correctly, you can proceed to configuring the export of Sendmail events.
Page top
Configuring export of Sendmail events
Events are sent from the Sendmail mail agent server to the KUMA collector using the rsyslog service.
To configure transmission of Sendmail events to the collector:
- Connect to the server where Sendmail is installed using an account with administrative privileges.
- In the /etc/rsyslog.d/ directory, create the Sendmail-to-siem.conf file and add the following line to it:
If $programname contains 'sendmail' then @<<IP address of the collector>:<port of the collector>>Example:
If $programname contains 'sendmail' then @192.168.1.5:1514If you want to send events via TCP, the contents of the file must be as follows:
If $programname contains 'sendmail' then @@<<IP address of the collector>:<port of the collector>> - Create a backup copy of the /etc/rsyslog.conf file.
- Add the following lines to the /etc/rsyslog.conf configuration file:
$IncludeConfig /etc/Sendmail-to-siem.conf$RepeatedMsgReduction off - Save your changes.
- Restart the rsyslog service by executing the following command:
sudo systemctl restart rsyslog.service
Viewing KUMA metrics
To monitor the performance of its components, the event stream, and the correlation context, KUMA collects and stores a large number of parameters. The VictoriaMetrics time series database is used to collect, store and analyze the parameters. The collected metrics are visualized using Grafana. Dashboards that visualize key performance parameters of various KUMA components can be found in the KUMA → Metrics section.
The KUMA Core service configures VictoriaMetrics and Grafana automatically, no user action is required.
The collected metrics are visualized using the Grafana solution. The RPM package of the 'kuma-core' service generates the Grafana configuration and creates a separate dashboard for visualizing the metrics of each service. Graphs in the Metrics section appear with a delay of approximately 1.5 minutes.
For full information about the metrics, you can refer to the Metrics section of the KUMA Console. Selecting this section opens the Grafana portal that is deployed as part of Core installation and is updated automatically. If the Metrics section shows core: <port number>, this means that KUMA is deployed in a high availability configuration and the metrics were received from the host on which the Core was installed. In other configurations, the name of the host from which KUMA receives metrics is displayed.
Collector metrics
Metric name |
Description |
|---|---|
IO—metrics related to the service input and output. |
|
Processing EPS |
The number of events processed per second. |
Output EPS |
The number of events per second sent to the destination. |
Output Latency |
The time in milliseconds that passed while sending an event packet and receiving a response from the destination. The median value is displayed. |
Output Errors |
The number of errors occurring per second while event packets were sent to the destination. Network errors and errors writing to the disk buffer of the destination are displayed separately. |
Output Event Loss |
The number of events lost per second. Events can be lost due to network errors or errors writing the disk buffer of the destination. Events are also lost if the destination responds with an error code, for example, in case of an invalid request. |
Output Disk Buffer SIze |
The size of the disk buffer of the collector associated with the destination, in bytes. If a zero value is displayed, no event packets have been placed in the collector's disk buffer and the service is operating correctly. |
Write Network BPS |
The number of bytes received into the network per second. |
Connector errors |
The number of errors in the connector logs. |
Normalization—metrics related to the normalizers. |
|
Raw & Normalized event size |
The size of the raw event and size of the normalized event. The median value is displayed. |
Errors |
The number of normalization errors per second. |
Filtration—metrics related to filters. |
|
EPS |
The number of events per second matching the filter conditions and sent for processing. The collector only processes events that match the filtering criteria if the user has added the filter to the configuration of the collector service. |
Aggregation—metrics related to the aggregation rules. |
|
EPS |
The number of events received and generated by the aggregation rule per second. This metric helps determine the effectiveness of aggregation rules. |
Buckets |
The number of buckets in the aggregation rule. |
Enrichment—metrics related to enrichment rules. |
|
Cache RPS |
The number of requests per second to the local cache. |
Source RPS |
The number of requests per second to an enrichment source, such as a dictionary. |
Source Latency |
Time in milliseconds passed while sending a request to the enrichment source and receiving a response from it. The median value is displayed. |
Queue |
The size of the enrichment request queue. This metric helps to find bottleneck enrichment rules. |
Errors |
The number of errors per second while sending requests to the enrichment source. |
Correlator metrics
Metric name |
Description |
|---|---|
IO—metrics related to the service input and output. |
|
Processing EPS |
The number of events processed per second. |
Output EPS |
The number of events per second sent to the destination. |
Output Latency |
The time in milliseconds that passed while sending an event packet and receiving a response from the destination. The median value is displayed. |
Output Errors |
The number of errors occurring per second while event packets were sent to the destination. Network errors and errors writing to the disk buffer of the destination are displayed separately. |
Output Event Loss |
The number of events lost per second. Events can be lost due to network errors or errors writing the disk buffer of the destination. Events are also lost if the destination responds with an error code, for example, in case of an invalid request. |
Output Disk Buffer SIze |
The size of the disk buffer of the collector associated with the destination, in bytes. If a zero value is displayed, no event packets have been placed in the collector's disk buffer and the service is operating correctly. |
Correlation—metrics related to correlation rules. |
|
EPS |
The number of correlation events per second generated by the correlation rule. |
Buckets |
The number of buckers in a correlation rule of the standard type. |
Rate Limiter Hits |
The number of times the correlation rule exceeded the rate limit per second. |
Active Lists OPS |
The number of operations requests per second sent to the active list, and the operations themselves. |
Active Lists Records |
The number of records in the active list. |
Active Lists On-Disk Size |
The size of the active list on the disk, in bytes. |
Enrichment—metrics related to enrichment rules. |
|
Cache RPS |
The number of requests per second to the local cache. |
Source RPS |
The number of requests per second to an enrichment source, such as a dictionary. |
Source Latency |
Time in milliseconds passed while sending a request to the enrichment source and receiving a response from it. The median value is displayed. |
Queue |
The size of the enrichment request queue. This metric helps to find bottleneck enrichment rules. |
Errors |
The number of errors per second while sending requests to the enrichment source. |
Response—metrics associated with response rules. |
|
RPS |
The number of times a response rule was activated per second. |
Storage metrics
Metric name |
Description |
|---|---|
ClickHouse / General—metrics related to the general settings of the ClickHouse cluster. |
|
Active Queries |
The number of active queries sent to the ClickHouse cluster. This metric is displayed for each ClickHouse instance. |
QPS |
The number of queries per second sent to the ClickHouse cluster. |
Failed QPS |
The number of failed queries per second sent to the ClickHouse cluster. |
Allocated memory |
The amount of RAM, in gigabytes, allocated to the ClickHouse process. |
ClickHouse / Insert—metrics related to inserting events into a ClickHouse instance. |
|
Insert EPS |
The number of events per second inserted into the ClickHouse instance. |
Insert QPS |
The number of ClickHouse instance insert queries per second sent to the ClickHouse cluster. |
Failed Insert QPS |
The number of failed ClickHouse instance insert queries per second sent to the ClickHouse cluster. |
Delayed Insert QPS |
The number of delayed ClickHouse instance insert queries per second sent to the ClickHouse cluster. Queries were delayed by the ClickHouse node due to exceeding the soft limit on active merges. |
Rejected Insert QPS |
The number of rejected ClickHouse instance insert queries per second sent to the ClickHouse cluster. Queries were rejected by the ClickHouse node due to exceeding the hard limit on active merges. |
Active Merges |
The number of active merges. |
Distribution Queue |
The number of temporary files with events that could not be inserted into the ClickHouse instance because it was unavailable. These events cannot be found using search. |
ClickHouse / Select—metrics related to event selections in the ClickHouse instance. |
|
Select QPS |
The number of ClickHouse instance event select queries per second sent to the ClickHouse cluster. |
Failed Select QPS |
The number of failed ClickHouse instance event select queries per second sent to the ClickHouse cluster. |
ClickHouse / Replication—metrics related to replicas of ClickHouse nodes. |
|
Active Zookeeper Connections |
The number of active connections to the Zookeeper cluster nodes. In normal operation, this number should be equal to the number of nodes in the Zookeeper cluster. |
Read-only Replicas |
The number of read-only replicas of ClickHouse nodes. In normal operation, no such replicas of ClickHouse nodes must exist. |
Active Replication Fetches |
The number of active processes of downloading data from the ClickHouse node during data replication. |
Active Replication Sends |
The number of active processes of sending data to the ClickHouse node during data replication. |
Active Replication Consistency Checks |
The number of active data consistency checks on replicas of ClickHouse nodes during data replication. |
ClickHouse / Networking—metrics related to the network of the ClickHouse cluster. |
|
Active HTTP Connections |
The number of active connections to the HTTP server of the ClickHouse cluster. |
Active TCP Connections |
The number of active connections to the TCP server of the ClickHouse cluster. |
Active Interserver Connections |
The number of active service connections between ClickHouse nodes. |
Core metrics
Metric name |
Description |
|---|---|
Raft—metrics related to reading and updating the state of the Core. |
|
Lookup RPS |
The number of lookup procedure requests per second sent to the Core, and the procedures themselves. |
Lookup Latency |
Time in milliseconds spent running the lookup procedures, and the procedures themselves. The time is displayed for the 99th percentile of lookup procedures. One percent of lookup procedures may take longer to run. |
Propose RPS |
The number of Raft (SQLite) propose procedure requests per second sent to the Core, and the procedures themselves. |
Propose Latency |
Time in milliseconds spent running the Raft (SQLite) propose procedures, and the procedures themselves. The time is displayed for the 99th percentile of propose procedures. One percent of propose procedures may take longer to run. |
API—metrics related to API requests. |
|
RPS |
The number of API requests made to the Core per second. |
Latency |
The time in milliseconds spent processing a single API request to the Core. The median value is displayed. |
Errors |
The number of errors per second while sending API requests to the Core. |
Notification Feed—metrics related to user activity. |
|
Subscriptions |
The number of clients connected to the Core via SSE to receive server messages in real time. This number is normally equal to the number of clients that are using the KUMA Console. |
Errors |
The number of errors per second while sending notifications to users. |
Schedulers—metrics related to Core tasks. |
|
Active |
The number of repeating active system tasks. The tasks created by the user are ignored. |
Latency |
The time in milliseconds spent running the task. The median value is displayed. |
Errors |
The number of errors that occurred per second while performing tasks. |
KUMA agent metrics
Metric name |
Description |
|---|---|
IO—metrics related to the service input and output. |
|
Processing EPS |
The number of events processed per second. |
Output EPS |
The number of events per second sent to the destination. |
Output Latency |
The time in milliseconds that passed while sending an event packet and receiving a response from the destination. The median value is displayed. |
Output Errors |
The number of errors occurring per second while event packets were sent to the destination. Network errors and errors writing to the disk buffer of the destination are displayed separately. |
Output Event Loss |
The number of events lost per second. Events can be lost due to network errors or errors writing the disk buffer of the destination. Events are also lost if the destination responds with an error code, for example, in case of an invalid request. |
Output Disk Buffer SIze |
The size of the disk buffer of the collector associated with the destination, in bytes. If a zero value is displayed, no event packets have been placed in the collector's disk buffer and the service is operating correctly. |
Write Network BPS |
The number of bytes received into the network per second. |
Event routers metrics
Metric name |
Description |
|---|---|
IO—metrics related to the service input and output. |
|
Processing EPS |
The number of events processed per second. |
Output EPS |
The number of events per second sent to the destination. |
Output Latency |
The time in milliseconds that passed while sending an event packet and receiving a response from the destination. The median value is displayed. |
Output Errors |
The number of errors occurring per second while event packets were sent to the destination. Network errors and errors writing to the disk buffer of the destination are displayed separately. |
Output Event Loss |
The number of events lost per second. Events can be lost due to network errors or errors writing the disk buffer of the destination. Events are also lost if the destination responds with an error code, for example, in case of an invalid request. |
Output Disk Buffer SIze |
The size of the disk buffer of the collector associated with the destination, in bytes. If a zero value is displayed, no event packets have been placed in the collector's disk buffer and the service is operating correctly. |
Write Network BPS |
The number of bytes received into the network per second. |
Connector Errors |
The number of errors in the connector log. |
General metrics common for all services
Metric name |
Description |
|---|---|
Process—General process metrics. |
|
Memory |
RAM usage (RSS) in megabytes. |
DISK BPS |
The number of bytes read from or written to the disk per second. |
Network BPS |
The number of bytes received/transmitted over the network per second. |
Network Packet Loss |
The number of network packets lost per second. |
GC Latency |
The time, in milliseconds, spent executing a GO garbage collection cycle The median value is displayed. |
Goroutines |
The number of active goroutines. This number is different from the operating system's thread count. |
OS—metrics related to the operating system. |
|
Load |
Average load. |
CPU |
CPU load as a percentage. |
Memory |
RAM usage (RSS) as a percentage. |
Disk |
Disk space usage as a percentage. |
Metrics storage period
KUMA operation data is saved for 3 months by default. This storage period can be changed.
To change the storage period for KUMA metrics:
- Log in to the OS of the server where the KUMA Core is installed.
- In the file /etc/systemd/system/multi-user.target.wants/kuma-victoria-metrics.service, in the ExecStart parameter, edit the
--retentionPeriod=<metrics storage period, in months>flag by inserting the necessary period. For example,--retentionPeriod=4means that the metrics will be stored for 4 months. - Restart KUMA by running the following commands in sequence:
systemctl daemon-reloadsystemctl restart kuma-victoria-metrics
The storage period for metrics has been changed.
Page top
Managing KUMA tasks
When working in the program web interface, you can use tasks to perform various operations. For example, you can import assets or export KUMA event information to a TSV file.
Viewing the tasks table
The tasks table contains a list of created tasks and is located in the Task manager section of the program web interface window.
You can view the tasks that were created by you (current user). A user with the General Administrator role can view the tasks of all users.
By default, the Display only my own filter is applied in the Task manager section. To see tasks, clear the check box from the Display only my own filter.
The tasks table contains the following information:
- State—the state of the task. One of the following statuses can be assigned to a task:
- Green dot blinking—the task is active.
- Completed—the task is complete.
- Cancel—the task was canceled by the user.
- Error—the task was not completed because of an error. The error message is displayed if you hover the mouse over the exclamation mark icon.
- Task—the task type. The program provides the following types of tasks:
- Events export—export KUMA events.
- Threat Lookup—request data from the Kaspersky Threat Intelligence Portal.
- Retroscan—task for replaying events.
- KSC assets import—imports asset data from Open Single Management Platform servers.
- Accounts import—imports user data from Active Directory.
- KICS/KATA assets import—imports asset data from KICS/KATA.
- Repository update—updates the KUMA repository to receive the resource packages from the source specified in settings.
- Created by—the user who created the task. If the task was created automatically, the column will show Scheduled task.
- Created—task creation time.
- Updated—time when the task was last updated.
- Tenant—the name of the tenant in which the task was started.
The task date format depends on the localization language selected in the application settings. Possible date format options:
- English localization: YYYY-MM-DD.
- Russian localization: DD.MM.YYYY.
Configuring the display of the tasks table
You can customize the display of columns and the order in which they appear in the tasks table.
To customize the display and order of columns in the tasks table:
- In the KUMA Console, select the Task manager section.
The tasks table is displayed.
- In the table header, click the button.
- In the opened window, do the following:
- If you want to enable display of a column in the table, select the check box next to the name of the parameter that you want to display in the table.
- If you do not want the parameter to be displayed in the table, clear the check box.
At least one check box must be selected.
- If you want to reset the settings, click the Default link.
- If you want to change the order in which the columns are displayed in the table, move the mouse cursor over the name of the column, hold down the left mouse button and drag the column to the necessary position.
The display of columns in the tasks table will be configured.
Page top
Viewing task run results
To view the results of a task:
- In the KUMA Console, select the Task manager section.
The tasks table is displayed.
- Click the link containing the task type in the Task column.
A list of the operations available for this task type will be displayed.
- Select Show results.
The task results window opens.
In this section, the Display only my own filter is applied by default in the Created by column of the task table. To view all tasks, disable this filter.
Page top
Restarting a task
To restart a task:
- In the KUMA Console, select the Task manager section.
The tasks table is displayed.
- Click the link containing the task type in the Task column.
A list of the operations available for this task type will be displayed.
- Select Restart.
The task will be restarted.
Page top
Proxies
Proxy servers are used to store proxy server configuration settings, for example, in destinations. The http type is supported. Available proxy server settings are listed in the table below.
Available proxy server settings
Setting |
Description |
|---|---|
Name |
Unique name of the proxy server. Maximum length of the name: 128 Unicode characters. Required setting. |
Tenant |
The name of the tenant that owns the resource. Required setting. |
Secret separately |
Viewing information about the connection. If this check box is selected, the following settings are displayed in the window:
This lets you view connection information without having to re-create a large number of connections if the password of the user account that you used for the connections changes. This check box is cleared by default. |
Use URL from the secret |
The secret resource that stores URLs of proxy servers. You can create or edit a secret. To create a secret, click |
Do not use for domains |
One or more domains to which direct access is required. |
Description |
Description of the proxy server. Maximum length of the description: 4000 Unicode characters. |
Connecting to an SMTP server
KUMA can be configured to send email notifications using an SMTP server. Users will receive notifications if the Receive email notifications check box is selected in their profile settings.
Only one SMTP server can be added to process KUMA notifications. An SMTP server connection is managed in the KUMA Console under Settings → Other → SMTP server settings.
To configure SMTP server connection:
- Open the KUMA Console and select Settings → Other.
- In the SMTP server settings block, change the relevant settings:
- Disabled—select this check box if you want to disable connection to the SMTP server.
- Host (required)—SMTP host in one of the following formats: hostname, IPv4, IPv6.
- Port (required)—SMTP port. The value must be an integer from 1 to 65,535.
- From (required)—email address of the message sender. For example,
kuma@company.com. - Alias for KUMA Core server—name of the KUMA Core server that is used in your network. Must be different from the FQDN.
- If necessary, use the Secret drop-down list to select a secret of the credentials type that contains the account credentials for connecting to the SMTP server.
- Select the necessary frequency of notifications in the Monitoring notifications interval drop-down list.
Notifications from the source about a monitoring policy triggering are repeated after the selected period until the status of the source becomes green again.
If the Notify once setting is selected, you receive a notification about monitoring policy activation only once.
- Turn on the Disable monitoring notifications toggle button if you do not want to receive notifications about the state of event sources. The toggle switch is turned off by default.
- Click Save.
The SMTP server connection is now configured, and users can receive email messages from KUMA.
Page top
Working with Open Single Management Platform tasks
You can connect Open Single Management Platform assets to KUMA and download database and application module updates to these assets, or run an anti-virus scan on them by using Open Single Management Platform tasks. Tasks are started in the KUMA Console.
To run Open Single Management Platform tasks on assets connected to KUMA, it is recommended to use the following script:
- Creating a user account in the Open Single Management Platform Administration Console
The credentials of this account are used when creating a secret to establish a connection with Open Single Management Platform, and can be used to create a task.
For more details about creating a user account and assigning permissions to a user, please refer to the Open Single Management Platform Help Guide.
- Creating KUMA tasks in Open Single Management Platform
- Configuring KUMA integration with Open Single Management Platform
- Importing asset information from Open Single Management Platform into KUMA
- Assigning a category to the imported assets
After import, the assets are automatically placed in the Uncategorized devices group. You can assign one of the existing categories to the imported assets, or create a category and assign it to the assets.
- Running tasks on assets
You can manually start tasks in the asset information or configure tasks to start automatically.
Creating KUMA tasks in Open Single Management Platform
You can run the anti-virus database and application module update task, and the virus scan task on Open Single Management Platform assets connected to KUMA. The assets must have Kaspersky Endpoint Security for Windows or Linux installed. The tasks are created in OSMP Console.
For details about creating the Update and Virus scan tasks on the assets with Kaspersky Endpoint Security for Windows, refer to the Kaspersky Endpoint Security for Windows Help.
For more details about creating the Update and Virus scan tasks on the assets with Kaspersky Endpoint Security for Linux, refer to the Kaspersky Endpoint Security for Linux Help.
Task names must begin with "kuma" (not case-sensitive and without quotations). For example, KUMA antivirus check. Otherwise, the task is not displayed in the list of available tasks in the KUMA Console.
Starting Open Single Management Platform tasks manually
You can manually run the anti-virus database, application module update task, and the anti-virus scan task on Open Single Management Platform assets connected to KUMA. The assets must have Kaspersky Endpoint Security for Windows or Linux installed.
First, you need to configure the integration of Open Single Management Platform with KUMA and create tasks in Open Single Management Platform.
To manually start a Open Single Management Platform task:
- In the Assets section of the KUMA Console, select the asset that was imported from Open Single Management Platform.
The Asset details window opens.
- Click the KSC response button.
This button is displayed if the connection to the Open Single Management Platform that owns the selected asset is enabled.
- In the opened Select task window, select the check boxes next to the tasks that you want to start, and click the Start button.
Open Single Management Platform starts the selected tasks.
Some types of tasks are available only for certain assets.
You can obtain vulnerability and software information only for assets running a Windows operating system.
Page top
Starting Open Single Management Platform tasks automatically
You can configure the automatic start of the anti-virus database and application module update task and the virus scan task for Open Single Management Platform assets connected to KUMA. The assets must have Kaspersky Endpoint Security for Windows or Linux installed.
First, you need to configure the integration of Open Single Management Platform with KUMA and create tasks in Open Single Management Platform.
Configuring automatic start of Open Single Management Platform tasks includes the following steps:
Step 1. Adding a correlation rule
To add a correlation rule:
- In the KUMA Console, select the Resources section.
- Select Correlation rules and click the Add correlation rule button.
- On the General tab, specify the following settings:
- In the Name field, define the rule name.
- In the Tenant drop-down list, select the tenant that owns the resource.
- In the Type drop-down list, select simple.
- In the Propagated fields field, add the following fields: DestinationAssetID.
- If required, define the values for the following fields:
- In the Rate limit field, define the maximum number of times per second that the rule will be triggered.
- In the Severity field, define the severity of alerts and correlation events that will be created as a result of the rule being triggered.
- In the Description field, provide any additional information.
- On the Selectors → Settings tab:
- In the Filter drop-down list, select Create new.
- In the Conditions field, click the Add group button.
- In the operator field for the group you added, select AND.
- Add a condition for filtering by the DeviceProduct field value:
- In the Conditions field, click the Add condition button.
- In the condition field, select If.
- In the Left operand field, select event field.
- In the 'Event field' field, select DeviceProduct.
- In the Operator field, select =.
- In the Right operand field, select constant.
- In the value field, enter KSC.
- Add a condition for filtering by the Name field value:
- In the Conditions field, click the Add condition button.
- In the condition field, select If.
- In the Left operand field, select event field.
- In the event field, select Name.
- In the Operator field, select =.
- In the Right operand field, select constant.
- In the value field, enter the name of the event. When this event is detected, the task is started automatically.
For example, if you want the Virus scan task to start when Open Single Management Platform registers the Malicious object detected event, specify this name in the Value field.
You can view the event name in the Name field of the event details.
- On the Actions tab, specify the following settings:
- In the Actions section, open the On every event drop-down list.
- Select the Output check box.
You do not need to fill in other fields.
- Click the Save button.
The correlation rule will be created.
Step 2. Creating a correlator
You need to launch the correlator installation wizard. At step 3 of the wizard, you are required to select the correlation rule that you added by following this guide.
The DeviceHostName field must display the domain name (FQDN) of the asset. If it is not displayed, create a DNS record for this asset and create a DNS enrichment rule at Step 4 of the wizard.
Step 3. Adding a filter
To add a filter:
- In the KUMA Console, select the Resources section.
- Select Filters and click the Add filter button.
- In the Name field, specify the filter name.
- In the Tenant drop-down list, select the tenant that owns the resource.
- In the Conditions field, click the Add group button.
- In the operator field for the group you added, select AND.
- Add a condition for filtering by the DeviceProduct field value:
- In the Conditions field, click the Add condition button.
- In the condition field, select If.
- In the Left operand field, select event field.
- In the 'Event field' field, select Type.
- In the Operator field, select =.
- In the Right operand field, select constant.
- In the Value field, enter 3.
- Add a condition for filtering by the Name field value:
- In the Conditions field, click the Add condition button.
- In the condition field, select If.
- In the Left operand field, select event field.
- In the event field, select Name.
- In the Operator field, select =.
- In the Right operand field, select constant.
- In the Value field, enter the name of the correlation rule created at Step 1.
Step 4. Adding a response rule
To add a response rule:
- In the KUMA Console, select the Resources section.
- Select Response rules and click the Add response rule button.
- In the Name field, define the rule name.
- In the Tenant drop-down list, select the tenant that owns the resource.
- In the Type drop-down list, select Response via KSC.
- In the Open Single Management Platform task drop-down list, select the Open Single Management Platform task you want to start.
- In the Event field drop-down list, select the DestinationAssetID.
- In the Workers field, specify the number of processes that the service can run simultaneously.
By default, the number of work processes is the same as the number of virtual processors on the server where the correlator service is installed.
- In the Description field, you can add up to 4,000 Unicode characters.
- In the Filter drop-down list, select the filter added at Step 3 of this instruction.
To send requests to Open Single Management Platform, you must ensure that Open Single Management Platform is available over the UDP protocol.
If a response rule is owned by the shared tenant, the displayed Open Single Management Platform tasks that are available for selection are from the Open Single Management Platform server that the main tenant is connected to.
If a response rule has a selected task that is absent from the Open Single Management Platform server that the tenant is connected to, the task is not performed for assets of this tenant. This situation could arise when two tenants are using a common correlator, for example.
Step 5. Adding a response rule to the correlator
To add a response rule to the correlator:
- In the KUMA Console, select the Resources section.
- Select Correlators.
- In the list of correlators, select the correlator added at Step 2 of this instruction.
- In the steps tree, select Response rules.
- Click Add.
- In the Response rule drop-down list, select the rule added at step 4 of these instructions.
- In the steps tree, select Setup validation.
- Click the Save and restart services button.
- Click the Save button.
The response rule will be added to the correlator.
The automatic start will be configured for the anti-virus database and application module update task and the virus scan task on Open Single Management Platform assets connected to KUMA. The tasks are started when a threat is detected on the assets and KUMA receives the corresponding events.
Page top
Checking the status of Open Single Management Platform tasks
In the Kaspersky Unified Monitoring and Analysis Platform web interface, you can check whether a Open Single Management Platform task was started or whether a search for events owned by the collector listening for Open Single Management Platform events was completed.
To check the status of Open Single Management Platform tasks:
- In Kaspersky Unified Monitoring and Analysis Platform, select the Resources → Active services section.
- Select the collector that is configured to receive events from the Open Single Management Platform server and click the Go to Events button.
This opens a new browser tab with the Events section of Kaspersky Unified Monitoring and Analysis Platform. The table displays events from the Open Single Management Platform server. The status of the tasks can be seen in the Name column.
Open Single Management Platform event fields:
- Name—status or type of the task.
- Message—message about the task or event.
- FlexString<number>Label—name of the attribute received from Open Single Management Platform. For example,
FlexString1Label=TaskName. - FlexString<number>—value of the FlexString<number>Label attribute. For example,
FlexString1=Download updates. - DeviceCustomNumber<number>Label—name of the attribute related to the task state. For example,
DeviceCustomNumber1Label=TaskOldState. - DeviceCustomNumber<number>—value related to the task state. For example,
DeviceCustomNumber1=1means the task is executing. - DeviceCustomString<number>Label—name of the attribute related to the detected vulnerability: for example, a virus name, affected application.
- DeviceCustomString<number>—value related to the detected vulnerability. For example, the attribute-value pairs
DeviceCustomString1Label=VirusNameandDeviceCustomString1=EICAR-Test-Filemean that the EICAR test virus was detected.
KUMA logs
KUMA provides the following types of logs:
- Installer logs
- Component logs
You can also generate a report with diagnostic information about your device using the collect.sh utility. For detailed information on using the utility, please refer to the Knowledge Base.
Installer logs
KUMA automatically creates files containing logs of installation, reconfiguration, or removal.
The logs are stored in the ./log/ subdirectory in the installer directory. The name of the log file reflects the date and time when the corresponding script was started.
Names are generated in the following formats:
- Installation log: install-YYYYMMDD-HHMMSS.log. For example: install-20231031-102409.log
- Removal logs: uninstall-YYYYMMDD-HHMMSS.log. For example: uninstall-20231031-134011.log
- Reconfiguration logs: expand-YYYYMMDD-HHMMSS.log. For example: expand-20231031-105805.log
KUMA creates a new log file each time the installation, reconfiguration, or removal script is started. Log rotation or automatic deletion is not performed.
The log incorporates the lines of the inventory file used when the corresponding command was invoked, and the ansible log. For each task, the following information is listed in this order: task start time (Tuesday, October 31, 2023 10:29:14 +0300), run time of the previous task (0:00:02.611), and the total time passed since the installation, reconfiguration, or removal was initiated (0:04:56.906).
Example:
TASK [Add columns to the replicated table] ***************************************
Tuesday, October 31, 2023 10:29:14 +0300 (0:00:02.611) 0:04:56.906 *******
Component logs
By default, only errors are logged for all KUMA components. To receive detailed data in logs, configure Debug mode in the component settings.
The Core logs are stored in the /opt/kaspersky/kuma/core/00000000-0000-0000-0000-000000000000/log/core directory and are archived when they reach the size of 5 GB or the age of 7 days, whichever occurs first. These conditions are checked once daily. Archives are kept in the log folder for 7 days, after 7 days the archive is deleted. A maximum of four archived logs are stored on the server at the same time. Whenever a new log archive is created, if the total number of archives becomes greater than four, the oldest log archive is deleted. If the logs fill up quickly, you must have enough disk space to create a copy of the log file and archive it as part of log rotation.
The component logs are appended until the file reaches 5 GB. When the log reaches 5 GB, it is archived and new events are written to a new log. Archives are kept in the log folder for 7 days, after 7 days the archive is deleted. A maximum of four archived logs are stored on the server at the same time. Whenever a new log archive is created, if the total number of archives becomes greater than four, the oldest log archive is deleted.
Debug mode is available for the following components:
Core |
To enable it: in the KUMA Console, select Settings → Other → Core settings → Debug. Storage location: /opt/kaspersky/kuma/core/00000000-0000-0000-0000-000000000000/log/core You can download the Core logs from the KUMA Console, in the Resources → Active services section by selecting the Core service and clicking Log. If KUMA is installed in a high availability configuration, refer to the Viewing Core logs in Kubernetes section below. |
Services:
|
To enable it, use the Debug toggle switch in the settings of the service. Storage location: the service installation directory. For example, /opt/kaspersky/kuma/<service name>/<service ID>/log/<service name>. You can download the service logs from the KUMA Console, in the Resources → Active services section by selecting the desired service and clicking Log. Logs residing on Linux machines can be viewed by running the journalctl and tail command. For example:
|
Resources:
|
To enable it, use the Debug toggle switch in the settings of the service to which the resource is linked. The logs are stored on the machine hosting the installed service that uses the relevant resource. Detailed data for resources can be viewed in the log of the service linked to a resource. |
Viewing Core logs in Kubernetes
When Core log files reach 100 MB, they are archived and a new log is written. No more than five files are stored at a time. If there are more than five files when a new log appears, the oldest file is deleted.
On worker nodes, you can view the logs of containers and pods residing on these nodes in the file system of the node.
For example:
/var/log/pods/kuma_core-deployment-<UID>/core/*.log
/var/log/pods/kuma_core-deployment-<UID>/mongodb/*.log
To view the logs of all containers in the Core pod:
k0s kubectl logs -l app=core --all-containers -n kuma
To view the log of a specific container:
k0s kubectl logs -l app = core -c <container_name> -n kuma
To enable real-time log viewing, add the -f switch:
k0s kubectl logs -f -l app=core --all-containers -n kuma
To view the logs of the previous pod that was overwritten by a new one (for example, when recovering from a critical error or after redeployment), add the --previous switch:
k0s kubectl logs -l app=core -c core -n kuma --previous
To access the logs from other hosts that are not included in the cluster, you need the k0s-kubeconfig.yml file containing the access credentials created during KUMA installation, and the locally installed kubectl cluster management utility.
The cluster controller or traffic balancer specified in the server parameter of the k0s-kubeconfig.yml file must be accessible over the network.
The file path must be exported to a variable: export KUBECONFIG=/<file path>/k0s-kubeconfig.yml
You can use kubeclt to view the logs. For example:
kubectl logs -l app=core -c mongodb -n kuma
KUMA notifications
Standard notifications
KUMA can be configured to send email notifications using an SMTP server. To do so, configure a connection to an SMTP server and select the Receive email notifications check box. Only a user with the General administrator role can receive email notifications.
If the Receive email notifications check box is selected for a user with the General administrator role, after enabling the setting, an email notification is sent to the user every 6 hours in accordance with the following rule:
- If at least one server has a non-empty Warning field at the time scheduled for sending the message, the message is sent.
- One message is sent for all services with the yellow status. If no services have the yellow status, no message is sent.
The 6-hour interval is respected unless the KUMA Core is restarted. After each restart of the Core, the 6-hour interval is reset.
KUMA automatically notifies users about the following events:
- A report was created (the users listed in the report template receive a notification).
- An alert was created (all users receive a notification).
- An alert was assigned to a user (the user to whom the alert was assigned receives a notification).
- A task was performed (the users who created the task receive a notification).
- New resource packages are available. They can be obtained by updating the KUMA repository (the users whose email address is specified in the task settings are notified).
- The daily average EPS has exceeded the limit set by the license.
- The hourly average EPS has exceeded the limit set by the SMB license.
Custom notifications
Instead of the standard KUMA notifications about the alert generation, you can send notifications based on custom templates. To configure custom notifications instead of standard notifications, take the following steps:
- Create an email template.
- Create a notification rule that specifies the correlation rules and email addresses.
When an alert is created based on the selected correlation rules, notifications created based on custom email templates will be sent to the specified email addresses. Standard KUMA notifications about the same event will not be sent to the specified addresses.
Page top
Working with geographic data
A list of mappings of IP addresses or ranges of IP addresses to geographic data can be uploaded to KUMA for use in event enrichment.
Geodata format
Geodata can be uploaded to KUMA as a CSV file in UTF-8 encoding. A comma is used as the delimiter. The first line of the file contains the field headers: Network,Country,Region,City,Latitude,Longitude.
CSV file description
Field header name in CSV |
Field description |
Example |
|
IP address in one of the following formats:
Mixing of IPv4 and IPv6 addresses is allowed. Required field. |
|
|
Country designation used by your organization. For example, this could be its name or code. Required field. |
|
|
Region designation used by your organization. For example, this could be its name or code. |
|
|
City designation used by your organization. For example, this could be its name or code. |
|
|
Latitude of the described location in decimal format. This field can be empty, in which case the value 0 will be used when importing data into KUMA. |
|
|
Longitude of the described location in decimal format. This field can be empty, in which case the value 0 will be used when importing data into KUMA. |
|
Converting geographic data from MaxMind to IP2Location
Geographic data obtained from MaxMind and IP2Location can be used in KUMA if the data files are first converted to a format supported by KUMA. Conversion can be done using the script below. Make sure that the files do not contain duplicate records. For example, if a file has few columns, different records may contain data from the same network with the same geodata. Such files cannot be converted. To successfully perform the conversion, make sure that there are no duplicate rows and that every row has at least one unique field.
Python 2.7 or later is required to run the script.
Script start command:
python converter.py --type <type of geographic data being processed: "maxmind" or "ip2location"> --out <directory where a CSV file containing geographic data in KUMA format will be placed> --input <path to the ZIP archive containing geographic data from MaxMind or IP2location>
When the script is run with the --help flag, help is displayed for the available script parameters: python converter.py --help
Command for converting a file containing a Russian database of IP address ranges from a MaxMind ZIP archive:
python converter.py --type maxmind --lang ru --input MaxMind.zip --out geoip_maxmind_ru.csv
If the --lang parameter is not specified, the script receives information from the GeoLite2-City-Locations-en.csv file from the ZIP archive by default.
Absence of the --lang parameter for MaxMind is equivalent to the following command:
python converter.py --type maxmind --input MaxMind.zip --out geoip_maxmind.csv
Command for converting a file from an IP2Location ZIP archive:
python converter.py --type ip2location --input IP2LOCATION-LITE-DB11.CSV.ZIP --out geoip_ip2location.csv
Command for converting a file from several IP2Location ZIP archives:
python converter.py --type ip2location --input IP2LOCATION-LITE-DB11.CSV.ZIP IP2LOCATION-LITE-DB11.IPV6.CSV.ZIP --out geoip_ip2location_ipv4_ipv6.csv
The --lang parameter is not used for IP2Location.
Required sets of fields
The MaxMind source files GeoLite2-City-Blocks-IPv4.csv and GeoLite2-City-Blocks-IPv6.csv must contain the following set of fields:
network,geoname_id,registered_country_geoname_id,represented_country_geoname_id,
is_anonymous_proxy,is_satellite_provider,postal_code,latitude,longitude,accuracy_radius
Example set of source data:
network,geoname_id,registered_country_geoname_id,represented_country_geoname_id,is_anonymous_proxy,is_satellite_provider,postal_code,latitude,longitude,accuracy_radius
1.0.0.0/24,2077456,2077456,,0,0,,-33.4940,143.2104,1000
1.0.1.0/24,1814991,1814991,,0,0,,34.7732,113.7220,1000
The remaining CSV files with the locale code must contain the following set of fields:
geoname_id,locale_code,continent_code,continent_name,country_iso_code,country_name,
subdivision_1_iso_code,subdivision_1_name,subdivision_2_iso_code,subdivision_2_name,
city_name,metro_code,time_zone,is_in_european_union
Example set of source data:
geoname_id,locale_code,continent_code,continent_name,country_iso_code,country_name,subdivision_1_iso_code,subdivision_1_name,subdivision_2_iso_code,subdivision_2_name,city_name,metro_code,time_zone,is_in_european_union
1392,de,AS,Asien,IR,Iran,02,Mazandaran,,,,,Asia/Tehran,0
7240,de,AS,Asien,IR,Iran,28,Nord-Chorasan,,,,,Asia/Tehran,0
The source IP2Location files must contain data on the network ranges, Country, Region, City, Latitude, and Longitude
Example set of source data:
"0","16777215","-","-","-","-","0.000000","0.000000","-","-"
"16777216","16777471","US","United States of America","California","Los Angeles","34.052230","-118.243680","90001","-07:00"
"16777472","16778239","CN","China","Fujian","Fuzhou","26.061390","119.306110","350004","+08:00"
If the source files contain a different set of fields than the one indicated in this section, or if some fields are missing, the missing fields in the target CSV file will be empty after conversion.
Page top
Importing and exporting geographic data
If necessary, you can manually import and export geographic data into KUMA. Geographic data is imported and exported in a CSV file. If the geographic data import is successful, the previously added data is overwritten and an audit event is generated in KUMA.
To import geographic data into KUMA:
- Prepare a CSV file containing geographic data.
Geographic data received from MaxMind and IP2Location must be converted to a format supported by KUMA.
- In the KUMA Console, open Settings → Other.
- In the Geographic data settings block, click the Import from file button and select a CSV file containing geographic data.
Wait for the geographic data import to finish. The data import is interrupted if the page is refreshed.
The geographic data is uploaded to KUMA.
To export geographic data from KUMA:
- In the KUMA Console, open Settings → Other.
- In the Geographic data settings block, click the Export button.
Geographic data will be downloaded as a CSV file named geoip.csv (in UTF-8 encoding) based on the settings of your browser.
The data is exported in the same format as it was uploaded, with the exception of IP address ranges. If a range of addresses was indicated in the format 1.0.0.0/24 in a file imported into KUMA, the range will be displayed in the format 1.0.0.0-1.0.0.255 in the exported file.
Default mapping of geographic data
If you select the SourceAddress, DestinationAddress and DeviceAddress event fields as the IP address source when configuring a geographic data enrichment rule, the Apply default mapping button becomes available. You can use this button to add preconfigured mapping pairs of geographic data attributes and event fields as described below.
Default mappings for the SourceAddress event field
Geodata attribute |
Event field |
Country |
|
Region |
|
City |
|
Latitude |
|
Longitude |
|
Default mappings for the DestinationAddress event field
Geodata attribute |
Event field |
Country |
|
Region |
|
City |
|
Latitude |
|
Longitude |
|
Default mappings for the DeviceAddress event field
Geodata attribute |
Event field |
Country |
|
Region |
|
City |
|
Latitude |
|
Longitude |
|
KUMA resources
Resources are KUMA components that contain parameters for implementing various functions: for example, establishing a connection with a given web address or converting data according to certain rules. Like parts of an erector set, these components are assembled into resource sets for services that are then used as the basis for creating KUMA services.
Resources are contained in the Resources section, Resources block of KUMA Console. The following resource types are available:
- Correlation rules—resources of this type contain rules for identifying event patterns that indicate threats. If the conditions specified in these resources are met, a correlation event is generated.
- Normalizers—resources of this type contain rules for converting incoming events into the format used by KUMA. After processing in the normalizer, the raw event becomes normalized and can be processed by other KUMA resources and services.
- Connectors—resources of this type contain settings for establishing network connections.
- Aggregation rules—resources of this type contain rules for combining several basic events of the same type into one aggregation event.
- Enrichment rules—resources of this type contain rules for supplementing events with information from third-party sources.
- Destinations—resources of this type contain settings for forwarding events to a destination for further processing or storage.
- Filters—resources of this type contain criteria for selecting individual events from the event stream to be sent to processing.
- Response rules—resources of this type are used in correlators to, for example, execute scripts or launch Open Single Management Platform tasks when certain conditions are met.
- Data collection and analysis rules—resources of this type contain rules that allow scheduling SQL queries with aggregation functions to the storage. Data received from SQL queries is then used for correlation.
- Notification templates—resources of this type are used when sending notifications about new alerts.
- Active lists—resources of this type are used by correlators for dynamic data processing when analyzing events according to correlation rules.
- Dictionaries—resources of this type are used to store keys and their values, which may be required by other KUMA resources and services.
- Proxies—resources of this type contain settings for using proxy servers.
- Secrets—resources of this type are used to securely store confidential information (such as credentials) that KUMA needs to interact with external services.
When you click on a resource type, a window opens displaying a table with the available resources of this type. The table contains the following columns:
You can configure the set of columns for the table and their order, as well as configure the display of information in some columns:
- You can show or hide columns in the menu that you can open by clicking the icon in the toolbar in the upper part of the table.
- You can reorder the columns by dragging column headings to the left or right.
- You can configure the display of information in a column by clicking the
 icon in the heading of the column.
- Name—the name of the resource. Can be used to search for resources and sort them.
- Updated—the date and time of the last update of a resource. Can be used to sort resources.
- Created by—the name of the user who created a resource.
- Description—the description of a resource.
- Type—the type of the resource. Displayed for all types of resources, except Aggregation rules, Enrichment rules, Data collection and analysis rules, Filters, Active lists, Proxies.
- Resource path—address in the resource tree. Displayed in the tree of folders, starting from the tenant in which the resource was created.
- Tags—tags assigned to the resource. A resource can have more than one tag.
Tags are part of the resource and are imported with the resource.
- Package name—the name of the package in which the resource was imported from the repository.
- Correlator—the list of correlators to which the correlation rule is linked. Displayed only for resources of the Correlation rule type.
- MITRE techniques—the MITRE matrix techniques that this correlation rule covers. Displayed only for resources of the Correlation rule type. When you hover over a value, the name of the rule is displayed.
The maximum table size is not limited. If you want to select all resources, scroll to the end of the table and select the Select all check box, which selects all available resources in the table.
The table of resources in the lower part displays the number of resources from tenants that are available to you in the table:
- Total is the total amount or the amount with the filter or search applied.
- Selected is the number of selected resources.
When filters are applied, the resource selection and the Selected value are reset. If the amount of resources changes due to the actions (for example, deletion) undertake by another user, the displayed number of resources changes after you refresh the page, perform an action with the resource, or apply a filter.
Resources can be organized into folders. The folder structure is displayed in the left part of the window: root folders correspond to tenants and contain a list of all resources of the tenant. All other folders nested within the root folder display the resources of an individual folder. When a folder is selected, the resources it contains are displayed as a table in the right pane of the window.
Resources can be created, edited, copied, moved from one folder to another, and deleted. Resources can also be exported and imported.
KUMA comes with a set of predefined resources, which can be identified by the "[OOTB]<resource_name>" name. OOTB resources are protected from editing.
If you want to adapt a predefined OOTB resource to your organization's infrastructure:
- In the Resources-<resource type> section, select the OOTB resource that you want to edit.
- In the upper part of the KUMA Console, click Duplicate, then click Save.
- A new resource named "[OOTB]<resource_name> - copy" is displayed in the web interface.
- Edit the copy of the predefined resource as necessary and save your changes.
The adapted resource is available for use.
Operations with resources
To manage Kaspersky Unified Monitoring and Analysis Platform resources, you can create, move, copy, edit, delete, import, and export them. These operations are available for all resources, regardless of the resource type.
The table of resources in the lower part displays the number of resources from tenants that are available to you in the table:
- Total is the total amount or the amount with the filter or search applied.
- Selected is the number of selected resources.
When filters are applied, the resource selection and the Selected value are reset. If the amount of resources changes due to the actions (for example, deletion) undertake by another user, the displayed number of resources changes after you refresh the page, perform an action with the resource, or apply a filter.
Kaspersky Unified Monitoring and Analysis Platform resources are arranged in folders. You can add, rename, move, or delete resource folders.
Creating, renaming, moving, and deleting resource folders
Resources can be organized into folders. The folder structure is displayed in the left part of the window: root folders correspond to tenants and contain a list of all resources of the tenant. All other folders nested within the root folder display the resources of an individual folder. When a folder is selected, the resources it contains are displayed as a table in the right pane of the window.
You can create, rename, move and delete folders.
To create a folder:
- Select the folder in the tree where the new folder is required.
- Click the Add folder button.
The folder will be created.
To rename a folder:
- Locate required folder in the folder structure.
- Hover over the name of the folder.
The
icon will appear near the name of the folder. - Open the drop-down list and select Rename.
The folder name will become active for editing.
- Enter the new folder name and press ENTER.
The folder name cannot be empty.
The folder will be renamed.
To move a folder,
Drag and drop the folder to a required place in folder structure by clicking its name.
Folders cannot be dragged from one tenant to another.
To delete a folder:
- Select the relevant folder in the folder structure.
- Right-click to bring up the context menu and select Delete.
The conformation window appears.
- Click OK.
The folder will be deleted.
The program does not delete folders that contain files or subfolders.
Page top
Creating, duplicating, moving, editing, and deleting resources
You can create, move, copy, edit, and delete resources.
To create the resource:
- In the Resources → <resource type> section, select or create a folder where you want to add the new resource.
Root folders correspond to tenants. For a resource to be available to a specific tenant, it must be created in the folder of that tenant.
- Click the Add <resource type> button.
The window for configuring the selected resource type opens. The available configuration parameters depend on the resource type.
- Enter a unique resource name in the Name field.
- Specify the required parameters (marked with a red asterisk).
- If necessary, specify the optional parameters (not required).
- Click Save.
The resource will be created and available for use in services and other resources.
To move the resource to a new folder:
- In the Resources → <resource type> section, find the required resource in the folder structure.
- Select the check box near the resource you want to move. You can select multiple resources.
The
icon appears near the selected resources. The number of selected resources is displayed in the lower part of the table. - Use the icon to drag and drop resources to the required folder.
The resources will be moved to the new folders.
You can only move resources to folders of the tenant in which the resources were created. Resources cannot be moved to another tenant's folders.
To copy the resource:
- In the Resources → <resource type> section, find the required resource in the folder structure.
- Select the check box next to the resource that you want to copy and click Duplicate.
The number of selected resources is displayed in the lower part of the table.
A window opens with the settings of the resource that you have selected for copying. The available configuration parameters depend on the resource type.
The
<selected resource name> - copyvalue is displayed in the Name field. - Make the necessary changes to the parameters.
- Enter a unique name in the Name field.
- Click Save.
The copy of the resource will be created.
To edit the resource:
- In the Resources → <resource type> section, find the required resource in the folder structure.
- Select the resource.
A window with the settings of the selected resource opens. The available configuration parameters depend on the resource type.
- Make the necessary changes to the parameters.
- Do one of the following:
- Click Save to save your changes.
- Click Save with a comment, and in the displayed window, add a comment that describes your changes. The changes are saved and the comment is added to the created version of the resource.
The resource is updated and a new version is created for it. If this resource is used in a service, restart the service to apply the new version of the resource.
If the current resource is not editable (for example, you cannot edit a correlation rule), you can go to the card of another resource by clicking the View button. This button becomes available in batch resources when you click another resource linked to your current resource.
If, when saving changes to a resource, it turns out that the current version of the resource has been modified by another user, you are prompted to select one of the following actions:
- Save your changes as a new version of the resource on top of the changes made by the other user.
- Save your changes as a new resource.
In this case, a duplicate of the original resource is created with the changed settings. The "- copy" string is added to the name of the new resource, and the name and version of the resource that was duplicated is specified in the version comments of the new resource.
- Discard your changes.
Discarded changes cannot be restored.
To delete the resource:
- In the Resources → <resource type> section, find the required resource in the folder structure.
- Select the check box next to the resource that you want to delete and click Delete.
The number of selected resources is displayed in the lower part of the table. A confirmation window opens.
- Click OK.
The resource and all its saved versions are deleted.
Page top
Bulk deletion of resources
In the KUMA Console, you can select multiple resources and delete them.
You must have the right to delete resources.
To delete resources:
- In the Resources → <resource type> section, find the required resource in the folder structure.
- Select the check boxes next to the resources that you want to delete.
In the lower part of the table, you can see the total number of resources and the number of resources selected.
- Click Delete.
This opens a window that tells you whether it is safe to delete resources, depending on whether the resources selected for deletion are linked to other resources.
For all resources that cannot be deleted, the application displays a table of links in a modal window.
- Click Delete.
Only resources without links are deleted.
Deleting folders with resources
You can select the delete operation for any folder at any level, except the tenant.
To delete a folder with resources:
- In the Resources section, select a folder.
- Click the
 button and select the Delete option.
This opens a window prompting you to confirm deletion. The window displays a field in which you can enter the generated value. Also, if dependent resources exist in the folder, a list of dependencies is displayed.
- Enter the generated value.
- Confirm the deletion.
You can delete a folder if:
- The folder does not contain any subfolders or resources.
- The folder does not contain any subfolders, but does contain unlinked resources.
- None of the resources in the folder are dependencies of anything (services, resources, integrations).
Link correlators to a correlation rule
The Link correlators option is available for the created correlation rules.
To link correlators:
- In the KUMA web interface → Resources → Correlation rules section, select the created correlation rule and go to the Correlators tab.
- This opens the Correlators window; in that window, select one or more correlators by selecting the check box next to them.
- Click OK.
Correlators are linked to a correlation rule.
The rule is added to the end of the execution queue in each selected correlator. If you want to move the rule up in the execution queue, go to Resources → Correlators → <selected correlator> → Edit correlator → Correlation, select the check box next to the relevant rule and use the Move up or Move down buttons to reorder the rules as necessary.
Page top
Updating resources
Kaspersky regularly releases packages with resources that can be imported from the repository. You can specify an email address in the settings of the Repository update task. After the first execution of the task, KUMA starts sending notifications about the packages available for update to the specified address. You can update the repository, analyze the contents of each update, and decide if to import and deploy the new resources in the operating infrastructure. KUMA supports updates from Kaspersky servers and from custom sources, including offline update using the update mirror mechanism. If you have other Kaspersky products in the infrastructure, you can connect KUMA to existing update mirrors. The update subsystem expands KUMA capabilities to respond to the changes in the threat landscape and the infrastructure. The capability to use it without direct Internet access ensures the privacy of the data processed by the system.
To update resources, perform the following steps:
- Update the repository to deliver the resource packages to the repository. The repository update is available in two modes:
- Automatic update
- Manual update
- Import the resource packages from the updated repository into the tenant.
For the service to start using the resources, make sure that the updated resources are mapped after performing the import. If necessary, link the resources to collectors, correlators, or agents, and update the settings.
To enable automatic update:
- In the Settings → Repository update section, configure the Data refresh interval in hours. The default value is 24 hours.
- Specify the Update source. The following options are available:
- .
You can view the list of update servers in the Knowledge Base.
- Custom source:
- The URL to the shared folder on the HTTP server.
- The full path to the local folder on the host where the KUMA Core is installed.
If a local folder is used, the kuma system user must have read access to this folder and its contents.
- .
- If necessary, in the Proxy server list, select an existing proxy server to be used when running the Repository update task.
You can also create a new proxy server by clicking on the
button. - Specify the Emails for notification by clicking the Add button. The notifications that new packages or new versions of the packages imported into the tenant are available in the repository are sent to the specified email addresses.
If you specify the email address of a KUMA user, the Receive email notifications check box must be selected in the user profile. For emails that do not belong to any KUMA user, the messages are received without additional settings. The settings for connecting to the SMTP server must be specified in all cases.
- Click Save. The update task starts shortly. Then the task restarts according to the schedule.
To manually start the repository update:
- To disable automatic updates, in the Settings → Repository update section, select the Disable automatic update check box. This check box is cleared by default. You can also start a manual repository update without disabling automatic update. Starting an update manually does not affect the automatic update schedule.
- Specify the Update source. The following options are available:
- Kaspersky update servers.
- Custom source:
- The URL to the shared folder on the HTTP server.
- The full path to the local folder on the host where the KUMA Core is installed.
If a local folder is used, the kuma user must have access to this folder and its contents.
- If necessary, in the Proxy server list, select an existing proxy server to be used when running the Repository update task.
You can also create a new proxy server by clicking on the
button. - Specify the Emails for notification by clicking the Add button. The notifications that new packages or new versions of the packages imported into the tenant are available in the repository are sent to the specified email addresses.
If you specify the email address of a KUMA user, the Receive email notifications check box must be selected in the user profile. For emails that do not belong to any KUMA user, the messages are received without additional settings. The settings for connecting to the SMTP server must be specified in all cases.
- Click Run update. Thus, you simultaneously save the settings and manually start the Repository update task.
Configuring a custom source using Kaspersky Update Utility
You can update resources without Internet access by using a custom update source via the Kaspersky Update Utility.
Configuration consists of the following steps:
- Configuring a custom source using Kaspersky Update Utility:
- Installing and configuring Kaspersky Update Utility on one of the computers in the corporate LAN.
- Configuring copying of updates to a shared folder in Kaspersky Update Utility settings.
- Configuring update of the KUMA repository from a custom source.
Configuring a custom source using Kaspersky Update Utility:
You can download the Kaspersky Update Utility distribution kit from the Kaspersky Technical Support website.
- In Kaspersky Update Utility, enable the download of updates for KUMA 2.1:
- Under Applications – Perimeter control, select the check box next to KUMA 2.1 to enable the update capability.
- If you work with Kaspersky Update Utility using the command line, add the following line to the [ComponentSettings] section of the updater.ini configuration file or specify the
truevalue for an existing line:KasperskyUnifiedMonitoringAndAnalysisPlatform_3_4=true
- In the Downloads section, specify the update source. By default, Kaspersky update servers are used as the update source.
- In the Downloads section, in the Update folders group of settings, specify the shared folder for Kaspersky Update Utility to download updates to. The following options are available:
- Specify the local folder on the host where Kaspersky Update Utility is installed. Deploy the HTTP server for distributing updates and publish the local folder on it. In KUMA, in the Settings → Repository update → Custom source section, specify the URL of the local folder published on the HTTP server.
- Specify the local folder on the host where the Kaspersky Update Utility is installed. Make this local folder available over the network. Mount the network-accessible local folder on the host where KUMA is installed. In KUMA, in the Settings → Repository update → Custom source section, specify the full path to the local folder.
For detailed information about working with Kaspersky Update Utility, refer to the Kaspersky Knowledge Base.
Page top
Exporting resources
If shared resources are hidden for a user, the user cannot export shared resources or resources that use shared resources.
To export resources:
- In the Resources section, click Export resources.
The Export resources window opens with the tree of all available resources.
- In the Password field enter the password that must be used to protect exported data.
- In the Tenant drop-down list, select the tenant whose resources you want to export.
- Check boxes near the resources you want to export.
If selected resources are linked to other resources, linked resources will be exported, too. The number of selected resources is displayed in the lower part of the table.
- Click the Export button.
Current versions of resources in a password-protected file are saved on your computer in accordance with your browser settings. Previous versions of the resources are saved in the file. The Secret resources are exported blank.
To export a previous version of a resource:
- In the KUMA Console, in the Resources section, select the type of resources that you need.
This opens a window opens with a table of available resources of this type.
If you want to view all resources, in the Resources section, go to the List tab.
- Select the check box for the resource whose change history you want to view, and click the Show version history button in the upper part of the table.
This opens the window with the version history of the resource.
- Click the row of the version that you want to export and click the Export button in the lower part of the displayed window.
You can only export a previous version of a resource. The Export button is not displayed when the current version of the resource is selected.
The resource version is saved in a JSON file on your computer in accordance with your browser settings.
Page top
Importing resources
In KUMA 3.4, we recommended using resources from the "[OOTB] KUMA 3.4 resources" package and resources published in the repository after the release of this package.
To import resources:
- In the Resources section, click Import resources.
The Resource import window opens.
- In the Tenant drop-down list, select the tenant to assign the imported resources to.
- In the Import source drop-down list, select one of the following options:
- File
If you select this option, enter the password and click the Import button.
- Repository
If you select this option, a list of packages available for import is displayed. We recommend you to ensure that the repository update date is relatively recent and configure automatic updates if necessary.
You can select one or more packages to import and click the Import button. The dependent resources of the Shared tenant are imported into the Shared tenant, the rest of the resources are imported into the selected tenant. You do not need special rights for the Shared tenant; you must only have the right to import in the selected tenant.
Imported resources marked as "This resource is a part of the package. You can delete it, but it is impossible to edit." can only be deleted. To rename, edit or move an imported resource, make a copy of the resource using the Duplicate button and perform the desired actions with the resource copy. When importing future versions of the package, the duplicate is not updated because it is a separate object.
Imported resources in the "Integration" directory can be edited; such resources are marked as "This resource is a part of the package". A Dictionary of the "Table" type can be added to the batch resource located in the "Integration" directory; adding other resources is not allowed. When importing future versions of the package, the edited resource will not be replaced with the corresponding resource from the package, which allows you to keep the changes you made.
- File
- Resolve the conflicts between the resources imported from the file and the existing resources if they occur. Read more about resource conflicts below.
- If the name, type, and guid of an imported resource fully match the name, type, and guid of an existing resource, the Conflicts window opens with the table displaying the type and the name of the conflicting resources. Resolve displayed conflicts:
- To replace the existing resource with a new one, click Replace.
To replace all conflicting resources, click Replace all.
- To leave the existing resource, click Skip.
For dependent resources, that is, resources that are associated with other resources, the Skip option is not available; you can only Replace dependent resources.
To keep all existing resources, click Skip all.
- To replace the existing resource with a new one, click Replace.
- Click the Resolve button.
The resources are imported to KUMA. The Secret resources are imported blank.
- If the name, type, and guid of an imported resource fully match the name, type, and guid of an existing resource, the Conflicts window opens with the table displaying the type and the name of the conflicting resources. Resolve displayed conflicts:
Importing resources that use the extended event schema
If you import a normalizer that uses one or more fields of the extended event schema, KUMA automatically creates an extended schema field that is used in the normalizer.
If you import other types of resources that use fields of the extended event schema in their logic, the resources are imported successfully. To make sure the imported resources work as intended, you need to create the corresponding extended schema fields in the Settings → Extended event schema fields section or import a normalizer that uses the required fields.
If a normalizer that uses an extended event schema field is imported into KUMA and the same field already exists in KUMA, the previously created field is used.
If a normalizer is imported into KUMA that uses an extended event schema field that does not meet the KUMA requirements, the import is completed, but the extended event schema field is created with the Disabled status and you cannot use this field in other normalizers and resources. An extended event schema field runs afoul of requirements if, for example, its name contains special characters or spaces. If you want to use such a field that does not meet the requirements, you need to fix its problems (for example, by renaming it) and then enable the field.
About conflict resolving
When resources are imported into KUMA from a file, they are compared with existing resources; the following parameters are compared:
- Name and kind. If an imported resource's name and kind parameters match those of the existing one, the imported resource's name is automatically changed.
- ID. If identifiers of two resources match, a conflict appears that must be resolved by the user. This could happen when you import resources to the same KUMA server from which they were exported.
When resolving a conflict you can choose either to replace existing resource with the imported one or to keep exiting resource, skipping the imported one.
In this case, if a conflict occurs, the imported resource is added as a new version of the existing resource. An "imported resource" comment is added to this version.
Some resources are linked: for example, in some types of connectors, the connector secret must be specified. The secrets are also imported if they are linked to a connector. Such linked resources are exported and imported together.
Special considerations of import:
- Resources are imported to the selected tenant.
- If a linked resource was in the Shared tenant, it ends up in the Shared tenant when imported.
- In the Conflicts window, the Parent column always displays the top-most parent resource among those that were selected during import.
- If a conflict occurs during import and you choose to replace existing resource with a new one, it would mean that all the other resources linked to the one being replaced are automatically replaced with the imported resources.
Known errors:
- The linked resource ends up in the tenant specified during the import, and not in the Shared tenant, as indicated in the Conflicts window, under the following conditions:
- The linked resource is initially in the Shared tenant.
- In the Conflicts window, you select Skip for all parent objects of the linked resource from the Shared tenant.
- You leave the linked resource from the Shared tenant for replacement.
- After importing, the categories do not have a tenant specified in the filter under the following conditions:
- The filter contains linked asset categories from different tenants.
- Asset category names are the same.
- You are importing this filter with linked asset categories to a new server.
- In Tenant 1, the name of the asset category is duplicated under the following conditions:
- in Tenant 1, you have a filter with linked asset categories from Tenant 1 and the Shared tenant.
- The names of the linked asset categories are the same.
- You are importing such a filter from Tenant 1 to the Shared tenant.
- You cannot import conflicting resources into the same tenant.
The error "Unable to import conflicting resources into the same tenant" means that the imported package contains conflicting resources from different tenants and cannot be imported into the Shared tenant.
Solution: Select a tenant other than Shared to import the package. In this case, during the import, resources originally located in the Shared tenant are imported into the Shared tenant, and resources from the other tenant are imported into the tenant selected during import.
- Only the general administrator can import categories into the Shared tenant.
The error "Only the general administrator can import categories into the Shared tenant" means that the imported package contains resources with linked shared asset categories. You can see the categories or resources with linked shared asset categories in the KUMA Core log. Path to the Core log:
/opt/kaspersky/kuma/core/log/core
Solution. Choose one of the following options:
- Do not import resources to which shared categories are linked: clear the check boxes next to the relevant resources.
- Perform the import under a General administrator account.
- Only the general administrator can import resources into the Shared tenant.
The error "Only the general administrator can import resources into the Shared tenant" means that the imported package contains resources with linked shared resources. You can see the resources with linked shared resources in the KUMA Core log. Path to the Core log:
/opt/kaspersky/kuma/core/log/core
Solution. Choose one of the following options:
- Do not import resources that have linked resources from the Shared tenant, and the shared resources themselves: clear the check boxes next to the relevant resources.
- Perform the import under a General administrator account.
Tag management
To help manage resources, the KUMA Console lets you add tags to resources. You can use tags to search for a component, as well as manage tags, link or unlink tags.
You cannot add tags to resources that are created from the interface of other resources. Tags can be added only from the resource's own card. You also cannot add tags to a resource that is not editable.
Tag management
The list of tags is displayed in the Settings → Tags section and is displayed as a table with the following columns: Name, Tenant, Used in resources.
In the Tags table, you can:
- Sort tags by Name, Used in resources fields.
- Filter by values of the Tenant field.
- Find a tag by the Name field.
- Go to the list of resources that have the selected tag.
Adding a tag
To add a tag:
- Go to the Resources section and select a resource.
- In the panel above the table, click Add.
- In the Tags field of the selected resource, add a new tag, or select a tag from the list.
- Click Create.
The new tag is added.
You can also add tags from existing ones.
When adding a tag, keep in mind the following special considerations:
- You can add multiple tags.
- A tag can contain characters of various alphabets (for example, Cyrillic, Latin, or Greek characters), numerals, underscores, and spaces.
- A tag may not contain any special characters other than the underscore and the space.
- You can enter the tag in uppercase or lowercase, but after saving, the tag is always displayed in lowercase.
- The tag inherits the tenant of the resource in which it is used.
- A tag is part of a resource and exists as long as the resource exists in which the tag was created or is used.
- Tags are unique within a tenant.
- Tags are imported or exported together with the resource as part of the resource.
Searching by tags
In the Resources section, you can search for resources:
- By tags
- By resource name
The search is performed across all resource types and services.
The search results display a list of resources and services.
To find resources by tags:
- Go to the Resources section and select a resource.
- In the table of the resource, select the Tags column.
- In the Search field that is displayed, enter or select a tag name.
Displays a list of resources if the specified tag is used in those resources.
In the list of resources, you can:
- Sort the list by name and type of resource or service.
- Filter resources or services by resource or service type, or by tag.
- Link or unlink tags.
Linking and unlinking tags
To link tags to a resource or unlink tags from a resource:
- Go to the Resources section.
- Select the List tab.
- In the Name column, select the check boxes next to the relevant resources.
- In the panel above the list, select the Tags tab.
- Click the Link or Unlink button and select the tags that you want to link or unlink.
The selected tags are linked to or unlinked from the resources.
Page top
Resource usage tracing
For stable operation of KUMA, it is important to understand how some resources affect the performance of other resources, what connections exist between resources and other KUMA objects. You can visualize these interdependencies on an interactive graph in the KUMA Console.
Displaying the links of a resource on a graph
To display the relations of the selected resource:
- In the KUMA Console, in the Resources section, select a resource type.
A list of resources of the selected type is displayed.
- Select the resource that you need.
The Show dependencies button in the panel above the list of resources becomes active. On a narrow display, the button may be hidden under the
icon. - Click the Show dependencies button.
This opens the a window with the dependency graph of the selected resource. If you do not have rights to view the resource, it is marked in the graph with the
 (inaccessible resource) icon. If necessary, you can close the graph window to go back to the list of resources.
Resource dependency graph
The graph displays all relations that are formed based on the universal unique identifier (UUID) of resources used in the configuration of the resource selected for display, as well as relations of resources that have the UUID of the selected resource in their configuration. Downward links, that is, resources referenced (used) by the selected resource, are displayed down to the last level, while for upward links, that is, resources that reference the selected resource, only one level is displayed.
On the graph, you can view the dependencies of the following resources:
 Correlation rules
 Aggregation rules
 Enrichment rules
 Response rules
 Data mining rules
 Normalizers
 Connectors
 Destinations
 Filters
 Notification templates
 Active lists
 Dictionaries
 Proxy servers
 Secrets
 Context tables
 Collectors
Note that if a collector was initially selected for displaying links, "upward" links are not displayed.
 Correlators
 Storages
 Agents (autoagents)
Note that if an agent is selected for displaying links, the collector is displayed with the linked relation type only if the collector is running as a service and in the collector is correctly (fqdn+port) specified as the destination of the agent.
 Event routers
Note that if an event router was initially selected for displaying links, "upward" links are not displayed.
 Integrations
The name of the integration corresponds to the name of the tab in the Integrations section.
 Resource group
The number before the parentheses indicates the number of resources from the group displayed in the graph; the number in parentheses indicates the total number of resources in the group.
- Inaccessible resource (if you do not have the rights to view it).
Clicking a resource node lets you view the following information about the resource:
- Name
Contains a link to the resource; clicking the link opens the resource in a separate tab; this does not close the graph window.
- Type
- Path
Resource path without a link.
- Tags
- Tenant
- Package name
You can open the context menu of the resource and perform the following actions:
- Show relations of resource
The dependencies of the selected resource are displayed.
- Hide resource on graph
The selected resource is hidden. Resources at the lower level that the selected resource references are marked with "*" as having hidden links. Resources that refer to a hidden resource are marked with the
 icon as having hidden links. In this case, the graph becomes broken.
 - Hide "downward" relations of resource on graph
The selected resource remains. Only those lower-level resources that do not have any links remaining on the first higher level on the graph are hidden. Resources referenced by resources of the first (hidden) level are marked with "*" as having hidden links.
- Hide all resources of this type on graph
All resources of the selected type are hidden. This operation is applied to each resource of the selected type.
- Update resource relations
You can update the resource state if the resource was edited by another user while you were managing the graph. Only changes of visible links are displayed.
- Group
If there is no group node on the screen: the group node appears on the screen, resources of the same type as the selected resource and resources that refer to the same resource are hidden. The edges are redrawn from the group. The Group button is available only when more than 10 links to resource of the same type exist.
If there is a group node on the screen: the resource is hidden and added to the group, the edges are redrawn from the group.
Several types of relations are displayed on the graph:
- Solid line without a caption.
Represents a direct link by UUID, including the use of secrets and proxies in integrations.

- Line captioned <function_name>.
Represents using an active list in a correlation rule.

- Dotted line captioned linked.
Represents a link by URL, for example, of a destination with a collector, or of a destination with a storage.

Resources created inline are shown on the graph as a dotted line with the linked type.
We do not recommend building large dependency graphs. We recommend limiting the number of nodes to 100 nodes.
When you open the graph, the resource selected for display is highlighted with a blinking circle for some time to set it apart graphically from other resources and draw attention to it.
You can look at the map of the graph to get an idea of where you are on the graph. You can use the selector and move it to display the necessary part of the graph.
By clicking the Arrange button, you can improve the display of resources on the graph.
If you select Show links, the focus on the graph does not change, and the resources are displayed so that you do not have to return to where you started.
When you select a group node in the graph, a sidebar is displayed, in which you can hide or show the resources that are part of the group. To do so, select the check box next to the relevant resource and click the Show on graph or Hide on graph button.
The graph retains its state if you displayed something on the graph, then switched to editing a resource, and then reopened the graph tab.
The previously displayed resources on the graph remain in their places when new resources are added to the graph.
When you close the graph, all changes are discarded.
After the resource links are drawn on the graph, you can search for a node:
- By name
- By tag
- By path
- By package
Nodes, including groups that match the selection criterion, are highlighted with a yellow circle.
You can filter the graph by resource type:
- Hide or show resources of a certain type.
- Hide resources of multiple types. Display all types of resources.
With the filter window closed, you can tell the selected filters by the indicator, a red dot in the toolbar.
Your actions when managing the graph (the last 50 actions) are saved in memory; you can undo changes by pressing Ctrl/Command+Z.
You can save the displayed graph can be saved to an SVG file. The visible part of the graph is saved in the file.
Page top
Resource versioning
KUMA stores the change history of resources in the form of versions. A resource version is created automatically when you create a new resource or save changes made to the settings of an existing resource.
The change history is not available for the Dictionaries resource. To save the history of dictionaries, you can export data.
Resource versions are retained for the duration specified in the Settings section. When the age of a resource version reaches the specified value, the version is automatically deleted.
You can view the change history of KUMA resources, compare versions, and restore a previous version of a resource, for example, if it fails and you need to recover it.
To view the change history of a resource:
- In the KUMA Console, in the Resources section, select the type of resources that you need.
This opens a window opens with a table of available resources of this type.
If you want to view all resources, in the Resources section, go to the List tab.
- Select the check box for the resource whose change history you want to view, and click the Show version history button in the upper part of the table.
This opens a window with a table of saved versions of the selected resource. New resources have only one version, the current version.
For each version, the table displays the following information:
- Version is the serial number of the resource version. When you save changes to the resource and create a new version, the serial number is increased by 1.
The version with the highest number and the most recent publication date reflects the current state of the resource. Version 1 reflects the state of the resource at the moment when it was created.
- Published is the date and time when the resource version was created.
- Author is the login of the user that saved the changes to the resource.
If the changes were made by the system or by the migration script, the displayed value is system.
- Comment is a text comment added by the author when saving changes, or a system comment describing the changes made.
- Retention period is the number of days and the date after which the resource version will be deleted.
If necessary, you can configure the retention period for resource versions.
- Actions is the button that restores the resource version.
You can sort the table of resource versions by the Version, Published, and Author columns by clicking the heading and selecting Ascending or Descending. You can also display only changes made by a specific author or authors in the table by clicking the heading of the Author column and selecting the authors as needed.
If you want to view the status of a resource in a specific version, click that version in the table. This opens a window with the resource of the selected version, in which you can:
- View the settings specified in that version of the resource.
- Restore this version of the resource by clicking the Restore button.
- Export this version of the resource to a JSON file by clicking the Export button.
Comparing resource versions
You can compare any two versions of a resource, for example, if you need to track changes.
To compare versions of a resource:
- In the KUMA Console, in the Resources section, select the type of resources that you need.
This opens a window opens with a table of available resources of this type.
If you want to view all resources, in the Resources section, go to the List tab.
- Select the check box next to a resource and click the Show version history button in the upper part of the table.
This opens the window with the version history of the resource.
- Select the check boxes next to the two versions of the resource that you want to compare and click the Compare button in the upper part of the table.
This opens the resource version comparison window. Resource fields are displayed as a list or in JSON format. Differences between the two versions are highlighted. You can select other versions to compare using the drop-down lists above the resource fields.
Page top
Restoring a resource version
You can restore a previous version of a resource, for example, if you need to recover the resource in case of mistakes made when making changes.
Versions of automatically generated agents cannot be restored separately because they are created when the parent collector is modified. If you want to restore a version of an automatically generated agent, you need to restore the corresponding version of the parent collector.
To restore a previous version of a resource:
- In the KUMA Console, in the Resources section, select the type of resources that you need.
This opens a window opens with a table of available resources of this type.
If you want to view all resources, in the Resources section, go to the List tab.
- Select the check box next to a resource and click the Show version history button in the upper part of the table.
This opens the window with the version history of the resource.
- In the row of the relevant version, in the Action column, click the Restore button.
You can also restore a version by clicking the row of this version and clicking the Restore button in the lower part of the window.
You can restore only previous versions of a resource; for the current version, the Restore button is not available.
If the structure of the resource has changed after a KUMA update, restoring its saved versions may not be possible.
- Confirm the action and, if necessary, add a comment. If you do not add a comment, the "Restored from v.<number of the restored version>" comment is automatically added to the version.
The resource version is restored as a new version and become the current version.
If the resource for which you restored the version is added to the active service, this also changes the state of the service. You must restart the service to apply the resource change.
Page top
Configuring the retention period for resource versions
You can change the retention period of resource versions in the KUMA Console in the Settings → General section by changing the Resource history retention period, days setting.
The default setting is 30 days. If you want to keep all versions of resources without time limits, specify 0 (store indefinitely).
Only a user with the General administrator role can view and manage the retention period of resource versions.
The retention period of resource versions is checked daily, and versions of resources that have been stored in KUMA for longer than the specified period are automatically deleted. In the task manager, the Clear resource change history task is created to check the storage duration of resource versions and delete old versions. This task also runs after a restart of the Core component.
You can check the time remaining until a resource version is deleted in the table of versions, in the Retention period column.
Page top
Destinations
Destinations define network settings for sending normalized events. Collectors and correlators use destinations to describe where to send processed events. Typically, correlators and storages act as destinations.
You can specify destination point settings on the Basic settings and Advanced settings tabs. The available settings depend on the selected type of destination.
Destinations can have the following types:
- internal – Used for receiving data from KUMA services using the 'internal' protocol.
- nats-jetstream – Used for communication through NATS.
- tcp – Used for communication over TCP.
- http – Used for communication over the HTTP protocol.
- diode – Used to transmit events using a data diode.
- kafka – Used for kafka communications.
- file – Used for writing to a file.
- storage – Used for sending data to storage.
- correlator – Used for sending data to a correlator.
- eventRouter – Used for sending events to an event router.
Destination, internal type
Destinations of the internal typeUsed for receiving data from KUMA services using the 'internal' protocol. You can send the following data over the 'internal' protocol:
- Internal data, such as event routes.
- File attributes. If while creating the collector at the Transport step of the installation wizard, you specified a connector of the file, 1c-xml, or 1c-log type, at the Event parsing step, in the Mapping table, you can pass the name of the file being processed by the collector or the path to the file in the KUMA event field. To do this, in the Source column, specify one of the following values:
$kuma_fileSourceNameto pass the name of the file being processed by the collector in the KUMA event field.$kuma_fileSourcePathto pass the path to the file being processed by the collector in the KUMA event field.
When you use a file, 1c-xml, or 1c-log connector, the new variables in the normalizer will only work with destinations of the internal type.
- Events to the event router. The event router can only receive events over the 'internal' protocol, therefore you can only use internal destinations when sending events to the event router.
Settings for a destination of the internal type are described in the following tables.
Basic settings tab
Setting |
Description |
|---|---|
Name |
Unique name of the resource. The maximum length of the name is 128 Unicode characters. Required setting. |
Tenant |
The name of the tenant that owns the resource. Required setting. |
State |
This toggle switch enables sending events to the destination. This toggle switch is turned on by default.
|
Type |
Destination type: internal. Required setting. |
URL |
URL that you want to connect to. The following URL formats are supported:
You can add multiple URLs or remove an URL. To add an URL, click the + Add button. To remove an URL, click the delete Required setting. |
Tags |
Tags for resource search. Optional setting. |
Description |
Description of the resource. The maximum length of the description is 4000 Unicode characters. |
Advanced settings tab
Setting |
Description |
|---|---|
Buffer size |
Buffer size in bytes for accumulating events in the RAM of the server before sending them for further processing or storage. The value must be a positive integer. Default buffer size: 1,048,576 bytes (1 MB). Maximum buffer size: 67,108,864 bytes (64 MB). |
Buffer flush interval |
Interval (in seconds) for sending events to the destination. The default value is 1 second. |
Disk buffer size limit |
Size of the disk buffer in bytes. The default value is 10 GB. |
Handlers |
Number of handlers that the service can run simultaneously to process response rules in parallel. To determine the number of handlers, you can use the following formula: (<number of CPUs> / 2) + 2. The value must be a positive integer. |
Output format |
Format in which events are sent to the destination:
|
Proxy server |
The proxy server for the destination. You can select an existing proxy server or create a new proxy server. To create a new proxy server, select Create new. If you want to edit the settings of an existing proxy server, click the pencil |
URL selection policy |
Method of determining URLs to which events must be sent first if you added multiple URLs in the URL field on the Basic settings:
|
Health check timeout |
Interval, in seconds, for checking the health of the destination. |
Disk buffer disabled |
This toggle switch that enables the disk buffer. This toggle switch is turned on by default. The disk buffer is used if the collector cannot send normalized events to the destination. You can specify the size of the disk buffer in the Disk buffer size limit field. If the disk buffer runs out of free space, new normalized events will overwrite old normalized events, starting with the oldest. |
Timeout |
The time, in seconds, for which the destination waits for a response from another service or component. |
Debug |
Ths switch enables resource logging. The toggle switch is turned off by default. |
Filter |
Filter for determining which events must be processed by the resource. You can select an existing filter or create a new filter. To create a new filter, select Create new. If you want to edit the settings of an existing filter, click the pencil To create a filter:
|
Destination, type nats-jetstream
Destinations of the nats-jetstream typeUsed for communication through NATS. Settings for a destination of the nats-jetstream type are described in the following tables.
Basic settings tab
Setting |
Description |
|---|---|
Name |
Unique name of the resource. The maximum length of the name is 128 Unicode characters. Required setting. |
Tenant |
The name of the tenant that owns the resource. Required setting. |
State |
This toggle switch enables sending events to the destination. This toggle switch is turned on by default.
|
Type |
Destination type: nats-jetstream. Required setting. |
URL |
URL that you want to connect to. The following URL formats are supported:
You can add multiple URLs or remove an URL. To add an URL, click the + Add button. To remove an URL, click the delete Required setting. |
Subject |
The topic of NATS messages. Characters are entered in Unicode encoding. Required setting. |
Authorization |
Type of authorization when connecting to the URL specified in the URL field:
|
Tags |
Tags for resource search. Optional setting. |
Description |
Description of the resource. The maximum length of the description is 4000 Unicode characters. |
Advanced settings tab
Setting |
Description |
|---|---|
Buffer size |
Buffer size in bytes for accumulating events in the RAM of the server before sending them for further processing or storage. The value must be a positive integer. Default buffer size: 1,048,576 bytes (1 MB). Maximum buffer size: 67,108,864 bytes (64 MB). |
Buffer flush interval |
Interval (in seconds) for sending events to the destination. The default value is 1 second. |
Disk buffer size limit |
Size of the disk buffer in bytes. The default value is 10 GB. |
Handlers |
Number of handlers that the service can run simultaneously to process response rules in parallel. To determine the number of handlers, you can use the following formula: (<number of CPUs> / 2) + 2. The value must be a positive integer. |
Output format |
Format in which events are sent to the destination:
|
TLS mode |
TLS encryption mode. When using TLS encryption, you cannot specify an IP address in the URL field on the Basic settings. Available values:
|
Compression |
Drop-down list for configuring Snappy compression:
|
Delimiter |
The character that marks the boundary between events:
If you do not select a value in this drop-down list, \n is selected by default. |
Disk buffer disabled |
This toggle switch that enables the disk buffer. This toggle switch is turned on by default. The disk buffer is used if the collector cannot send normalized events to the destination. You can specify the size of the disk buffer in the Disk buffer size limit field. If the disk buffer runs out of free space, new normalized events will overwrite old normalized events, starting with the oldest. |
Timeout |
The time, in seconds, for which the destination waits for a response from another service or component. |
Debug |
Ths switch enables resource logging. The toggle switch is turned off by default. |
Filter |
Filter for determining which events must be processed by the resource. You can select an existing filter or create a new filter. To create a new filter, select Create new. If you want to edit the settings of an existing filter, click the pencil To create a filter:
|
Destination, tcp type
Destinations of the tcp typeUsed for communication over TCP. Settings for a destination of the tcp type are described in the following tables.
Basic settings tab
Setting |
Description |
|---|---|
Name |
Unique name of the resource. The maximum length of the name is 128 Unicode characters. Required setting. |
Tenant |
The name of the tenant that owns the resource. Required setting. |
State |
This toggle switch enables sending events to the destination. This toggle switch is turned on by default.
|
Type |
Destination type: tcp. Required setting. |
URL |
URL that you want to connect to. The following URL formats are supported:
You can add multiple URLs or remove an URL. To add an URL, click the + Add button. To remove an URL, click the delete Required setting. |
Tags |
Tags for resource search. Optional setting. |
Description |
Description of the resource. The maximum length of the description is 4000 Unicode characters. |
Advanced settings tab
Setting |
Description |
|---|---|
Buffer size |
Buffer size in bytes for accumulating events in the RAM of the server before sending them for further processing or storage. The value must be a positive integer. Default buffer size: 1,048,576 bytes (1 MB). Maximum buffer size: 67,108,864 bytes (64 MB). |
Buffer flush interval |
Interval (in seconds) for sending events to the destination. The default value is 1 second. |
Disk buffer size limit |
Size of the disk buffer in bytes. The default value is 10 GB. |
Handlers |
Number of handlers that the service can run simultaneously to process response rules in parallel. To determine the number of handlers, you can use the following formula: (<number of CPUs> / 2) + 2. The value must be a positive integer. |
Output format |
Format in which events are sent to the destination:
|
TLS mode |
TLS encryption mode. When using TLS encryption, you cannot specify an IP address in the URL field on the Basic settings. Available values:
|
Compression |
Drop-down list for configuring Snappy compression:
|
URL selection policy |
Method of determining URLs to which events must be sent first if you added multiple URLs in the URL field on the Basic settings:
|
Delimiter |
The character that marks the boundary between events:
If you do not select a value in this drop-down list, \n is selected by default. |
Disk buffer disabled |
This toggle switch that enables the disk buffer. This toggle switch is turned on by default. The disk buffer is used if the collector cannot send normalized events to the destination. You can specify the size of the disk buffer in the Disk buffer size limit field. If the disk buffer runs out of free space, new normalized events will overwrite old normalized events, starting with the oldest. |
Timeout |
The time, in seconds, for which the destination waits for a response from another service or component. |
Debug |
Ths switch enables resource logging. The toggle switch is turned off by default. |
Filter |
Filter for determining which events must be processed by the resource. You can select an existing filter or create a new filter. To create a new filter, select Create new. If you want to edit the settings of an existing filter, click the pencil To create a filter:
|
Destination, http type
Destinations of the http typeUsed for communication over the HTTP protocol. Settings for a destination of the http type are described in the following tables.
Basic settings tab
Setting |
Description |
|---|---|
Name |
Unique name of the resource. The maximum length of the name is 128 Unicode characters. Required setting. |
Tenant |
The name of the tenant that owns the resource. Required setting. |
State |
This toggle switch enables sending events to the destination. This toggle switch is turned on by default.
|
Type |
Destination type: http. Required setting. |
URL |
URL that you want to connect to. The following URL formats are supported:
You can add multiple URLs or remove an URL. To add an URL, click the + Add button. To remove an URL, click the delete Required setting. |
Authorization |
Type of authorization when connecting to the URL specified in the URL field:
|
Tags |
Tags for resource search. Optional setting. |
Description |
Description of the resource. The maximum length of the description is 4000 Unicode characters. |
Advanced settings tab
Setting |
Description |
|---|---|
Buffer size |
Buffer size in bytes for accumulating events in the RAM of the server before sending them for further processing or storage. The value must be a positive integer. Default buffer size: 1,048,576 bytes (1 MB). Maximum buffer size: 67,108,864 bytes (64 MB). |
Buffer flush interval |
Interval (in seconds) for sending events to the destination. The default value is 1 second. |
Disk buffer size limit |
Size of the disk buffer in bytes. The default value is 10 GB. |
Handlers |
Number of handlers that the service can run simultaneously to process response rules in parallel. To determine the number of handlers, you can use the following formula: (<number of CPUs> / 2) + 2. The value must be a positive integer. |
Output format |
Format in which events are sent to the destination:
|
TLS mode |
TLS encryption mode. When using TLS encryption, you cannot specify an IP address in the URL field on the Basic settings. Available values:
|
Proxy server |
The proxy server for the destination. You can select an existing proxy server or create a new proxy server. To create a new proxy server, select Create new. If you want to edit the settings of an existing proxy server, click the pencil |
Compression |
Drop-down list for configuring Snappy compression:
|
URL selection policy |
Method of determining URLs to which events must be sent first if you added multiple URLs in the URL field on the Basic settings:
|
Delimiter |
The character that marks the boundary between events:
If you do not select a value in this drop-down list, \n is selected by default. |
Path |
The path that must be added in the request to the URL specified in the URL field on the Basic settings tab. For example, if you specify |
Health check path |
The URL for sending requests to obtain health information about the system that the destination resource is connecting to. |
Health check |
This toggle switch enables the health check. This toggle switch is turned off by default. |
Disk buffer disabled |
This toggle switch that enables the disk buffer. This toggle switch is turned on by default. The disk buffer is used if the collector cannot send normalized events to the destination. You can specify the size of the disk buffer in the Disk buffer size limit field. If the disk buffer runs out of free space, new normalized events will overwrite old normalized events, starting with the oldest. |
Timeout |
The time, in seconds, for which the destination waits for a response from another service or component. |
Debug |
Ths switch enables resource logging. The toggle switch is turned off by default. |
Filter |
Filter for determining which events must be processed by the resource. You can select an existing filter or create a new filter. To create a new filter, select Create new. If you want to edit the settings of an existing filter, click the pencil To create a filter:
|
Destination, diode type
Destinations of the diode typeUsed to transmit events using a data diode. Settings for a destination of the diode type are described in the following tables.
Basic settings tab
Setting |
Description |
|---|---|
Name |
Unique name of the resource. The maximum length of the name is 128 Unicode characters. Required setting. |
Tenant |
The name of the tenant that owns the resource. Required setting. |
State |
This toggle switch enables sending events to the destination. This toggle switch is turned on by default.
|
Type |
Destination type: diode. Required setting. |
Data diode source directory |
Path to the directory from which the data diode moves events. The maximum length of the path is 255 Unicode characters. Limitations when using prefixes in paths on Windows servers Limitations when using prefixes in paths on Linux servers The paths specified in the Data diode source directory and Temporary directory fields may not be the same. |
Temporary directory |
Path to the directory in which events are prepared for transmission to the data diode. The maximum length of the path is 255 Unicode characters. Events are stored in a file when a timeout or a buffer overflow occurs. The default timeout is 10 seconds. The prepared file with events is moved to the directory specified in the Data diode source directory field. The checksum (SHA-256) of the file contents is used as the name of the file with events. The paths specified in the Data diode source directory and Temporary directory fields may not be the same. |
Tags |
Tags for resource search. Optional setting. |
Description |
Description of the resource. The maximum length of the description is 4000 Unicode characters. |
Advanced settings tab
Setting |
Description |
|---|---|
Buffer size |
Buffer size in bytes for accumulating events in the RAM of the server before sending them for further processing or storage. The value must be a positive integer. Default buffer size: 1,048,576 bytes (1 MB). Maximum buffer size: 67,108,864 bytes (64 MB). |
Buffer flush interval |
Interval (in seconds) for sending events to the destination. The default value is 1 second. |
Handlers |
Number of handlers that the service can run simultaneously to process response rules in parallel. To determine the number of handlers, you can use the following formula: (<number of CPUs> / 2) + 2. The value must be a positive integer. |
Compression |
Drop-down list for configuring Snappy compression:
|
Delimiter |
The character that marks the boundary between events:
If you do not select a value in this drop-down list, \n is selected by default. |
Debug |
Ths switch enables resource logging. The toggle switch is turned off by default. |
Filter |
Filter for determining which events must be processed by the resource. You can select an existing filter or create a new filter. To create a new filter, select Create new. If you want to edit the settings of an existing filter, click the pencil To create a filter:
|
Destination, kafka type
Destinations of the kafka typeUsed for kafka communications. Settings for a destination of the kafka type are described in the following tables.
Basic settings tab
Setting |
Description |
|---|---|
Name |
Unique name of the resource. The maximum length of the name is 128 Unicode characters. Required setting. |
Tenant |
The name of the tenant that owns the resource. Required setting. |
State |
This toggle switch enables sending events to the destination. This toggle switch is turned on by default.
|
Type |
Destination type: kafka. Required setting. |
URL |
URL that you want to connect to. The following URL formats are supported:
You can add multiple URLs or remove an URL. To add an URL, click the + Add button. To remove an URL, click the delete Required setting. |
Topic |
Subject of Kafka messages. The maximum length of the subject is 255 characters. You can use the following characters: a–z, A–Z, 0–9, ".", "_", "-". Required setting. |
Authorization |
Type of authorization when connecting to the URL specified in the URL field:
|
Tags |
Tags for resource search. Optional setting. |
Description |
Description of the resource. The maximum length of the description is 4000 Unicode characters. |
Advanced settings tab
Setting |
Description |
|---|---|
Buffer size |
Buffer size in bytes for accumulating events in the RAM of the server before sending them for further processing or storage. The value must be a positive integer. Default buffer size: 1,048,576 bytes (1 MB). Maximum buffer size: 67,108,864 bytes (64 MB). |
Buffer flush interval |
Interval (in seconds) for sending events to the destination. The default value is 1 second. |
Disk buffer size limit |
Size of the disk buffer in bytes. The default value is 10 GB. |
Handlers |
Number of handlers that the service can run simultaneously to process response rules in parallel. To determine the number of handlers, you can use the following formula: (<number of CPUs> / 2) + 2. The value must be a positive integer. |
Output format |
Format in which events are sent to the destination:
|
TLS mode |
TLS encryption mode. When using TLS encryption, you cannot specify an IP address in the URL field on the Basic settings. Available values:
|
Delimiter |
The character that marks the boundary between events:
If you do not select a value in this drop-down list, \n is selected by default. |
Disk buffer disabled |
This toggle switch that enables the disk buffer. This toggle switch is turned on by default. The disk buffer is used if the collector cannot send normalized events to the destination. You can specify the size of the disk buffer in the Disk buffer size limit field. If the disk buffer runs out of free space, new normalized events will overwrite old normalized events, starting with the oldest. |
Timeout |
The time, in seconds, for which the destination waits for a response from another service or component. |
Debug |
Ths switch enables resource logging. The toggle switch is turned off by default. |
Filter |
Filter for determining which events must be processed by the resource. You can select an existing filter or create a new filter. To create a new filter, select Create new. If you want to edit the settings of an existing filter, click the pencil To create a filter:
|
Destination, file type
Destinations of the file typeUsed for writing to a file. Settings for a destination of the file type are described in the following tables.
When deleting a destination of the file type that is being used in a service, you must restart the service.
Basic settings tab
Setting |
Description |
|---|---|
Name |
Unique name of the resource. The maximum length of the name is 128 Unicode characters. Required setting. |
Tenant |
The name of the tenant that owns the resource. Required setting. |
State |
This toggle switch enables sending events to the destination. This toggle switch is turned on by default.
|
Type |
Destination type: file. Required setting. |
URL |
Path to the file to which the events must be written. Limitations when using prefixes in file paths Required setting. |
Tags |
Tags for resource search. Optional setting. |
Description |
Description of the resource. The maximum length of the description is 4000 Unicode characters. |
Advanced settings tab
Setting |
Description |
|---|---|
Buffer size |
Buffer size in bytes for accumulating events in the RAM of the server before sending them for further processing or storage. The value must be a positive integer. Default buffer size: 1,048,576 bytes (1 MB). Maximum buffer size: 67,108,864 bytes (64 MB). |
Buffer flush interval |
Interval (in seconds) for sending events to the destination. The default value is 1 second. |
Disk buffer size limit |
Size of the disk buffer in bytes. The default value is 10 GB. |
Handlers |
Number of handlers that the service can run simultaneously to process response rules in parallel. To determine the number of handlers, you can use the following formula: (<number of CPUs> / 2) + 2. The value must be a positive integer. |
Output format |
Format in which events are sent to the destination:
|
Delimiter |
The character that marks the boundary between events:
If you do not select a value in this drop-down list, \n is selected by default. |
Disk buffer disabled |
This toggle switch that enables the disk buffer. This toggle switch is turned on by default. The disk buffer is used if the collector cannot send normalized events to the destination. You can specify the size of the disk buffer in the Disk buffer size limit field. If the disk buffer runs out of free space, new normalized events will overwrite old normalized events, starting with the oldest. |
Debug |
Ths switch enables resource logging. The toggle switch is turned off by default. |
Filter |
Filter for determining which events must be processed by the resource. You can select an existing filter or create a new filter. To create a new filter, select Create new. If you want to edit the settings of an existing filter, click the pencil To create a filter:
|
Destination, storage type
Destinations of the storage typeUsed for sending data to storage. Settings for a destination of the storage type are described in the following tables.
Basic settings tab
Setting |
Description |
|---|---|
Name |
Unique name of the resource. The maximum length of the name is 128 Unicode characters. Required setting. |
Tenant |
The name of the tenant that owns the resource. Required setting. |
State |
This toggle switch enables sending events to the destination. This toggle switch is turned on by default.
|
Type |
Destination type: storage. Required setting. |
URL |
URL that you want to connect to. The following URL formats are supported:
You can add multiple URLs or remove an URL. To add an URL, click the + Add button. To remove an URL, click the delete Required setting. |
Tags |
Tags for resource search. Optional setting. |
Description |
Description of the resource. The maximum length of the description is 4000 Unicode characters. |
Advanced settings tab
Setting |
Description |
|---|---|
Buffer size |
Buffer size in bytes for accumulating events in the RAM of the server before sending them for further processing or storage. The value must be a positive integer. Default buffer size: 1,048,576 bytes (1 MB). Maximum buffer size: 67,108,864 bytes (64 MB). |
Buffer flush interval |
Interval (in seconds) for sending events to the destination. The default value is 1 second. |
Disk buffer size limit |
Size of the disk buffer in bytes. The default value is 10 GB. |
Handlers |
Number of handlers that the service can run simultaneously to process response rules in parallel. To determine the number of handlers, you can use the following formula: (<number of CPUs> / 2) + 2. The value must be a positive integer. |
Proxy server |
The proxy server for the destination. You can select an existing proxy server or create a new proxy server. To create a new proxy server, select Create new. If you want to edit the settings of an existing proxy server, click the pencil |
URL selection policy |
Method of determining URLs to which events must be sent first if you added multiple URLs in the URL field on the Basic settings:
|
Health check timeout |
Interval, in seconds, for checking the health of the destination. |
Disk buffer disabled |
This toggle switch that enables the disk buffer. This toggle switch is turned on by default. The disk buffer is used if the collector cannot send normalized events to the destination. You can specify the size of the disk buffer in the Disk buffer size limit field. If the disk buffer runs out of free space, new normalized events will overwrite old normalized events, starting with the oldest. |
Timeout |
The time, in seconds, for which the destination waits for a response from another service or component. |
Debug |
Ths switch enables resource logging. The toggle switch is turned off by default. |
Filter |
Filter for determining which events must be processed by the resource. You can select an existing filter or create a new filter. To create a new filter, select Create new. If you want to edit the settings of an existing filter, click the pencil To create a filter:
|
Destination, correlator type
Destinations of the correlator typeUsed for sending data to a correlator. Settings for a destination of the correlator type are described in the following tables.
Basic settings tab
Setting |
Description |
|---|---|
Name |
Unique name of the resource. The maximum length of the name is 128 Unicode characters. Required setting. |
Tenant |
The name of the tenant that owns the resource. Required setting. |
State |
This toggle switch enables sending events to the destination. This toggle switch is turned on by default.
|
Type |
Destination type: correlator. Required setting. |
URL |
URL that you want to connect to. The following URL formats are supported:
You can add multiple URLs or remove an URL. To add an URL, click the + Add button. To remove an URL, click the delete Required setting. |
Tags |
Tags for resource search. Optional setting. |
Description |
Description of the resource. The maximum length of the description is 4000 Unicode characters. |
Advanced settings tab
Setting |
Description |
|---|---|
Buffer size |
Buffer size in bytes for accumulating events in the RAM of the server before sending them for further processing or storage. The value must be a positive integer. Default buffer size: 1,048,576 bytes (1 MB). Maximum buffer size: 67,108,864 bytes (64 MB). |
Buffer flush interval |
Interval (in seconds) for sending events to the destination. The default value is 1 second. |
Disk buffer size limit |
Size of the disk buffer in bytes. The default value is 10 GB. |
Handlers |
Number of handlers that the service can run simultaneously to process response rules in parallel. To determine the number of handlers, you can use the following formula: (<number of CPUs> / 2) + 2. The value must be a positive integer. |
Proxy server |
The proxy server for the destination. You can select an existing proxy server or create a new proxy server. To create a new proxy server, select Create new. If you want to edit the settings of an existing proxy server, click the pencil |
URL selection policy |
Method of determining URLs to which events must be sent first if you added multiple URLs in the URL field on the Basic settings:
|
Health check timeout |
Interval, in seconds, for checking the health of the destination. |
Disk buffer disabled |
This toggle switch that enables the disk buffer. This toggle switch is turned on by default. The disk buffer is used if the collector cannot send normalized events to the destination. You can specify the size of the disk buffer in the Disk buffer size limit field. If the disk buffer runs out of free space, new normalized events will overwrite old normalized events, starting with the oldest. |
Timeout |
The time, in seconds, for which the destination waits for a response from another service or component. |
Debug |
Ths switch enables resource logging. The toggle switch is turned off by default. |
Filter |
Filter for determining which events must be processed by the resource. You can select an existing filter or create a new filter. To create a new filter, select Create new. If you want to edit the settings of an existing filter, click the pencil To create a filter:
|
Destination, eventRouter type
Destinations of the eventRouter typeUsed for sending events to an event router. Settings for a destination of the eventRouter type are described in the following tables.
Basic settings tab
Setting |
Description |
|---|---|
Name |
Unique name of the resource. The maximum length of the name is 128 Unicode characters. Required setting. |
Tenant |
The name of the tenant that owns the resource. Required setting. |
State |
This toggle switch enables sending events to the destination. This toggle switch is turned on by default.
|
Type |
Destination type: eventRouter. Required setting. |
URL |
URL that you want to connect to. The following URL formats are supported:
You can add multiple URLs or remove an URL. To add an URL, click the + Add button. To remove an URL, click the delete Required setting. |
Tags |
Tags for resource search. Optional setting. |
Description |
Description of the resource. The maximum length of the description is 4000 Unicode characters. |
Advanced settings tab
Setting |
Description |
|---|---|
Buffer size |
Buffer size in bytes for accumulating events in the RAM of the server before sending them for further processing or storage. The value must be a positive integer. Default buffer size: 1,048,576 bytes (1 MB). Maximum buffer size: 67,108,864 bytes (64 MB). |
Buffer flush interval |
Interval (in seconds) for sending events to the destination. The default value is 1 second. |
Disk buffer size limit |
Size of the disk buffer in bytes. The default value is 10 GB. |
Handlers |
Number of handlers that the service can run simultaneously to process response rules in parallel. To determine the number of handlers, you can use the following formula: (<number of CPUs> / 2) + 2. The value must be a positive integer. |
Output format |
Format in which events are sent to the destination:
|
Proxy server |
The proxy server for the destination. You can select an existing proxy server or create a new proxy server. To create a new proxy server, select Create new. If you want to edit the settings of an existing proxy server, click the pencil |
URL selection policy |
Method of determining URLs to which events must be sent first if you added multiple URLs in the URL field on the Basic settings:
|
Health check timeout |
Interval, in seconds, for checking the health of the destination. |
Disk buffer disabled |
This toggle switch that enables the disk buffer. This toggle switch is turned on by default. The disk buffer is used if the collector cannot send normalized events to the destination. You can specify the size of the disk buffer in the Disk buffer size limit field. If the disk buffer runs out of free space, new normalized events will overwrite old normalized events, starting with the oldest. |
Timeout |
The time, in seconds, for which the destination waits for a response from another service or component. |
Debug |
Ths switch enables resource logging. The toggle switch is turned off by default. |
Filter |
Filter for determining which events must be processed by the resource. You can select an existing filter or create a new filter. To create a new filter, select Create new. If you want to edit the settings of an existing filter, click the pencil To create a filter:
|
Predefined destinations
Destinations listed in the table below are included in the KUMA distribution kit.
Predefined destinations
Destination name |
Description |
[OOTB] Correlator |
Sends events to a correlator. |
[OOTB] Storage |
Sends events to storage. |
Normalizers
Normalizers are used for converting raw events that come from various sources in different formats to the KUMA event data model. Normalized events become available for processing by other KUMA resources and services.
A normalizer consists of the main event parsing rule and optional additional event parsing rules. By creating a main parsing rule and a set of additional parsing rules, you can implement complex event processing logic. Data is passed along the tree of parsing rules depending on the conditions specified in the Extra normalization conditions setting. The sequence in which parsing rules are created is significant: the event is processed sequentially and the processing sequence is indicated by arrows.
The following event normalization options are now available:
- 1 collector — 1 normalizer
We recommend using this method if you have many events of the same type or many IP addresses from which events of the same type may originate. You can configure one collector with only one normalizer, which is optimal in terms of performance.
- 1 collector — multiple normalizers linked to IP
This method is available for collectors with a connector of UDP, TCP, or HTTP type. If a UDP, TCP, or HTTP connector is specified in the collector at the 'Transport' step, then at the 'Event parsing' step, you can specify multiple IP addresses on the 'Parsing settings' tab and choose the normalizer that you want to use for events coming from the specified addresses. The following types of normalizers are available: json, cef, regexp, syslog, csv, kv, xml. For normalizers of the Syslog and regexp types, you can specify extra normalization conditions depending on the value of the DeviceProcessName field.
A normalizer is created in several steps:
- Preparing to create a normalizer
A normalizer can be created in the KUMA Console:
- In the Resources → Normalizers section.
- When creating a collector, at the Event parsing step.
Then parsing rules must be created in the normalizer.
- Creating the main parsing rule for an event
The main parsing rule is created using the Add event parsing button. This opens the Event parsing window, where you can specify the settings of the main parsing rule:
- Specify event parsing settings.
- Specify event enrichment settings.
The main parsing rule for an event is displayed in the normalizer as a dark circle. You can view or modify the settings of the main parsing rule by clicking this circle. When you hover the mouse over the circle, a plus sign is displayed. Click it to add the parsing rules.
The name of the main parsing rule is used in KUMA as the normalizer name.
- Creating additional event parsing rules
Clicking the plus icon that is displayed when you hover the mouse over the circle or the block corresponding to the normalizer opens the Additional event parsing window where you can specify the settings of the additional parsing rule:
- Specify the conditions for sending data to the new normalizer.
- Specify event parsing settings.
- Specify event enrichment settings.
The additional event parsing rule is displayed in the normalizer as a dark block. The block displays the triggering conditions for the additional parsing rule, the name of the additional parsing rule, and the event field. When this event field is available, the data is passed to the normalizer. Click the block of the additional parsing rule to view or modify its settings.
If you hover the mouse over the additional normalizer, a plus button appears. You can use this button to create a new additional event parsing rule. To delete a normalizer, use the button with the trash icon.
- Completing the creation of the normalizer
To finish the creation of the normalizer, click Save.
In the upper right corner, in the search field, you can search for additional parsing rules by name.
For normalizer resources, you can enable the display of control characters in all input fields except the Description field.
If, when changing the settings of a collector resource set, you change or delete conversions in a normalizer connected to it, the edits will not be saved, and the normalizer itself may be corrupted. If you need to modify conversions in a normalizer that is already part of a service, the changes must be made directly to the normalizer under Resources → Normalizers in the web interface.
Event parsing settings
You can configure the rules for converting incoming events to the KUMA format when creating event parsing rules in the normalizer settings window, on the Normalization scheme tab. Available event parsing settings are listed in the table below.
When normalizing events, you can use extended event schema fields in addition to standard KUMA event schema fields.
Available event parsing settings
Setting |
Description |
|---|---|
Name |
Name of the parsing rule. Maximum length of the name: 128 Unicode characters. The name of the main parsing rule is used as the name of the normalizer. Required setting. |
Tenant |
The name of the tenant that owns the resource. This setting is not available for extra parsing rules. |
Parsing method |
The type of incoming events. Depending on the selected parsing method, you can use the predefined event field matching rules or define your own rules. When you select some parsing methods, additional settings may become available they you must specify. Available parsing methods:
Required setting. |
Keep raw event |
Keeping raw events in the newly created normalized event. Available values:
Required setting. This setting is not available for extra parsing rules. |
Keep extra fields |
Keep fields and values for which no mapping rules are configured. This data is saved as an array in the Filtering based on data from the Extra event field By default, no extra fields are saved. Required setting. |
Description |
Description of the resource. Maximum length of the description: 4000 Unicode characters. This setting is not available for extra parsing rules. |
Event examples |
Example of data that you want to process. This setting is not available for the following parsing methods: netflow5, netflow9, sflow5, ipfix, and sql. If the event was parsed successfully, and the type of the data obtained from the raw event matches the type of the KUMA field, the Event examples field is filled with data obtained from the raw event. For example, the |
Mapping |
Settings for configuring the mapping of source event fields to fields of the event in the KUMA format:
You can add new table rows or delete table rows. To add a new table row, click Add row. To delete a single row in the table, click If you have loaded data into the Event examples field, the table will have an Examples column containing examples of values carried over from the raw event field to the KUMA event field. If the size of the KUMA event field is less than the length of the value placed in it, the value is truncated to the size of the event field. |
Extended event schema
You can use the extended event schema fields in normalizers for normalizing events and in other KUMA resources, for example, as widget fields or to filter and search for events. You can view the list of all extended event schema fields that exist in KUMA in the Settings → Extended event schema fields section. The list of extended event schema fields is the same for all tenants.
Only users with the General administrator, Tenant administrator, Tier 2 analyst, Tier 1 analyst, Junior analyst, Read shared resources, and Manage shared resources roles can view the table of extended event schema fields.
The Extended event schema fields table contains the following information:
- Type—Data type of the extended event schema field.
- Field name—Name of the extended event schema field, without a type.
You can click the name to edit the settings of the extended event schema field.
- Status—Whether the extended event schema field can be used in resources.
You can Enable or Disable the toggle switch to allow or forbid using this extended event schema field in new resources. However, a disabled field is still used in resource configurations that are already operational, until you manually remove the field from the configuration; the field also remains available in the list of table columns in the Events section for managing old events.
Only a user with the General administrator role can disable an extended event schema field.
- Update date—Date and time of the last modification of the extended event schema field.
- Created by—Name of the user that created the extended event schema field.
- Dependencies—Number of KUMA resources, dashboard layouts, reports, presets, and field sets for searching event sources that use the extended event schema field.
You can click the number to open a pane with a table of all resources and other KUMA entities that are using this field. For each dependency, the table displays the name, tenant (only for resources), and type. Dependencies in the table are sorted by name. Clicking the name of a dependency takes you to its page (except for dashboard layouts, presets, and saved user queries).
You can view the dependencies of an extended event schema field only for resources and entities to whose tenants you have access. If you do not have access to the tenant, its resources are not displayed in the table, but still count towards the number of dependencies.
- Description—Text description of the field.
By default, the table of extended event schema fields is sorted by update date in descending order. If necessary, you can sort the table by clicking a column heading and selecting Ascending or Descending; you can also use context search by field name.
By default, the following service extended event schema fields are automatically added to KUMA:
KL_EventRoute, typeSfor storing information about the route of the event.You can use this field in normalizers, as a key or value in active lists, in enrichment rules, as a query field in data collection and analysis rules, in correlation rules. You cannot use this field to detect event sources.
- The following fields are added to a correlation event:
KL_CorrelationRulePriority, typeNKL_SourceAssetDisplayName, typeSKL_DestinationAssetDisplayName, typeSKL_DeviceAssetDisplayName, typeSKL_SourceAccountDisplayName, typeSKL_DestinationAccountDisplayName, typeS
You cannot use this service fields to search for events.
You cannot edit, delete, export, or disable service fields. All extended event schema fields with the KL_ prefix are service fields and can be managed only from Kaspersky servers. We do not recommend using the KL_ prefix when adding new extended event schema fields.
Adding extended event schema fields
Users with the General administrator, Tenant administrator, Tier 2 analyst, Tier 1 analyst, Junior analyst, Manage shared resources roles can add new extended event schema fields.
To add an extended event schema field:
- In the KUMA Console, in the Settings → Extended event schema fields section, click the Add button in the upper part of the table.
This opens the Create extended schema pane.
- Enable or disable the Status toggle switch to enable or disable this extended event schema field for resources.
The toggle switch is turned on by default. A disabled field remains available in the list of table columns in the Events section for managing old events.
- In the Type field, select the data type of the extended event schema field.
- In the Name field, specify the name of the extended event schema field.
Consider the following when naming extended event schema fields:
- The name must be unique within the KUMA instance.
- Names are case-sensitive. For example,
Field_nameandfield_nameare different names. - You can use Latin, Cyrillic characters and numerals. Spaces or " ~ ` @ # $ % ^ & * ( ) + - [ ] { } | \ | / . " < > ; ! , : ? = characters are not allowed.
- If you want to use the extended event schema fields to search for event sources, you can only use Latin characters and numerals.
- The maximum length is 128 characters.
- If necessary, in the Description field, enter a description for the extended event schema field.
We recommend describing the purpose of the extended event schema field. Only Unicode characters are allowed in the description. The maximum length is 256 characters.
- Click the Save button.
A new extended event schema field is added and displayed at the top of the table. An audit event is generated for the creation of the extended event schema field. If you have enabled the field, you can use it in normalizers and when configuring resources.
Page top
Editing extended event schema fields
Users with the General administrator, Tenant administrator, Tier 2 analyst, Tier 1 analyst, Junior analyst, Manage shared resources roles can edit existing extended event schema fields.
To edit an extended event schema field:
- In the KUMA Console, in the Settings → Extended event schema fields section, click the name of the field that you want to edit.
This opens the Edit extended schema pane. This pane displays the settings of the selected field, as well as the Dependencies table with a list of resources, dashboard layouts, reports, presets, and sets of fields for finding event sources that use this field. Only resources to whose tenants you have access are displayed. If the field is used by resources to whose tenant you do not have access, such resources are not displayed in the table. Resources in the table are sorted by name.
Clicking the name of a resource or entity takes you to its page (except for dashboard resources, presets, and saved user queries).
- Make the changes you need in the available settings.
You can edit the Type and Field name settings only if the extended event schema field does not have dependencies. You can edit the Status and Description settings for any extended event scheme field. However, a field with the Disabled status is still used in resource configurations that are already operational, until you manually remove the field from the configuration; the field also remains available in the list of table columns in the Events section for managing old events.
Disabling an extended event schema field using the Status field requires the General administrator role.
- Click the Save button.
The extended event schema field is updated. An audit event is generated about the modification of the field.
Page top
Importing and exporting extended event schema fields
You can add multiple new extended event schema fields at once by importing them from a JSON file. You can also export all extended event schema fields with information about them to a file, for example, to propagate the list of fields to other KUMA instances to maintain resources.
Users with the General administrator, Tenant administrator, Tier 2 analyst, Tier 1 analyst, Junior analyst, and Manage shared resources roles can import an export extended event schema fields. Users with the Read shared resources role can only export extended event schema fields.
To import extended event schema fields into KUMA from a file:
- In the KUMA Console, in the Settings → Extended event schema fields section, click the Import button.
- This opens a window; in that window, select a JSON file with a list of extended event schema field objects.
Example JSON file:
[{"kind": "SA","name": "<fieldName1>","description": "<description1>","disabled": false},{"kind": "N","name": "<fieldName2>","description": "<description2>","disabled": false},....{"kind": "FA","name": "<fieldNameX>","description": "<descriptionX>","disabled": false}]When importing fields from a file, their names are checked for possible conflicts with fields of the same type. If a field with the same name and type already exists in KUMA, such fields are not imported from the file.
Extended event schema fields are imported from the file to KUMA. An audit event about the import of fields is generated, and a separate audit event is generated for each added field.
To export extended event schema fields to a file:
- In the KUMA Console, go to the Settings → Extended event schema fields section.
- If you want to export specific extended event schema fields:
- Select the check boxes in the first column of the table for the required fields.
You cannot select service fields.
- Click the Export selected button in the upper part of the table.
- Select the check boxes in the first column of the table for the required fields.
- If you want to export all extended event schema fields, click the Export all button in the upper part of the table.
A JSON file with a list of extended event schema field objects and information about them is downloaded.
Page top
Deleting extended event schema fields
Only a user with the General administrator role can delete extended event schema fields.
You can delete only those extended event schema fields that are not service fields, that have the Disabled status, and that are not used in KUMA resources and other entities (do not have dependencies). We recommend deleting extended event schema fields after enough time has passed to make sure that all events in which the field was used have been deleted from KUMA. When you delete a field, it is no longer displayed in event tips.
To delete extended event schema fields:
- In the KUMA Console, go to the Settings → Extended event schema fields section.
- Select the check boxes in the first column of the table next to one or more fields that you want to delete.
To select all fields, you can select the check box in the heading of the first column.
- Click the Delete button in the upper part of the table.
The Delete button is active only if all selected fields are disabled and have no dependencies. If at least one field is enabled or has a dependency, the button is inactive.
If you want to delete a field that is used in at least one KUMA resource (has a dependency), but you do not have access to its tenant, the Delete button is active when this field is selected, but an error is displayed when you try to delete it.
The selected fields are deleted. An audit event is generated about the deletion of the fields.
Page top
Using extended event schema fields in normalizers
When using extended event schema fields, the general limit for the maximum size of an event that can be processed by the collector is the same, 4 MB. Information about the types of extended event schema fields is shown in the table below (step 6 of the instructions).
Using many unique fields of the extended event schema can reduce the performance of the system, increase the amount of disk space required for storing events, and make the information difficult to understand.
We recommend consciously choosing a minimal set of additional fields of the extended event schema that you want to use in normalizers and correlation.
To use the fields of the extended event schema:
- Open an existing normalizer or create a new normalizer.
- Specify the basic settings of the normalizer.
- Click Add row.
- For the Source setting, enter the name of the source field in the raw event.
- For the KUMA field setting, start typing the name of the extended event schema field and select the field from the drop-down list.
The extended event schema fields in the drop-down list have names in the
<type>.<field name>format. - Click the Save button to save the event normalizer.
The normalizer is saved with the selected extended event schema field.
If the data in the fields of the raw event does not match the type of the KUMA field, the value is not saved during the normalization of events if type conversion cannot be performed. For example, the string test cannot be written to the DeviceCustomNumber1 KUMA field of the Number type.
If you want to minimize the load on the storage server when searching events, preparing reports, and performing other operations on events in storage, use KUMA event schema fields as your first preference, extended event schema fields as your second preference, and the Extra fields as your last resort.
Enrichment in the normalizer
When creating event parsing rules in the normalizer settings window, on the Enrichment tab, you can configure the rules for adding extra data to the fields of the normalized event using enrichment rules. Enrichment rules are stored in the settings of the normalizer where they were created.
You can create enrichment rules by clicking the Add enrichment button. To delete an enrichment rule, click next to it. Extended event schema fields can be used for event enrichment. Available enrichment rule settings are listed in the table below.
Available enrichment rule settings
Setting |
Description |
||||||
|---|---|---|---|---|---|---|---|
Source kind |
Enrichment type. Depending on the selected enrichment type, you may see advanced settings that will also need to be completed. Available types of enrichment:
Required setting. |
||||||
Target field |
The KUMA event field that you want to populate with the data. Required setting. This setting is not available for the enrichment source of the Table type. |
Conditions for forwarding data to an extra normalizer
When creating additional event parsing rules, you can specify the conditions. When these conditions are met, the events are sent to the created parsing rule for processing. Conditions can be specified in the Additional event parsing window, on the Extra normalization conditions tab. This tab is not available for the basic parsing rules.
Available settings:
- Use raw event — If you want to send a raw event for extra normalization, select Yes in the Keep raw event drop-down list. The default value is No. We recommend passing a raw event to normalizers of json and xml types. If you want to send a raw event for extra normalization to the second, third, etc nesting levels, at each nesting level, select Yes in the Keep raw event drop-down list.
- Field to pass into normalizer—indicates the event field if you want only events with fields configured in normalizer settings to be sent for additional parsing.
If this field is blank, the full event is sent to the extra normalizer for processing.
- Set of filters—used to define complex conditions that must be met by the events received by the normalizer.
You can use the Add condition button to add a string containing fields for identifying the condition (see below).
You can use the Add group button to add a group of filters. Group operators can be switched between AND, OR, and NOT. You can add other condition groups and individual conditions to filter groups.
You can swap conditions and condition groups by dragging them by the
icon; you can also delete them using the icon.
Filter condition settings:
- Left operand and Right operand—used to specify the values to be processed by the operator.
In the left operand, you must specify the source field of events coming into the normalizer. For example, if the eventType - DeviceEventClass mapping is configured in the Basic event parsing window, then in the Additional event parsing window on the Extra normalization conditions tab, you must specify eventType in the left operand field of the filter. Data is processed only as text strings.
- Operators:
- = – full match of the left and right operands.
- startsWith – the left operand starts with the characters specified in the right operand.
- endsWith – the left operand ends with the characters specified in the right operand.
- match – the left operand matches the regular expression (RE2) specified in the right operand.
- in – the left operand matches one of the values specified in the right operand.
The incoming data can be converted by clicking the button. The Conversion window opens, where you can use the Add conversion button to create the rules for converting the source data before any actions are performed on them. In the Conversion window, you can swap the added rules by dragging them by the icon; you can also delete them using the icon.
Supported event sources
KUMA supports the normalization of events coming from systems listed in the "Supported event sources" table. Normalizers for these systems are included in the distribution kit.
Supported event sources
System name |
Normalizer name |
Type |
Normalizer description |
|---|---|---|---|
1C EventJournal |
[OOTB] 1C EventJournal Normalizer |
xml |
Designed for processing the event log of the 1C system. The event source is the 1C log. |
1C TechJournal |
[OOTB] 1C TechJournal Normalizer |
regexp |
Designed for processing the technology event log. The event source is the 1C technology log. |
Absolute Data and Device Security (DDS) |
[OOTB] Syslog-CEF |
Syslog |
Designed for processing events in the CEF format. |
AhnLab Malware Defense System (MDS) |
[OOTB] Syslog-CEF |
Syslog |
Designed for processing events in the CEF format. |
Ahnlab UTM |
[OOTB] Ahnlab UTM |
regexp |
Designed for processing events from the Ahnlab system. The event sources is system logs, operation logs, connections, the IPS module. |
AhnLabs MDS |
[OOTB] Syslog-CEF |
Syslog |
Designed for processing events in the CEF format. |
Apache Cassandra |
[OOTB] Apache Cassandra file |
regexp |
Designed for processing events from the logs of the Apache Cassandra database version 4.0. |
Aruba ClearPass |
[OOTB] Syslog-CEF |
Syslog |
Designed for processing events in the CEF format. |
Atlassian Conflunce |
[OOTB] Atlassian Jira Conflunce file |
regexp |
Designed for processing events of Atlassian Jira, Atlassian Confluence systems (Jira 9.12, Confluence 8.5) stored in files. |
Atlassian Jira |
[OOTB] Atlassian Jira Conflunce file |
regexp |
Designed for processing events of Atlassian Jira, Atlassian Confluence systems (Jira 9.12, Confluence 8.5) stored in files. |
Avanpost FAM |
[OOTB] Avanpost FAM syslog |
regexp |
Designed for processing events of the Avanpost Federated Access Manager (FAM) 1.9 received via syslog. |
Avanpost IDM |
[OOTB] Avanpost IDM syslog |
regexp |
Designed for processing events of the Avanpost IDM system received via syslog. |
Avaya Aura Communication Manager |
[OOTB] Avaya Aura Communication Manager syslog |
regexp |
Designed for processing some of the events received from Avaya Aura Communication Manager 7.1 via syslog. |
Avigilon Access Control Manager (ACM) |
[OOTB] Syslog-CEF |
Syslog |
Designed for processing events in the CEF format. |
Ayehu eyeShare |
[OOTB] Syslog-CEF |
Syslog |
Designed for processing events in the CEF format. |
Arbor Pravail |
[OOTB] Arbor Pravail syslog |
Syslog |
Designed for processing events of the Arbor Pravail system received via syslog. |
Aruba Aruba AOS-S |
[OOTB] Aruba Aruba AOS-S syslog |
regexp |
Designed for processing certain types of events received from Aruba network devices with Aruba AOS-S 16.10 firmware via syslog. The normalizer supports the following types of events: accounting events, ACL events, ARP protect events, authentication events, console events, loop protect events. |
Barracuda Cloud Email Security Gateway |
[OOTB] Barracuda Cloud Email Security Gateway syslog |
regexp |
Designed for processing events from Barracuda Cloud Email Security Gateway via syslog. |
Barracuda Networks NG Firewall |
[OOTB] Syslog-CEF |
Syslog |
Designed for processing events in the CEF format. |
Barracuda Web Security Gateway |
[OOTB] Barracuda Web Security Gateway syslog |
Syslog |
Designed for processing some of the events received from Barracuda Web Security Gateway 15.0 via syslog. |
BeyondTrust Privilege Management Console |
[OOTB] Syslog-CEF |
Syslog |
Designed for processing events in the CEF format. |
BeyondTrust’s BeyondInsight |
[OOTB] Syslog-CEF |
Syslog |
Designed for processing events in the CEF format. |
Bifit Mitigator |
[OOTB] Bifit Mitigator Syslog |
Syslog |
Designed for processing events from the DDOS Mitigator protection system received via Syslog. |
Bloombase StoreSafe |
[OOTB] Syslog-CEF |
Syslog |
Designed for processing events in the CEF format. |
BMC CorreLog |
[OOTB] Syslog-CEF |
Syslog |
Designed for processing events in the CEF format. |
Bricata ProAccel |
[OOTB] Syslog-CEF |
Syslog |
Designed for processing events in the CEF format. |
Brinqa Risk Analytics |
[OOTB] Syslog-CEF |
Syslog |
Designed for processing events in the CEF format. |
Broadcom Symantec Advanced Threat Protection (ATP) |
[OOTB] Syslog-CEF |
Syslog |
Designed for processing events in the CEF format. |
Broadcom Symantec Endpoint Protection |
[OOTB] Broadcom Symantec Endpoint Protection |
regexp |
Designed for processing events from the Symantec Endpoint Protection system. |
Broadcom Symantec Endpoint Protection Mobile |
[OOTB] Syslog-CEF |
Syslog |
Designed for processing events in the CEF format. |
Broadcom Symantec Threat Hunting Center |
[OOTB] Syslog-CEF |
Syslog |
Designed for processing events in the CEF format. |
Canonical LXD |
[OOTB] Canonical LXD syslog |
Syslog |
Designed for processing events received via syslog from the Canonical LXD system version 5.18. |
Checkpoint |
[OOTB] Checkpoint syslog |
Syslog |
[OOTB] Checkpoint syslog — designed for processing events received from the Checkpoint R81 firewall via the Syslog protocol. [OOTB] Checkpoint Syslog CEF by CheckPoint — designed for processing events in CEF format received from the Checkpoint firewall via the Syslog protocol. |
Cisco Access Control Server (ACS) |
[OOTB] Cisco ACS syslog |
regexp |
Designed for processing events of the Cisco Access Control Server (ACS) system received via Syslog. |
Cisco ASA |
[OOTB] Cisco ASA and IOS syslog |
Syslog |
Designed for certain events of Cisco ASA and Cisco IOS devices received via syslog. |
Cisco Email Security Appliance (WSA) |
[OOTB] Cisco WSA AccessFile |
regexp |
Designed for processing the event log of the Cisco Email Security Appliance (WSA) proxy server, the access.log file. |
Cisco Firepower Threat Defense |
[OOTB] Cisco ASA and IOS syslog |
Syslog |
Designed for processing events for network devices: Cisco ASA, Cisco IOS, Cisco Firepower Threat Defense (version 7.2) received via syslog. |
Cisco Identity Services Engine (ISE) |
[OOTB] Cisco ISE syslog |
regexp |
Designed for processing events of the Cisco Identity Services Engine (ISE) system received via Syslog. |
Cisco IOS |
[OOTB] Cisco ASA and IOS syslog |
Syslog |
Designed for certain events of Cisco ASA and Cisco IOS devices received via syslog. |
Cisco Netflow v5 |
[OOTB] NetFlow v5 |
netflow5 |
Designed for processing events from Cisco Netflow version 5. |
Cisco NetFlow v9 |
[OOTB] NetFlow v9 |
netflow9 |
Designed for processing events from Cisco Netflow version 9. |
Cisco Prime |
[OOTB] Cisco Prime syslog |
Syslog |
Designed for processing events of the Cisco Prime system version 3.10 received via syslog. |
Cisco Secure Email Gateway (SEG) |
[OOTB] Syslog-CEF |
Syslog |
Designed for processing events in the CEF format. |
Cisco Secure Firewall Management Center |
[OOTB] Syslog-CEF |
Syslog |
Designed for processing events in the CEF format. |
Cisco WLC |
[OOTB] Cisco WLC syslog
|
regexp
|
Normalizer for some types of events received from Cisco WLC network devices (2500 Series Wireless Controllers, 5500 Series Wireless Controllers, 8500 Series Wireless Controllers, Flex 7500 Series Wireless Controllers) via Syslog. |
Cisco WSA |
[OOTB] Cisco WSA file |
regexp |
Designed for processing the event log of the Cisco WSA 14.2, 15.0 proxy server. The normalizer supports processing events generated using the template: %t %e %a %w/%h %s %2r %A %H/%d %c %D %Xr %?BLOCK_SUSPECT_USER_AGENT,MONITOR_SUSPECT_USER_AGENT?%<User-Agent:%!%-%. %) %q %k %u %m. |
Citrix NetScaler |
[OOTB] Citrix NetScaler syslog |
regexp |
Designed for processing events received from the Citrix NetScaler 13.7 load balancer, Citrix ADC NS13.0. |
Claroty Continuous Threat Detection |
[OOTB] Syslog-CEF |
Syslog |
Designed for processing events in the CEF format. |
CloudPassage Halo |
[OOTB] Syslog-CEF |
Syslog |
Designed for processing events in the CEF format. |
Codemaster Mirada |
[OOTB] Codemaster Mirada syslog |
Syslog |
Designed for processing events of the Codemaster Mirada system received via syslog. |
CollabNet Subversion Edge |
[OOTB] CollabNet Subversion Edge syslog |
Syslog |
Designed for processing events received from the Subversion Edge (version 6.0.2) system via syslog. |
CommuniGate Pro |
[OOTB] CommuniGate Pro |
regexp |
Designed to process events of the CommuniGate Pro 6.1 system sent by the KUMA agent via TCP. |
Corvil Network Analytics |
[OOTB] Syslog-CEF |
Syslog |
Designed for processing events in the CEF format. |
Cribl Stream |
[OOTB] Syslog-CEF |
Syslog |
Designed for processing events in the CEF format. |
CrowdStrike Falcon Host |
[OOTB] Syslog-CEF |
Syslog |
Designed for processing events in the CEF format. |
CyberArk Privileged Threat Analytics (PTA) |
[OOTB] Syslog-CEF |
Syslog |
Designed for processing events in the CEF format. |
CyberPeak Spektr |
[OOTB] CyberPeak Spektr syslog |
Syslog |
Designed for processing events of the CyberPeak Spektr system version 3 received via syslog. |
Cyberprotect Cyber Backup |
[OOTB] Cyberprotect Cyber Backup SQL |
sql |
Designed for processing events received by the connector from the database of the Cyber Backup system (version 16.5). |
DeepInstinct |
[OOTB] Syslog-CEF |
Syslog |
Designed for processing events in the CEF format. |
Delinea Secret Server |
[OOTB] Syslog-CEF |
Syslog |
Designed for processing events in the CEF format. |
Digital Guardian Endpoint Threat Detection |
[OOTB] Syslog-CEF |
Syslog |
Designed for processing events in the CEF format. |
BIND DNS server |
[OOTB] BIND Syslog [OOTB] BIND file |
Syslog regexp |
[OOTB] BIND Syslog is designed for processing events of the BIND DNS server received via Syslog. [OOTB] BIND file is designed for processing event logs of the BIND DNS server. |
Docsvision |
[OOTB] Docsvision syslog |
Syslog |
Designed for processing audit events received from the Docsvision system via syslog. |
Dovecot |
[OOTB] Dovecot Syslog |
Syslog |
Designed for processing events of the Dovecot mail server received via Syslog. The event source is POP3/IMAP logs. |
Dragos Platform |
[OOTB] Syslog-CEF |
Syslog |
Designed for processing events in the CEF format. |
Dr.Web Enterprise Security Suite |
[OOTB] Syslog-CEF |
syslog |
Designed for processing Dr.Web Enterprise Security Suite 13.0.1 events in the CEF format. |
EclecticIQ Intelligence Center |
[OOTB] Syslog-CEF |
Syslog |
Designed for processing events in the CEF format. |
Edge Technologies AppBoard and enPortal |
[OOTB] Syslog-CEF |
Syslog |
Designed for processing events in the CEF format. |
Eltex ESR |
[OOTB] Eltex ESR syslog |
Syslog |
Designed to process part of the events received from Eltex ESR network devices via syslog. |
Eltex MES |
[OOTB] Eltex MES syslog |
regexp |
Designed for processing events received from Eltex MES network devices via syslog (supported device models: MES14xx, MES24xx, MES3708P). |
Eset Protect |
[OOTB] Syslog-CEF |
Syslog |
Designed for processing events in the CEF format. |
Extreme Networks Summit Wireless Controller
|
[OOTB] Extreme Networks Summit Wireless Controller
|
regexp
|
Normalizer for certain audit events of the Extreme Networks Summit Wireless Controller (model: WM3700, firmware version: 5.5.5.0-018R).
|
Factor-TS Dionis NX |
[OOTB] Factor-TS Dionis NX syslog |
regexp |
Designed for processing some audit events received from the Dionis-NX system (version 2.0.3) via syslog. |
F5 Advanced Web Application Firewall |
[OOTB] F5 Advanced Web Application Firewall syslog |
regexp |
Designed for processing audit events received from the F5 Advanced Web Application Firewall system via syslog. |
F5 BigIP Advanced Firewall Manager (AFM) |
[OOTB] Syslog-CEF |
Syslog |
Designed for processing events in the CEF format. |
FFRI FFR yarai |
[OOTB] Syslog-CEF |
Syslog |
Designed for processing events in the CEF format. |
FireEye CM Series |
[OOTB] Syslog-CEF |
Syslog |
Designed for processing events in the CEF format. |
FireEye Malware Protection System |
[OOTB] Syslog-CEF |
Syslog |
Designed for processing events in the CEF format. |
Forcepoint NGFW |
[OOTB] Syslog-CEF |
Syslog |
Designed for processing events in the CEF format. |
Forcepoint SMC |
[OOTB] Syslog-CEF |
Syslog |
Designed for processing events in the CEF format. |
Fortinet FortiAnalyzer |
[OOTB] Syslog-CEF |
Syslog |
Designed for processing events in the CEF format. |
Fortinet FortiGate |
[OOTB] Syslog-CEF |
regexp |
Designed for processing events in the CEF format. |
Fortinet FortiGate |
[OOTB] FortiGate syslog KV |
Syslog |
Designed for processing events from FortiGate firewalls (version 7.0) via syslog. The event source is FortiGate logs in key-value format. |
Fortinet Fortimail |
[OOTB] Fortimail |
regexp |
Designed for processing events of the FortiMail email protection system. The event source is Fortimail mail system logs. |
Fortinet FortiSOAR |
[OOTB] Syslog-CEF |
Syslog |
Designed for processing events in the CEF format. |
FreeBSD |
[OOTB] FreeBSD file |
regexp |
Designed for processing events of the FreeBSD operating system (version 13.1-RELEASE) stored in a file. The normalizer can process files produced by the praudit utility. Example: praudit -xl /var/audit/AUDITFILE >> file_name.log |
FreeIPA |
[OOTB] FreeIPA |
json |
Designed for processing events from the FreeIPA system. The event source is Free IPA directory service logs. |
FreeRADIUS |
[OOTB] FreeRADIUS syslog |
Syslog |
Designed for processing events of the FreeRADIUS system received via Syslog. The normalizer supports events from FreeRADIUS version 3.0. |
GajShield Firewall |
[OOTB] GajShield Firewall syslog |
regexp |
Designed for processing part of the events received from the GajShield Firewall version GAJ_OS_Bulwark_Firmware_v4.35 via syslog. |
Garda Monitor |
[OOTB] Garda Monitor syslog |
syslog |
Designed for processing events of the Garda Monitor system version 3.4 received via syslog. |
Gardatech GardaDB |
[OOTB] Gardatech GardaDB syslog |
Syslog |
Designed for processing events of the Gardatech Perimeter system version 5.3, 5.4 received via syslog. |
Gardatech Perimeter |
[OOTB] Gardatech Perimeter syslog |
Syslog |
Designed for processing events of the Gardatech Perimeter system version 5.3 received via syslog. |
Gigamon GigaVUE |
[OOTB] Syslog-CEF |
Syslog |
Designed for processing events in the CEF format. |
HAProxy |
[OOTB] HAProxy syslog |
Syslog |
Designed for processing logs of the HAProxy system. The normalizer supports events of the HTTP log, TCP log, Error log type from HAProxy version 2.8. |
HashiCorp Vault |
[OOTB] HashiCorp Vault json |
json |
Designed for processing events received from the HashiCorp Vault system version 1.16 in JSON format. The normalizer package is available in KUMA 3.0 and later. |
Huawei Eudemon |
[OOTB] Huawei Eudemon |
regexp |
Designed for processing events from Huawei Eudemon firewalls. The event source is logs of Huawei Eudemon firewalls. |
Huawei iManager 2000 |
[OOTB] Huawei iManager 2000 file
|
regexp
|
This normalizer supports processing some of the events of the Huawei iManager 2000 system, which are stored in the \client\logs\rpc, \client\logs\deploy\ossDeployment files.
|
Huawei USG |
[OOTB] Huawei USG Basic |
Syslog |
Designed for processing events received from Huawei USG security gateways via Syslog. |
Huawei VRP |
[OOTB] Huawei VRP syslog |
regexp |
Designed for processing some types of Huawei VRP system events received via syslog. The normalizer makes a partial selection of event data. The normalizer is available in KUMA 3.0 and later. |
IBM InfoSphere Guardium |
[OOTB] Syslog-CEF |
Syslog |
Designed for processing events in the CEF format. |
Ideco UTM |
[OOTB] Ideco UTM Syslog |
Syslog |
Designed for processing events received from Ideco UTM via Syslog. The normalizer supports events of Ideco UTM 14.7, 14.10, 17.5. |
Illumio Policy Compute Engine (PCE) |
[OOTB] Syslog-CEF |
Syslog |
Designed for processing events in the CEF format. |
Imperva Incapsula |
[OOTB] Syslog-CEF |
Syslog |
Designed for processing events in the CEF format. |
Imperva SecureSphere |
[OOTB] Syslog-CEF |
Syslog |
Designed for processing events in the CEF format. |
Indeed Access Manager |
[OOTB] Indeed Access Manager syslog |
Syslog |
Designed for processing events received from the Indeed Access Manager system via syslog. |
Indeed PAM |
[OOTB] Indeed PAM syslog |
Syslog |
Designed for processing events of Indeed PAM (Privileged Access Manager) version 2.6. |
Indeed SSO |
[OOTB] Indeed SSO xml |
xml |
Designed for processing events of the Indeed SSO (Single Sign-On) system. The normalizer supports KUMA 2.1.3 and later. |
InfoWatch Person Monitor |
[OOTB] InfoWatch Person Monitor SQL |
sql |
Designed for processing system audit events from the MS SQL database of InfoWatch Person Monitor 10.2. |
InfoWatch Traffic Monitor |
[OOTB] InfoWatch Traffic Monitor SQL |
sql |
Designed for processing events received by the connector from the database of the InfoWatch Traffic Monitor system. |
Intralinks VIA |
[OOTB] Syslog-CEF |
Syslog |
Designed for processing events in the CEF format. |
IPFIX |
[OOTB] IPFIX |
ipfix |
Designed for processing events in the IP Flow Information Export (IPFIX) format. |
Juniper JUNOS |
[OOTB] Juniper - JUNOS |
regexp |
Designed for processing audit events received from Juniper network devices. |
Kaspersky Anti Targeted Attack (KATA) |
[OOTB] KATA |
cef |
Designed for processing alerts or events from the Kaspersky Anti Targeted Attack activity log. |
Kaspersky CyberTrace |
[OOTB] CyberTrace |
regexp |
Designed for processing Kaspersky CyberTrace events. |
Kaspersky Endpoint Detection and Response (KEDR) |
[OOTB] KEDR telemetry |
json |
Designed for processing Kaspersky EDR telemetry tagged by KATA. The event source is kafka, EnrichedEventTopic |
KICS/KATA |
[OOTB] KICS4Net v2.x |
cef |
Designed for processing KICS/KATA version 2.x events. |
KICS/KATA |
[OOTB] KICS4Net v3.x |
Syslog |
Designed for processing KICS/KATA version 3.x events. |
KICS/KATA 4.2 |
[OOTB] Kaspersky Industrial CyberSecurity for Networks 4.2 syslog |
Syslog |
Designed for processing events received from the KICS/KATA 4.2 system via syslog. |
Kaspersky KISG |
[OOTB] Kaspersky KISG syslog |
Syslog |
Designed for processing events received from Kaspersky IoT Secure Gateway (KISG) 3.0 via syslog. |
Open Single Management Platform |
[OOTB] KSC |
cef |
Designed for processing Open Single Management Platform events received in CEF format. |
Open Single Management Platform |
[OOTB] KSC from SQL |
sql |
Designed for processing events received by the connector from the database of the Open Single Management Platform system. |
Kaspersky Security for Linux Mail Server (KLMS) |
[OOTB] KLMS Syslog CEF |
Syslog |
Designed for processing events from Kaspersky Security for Linux Mail Server in CEF format via Syslog. |
Kaspersky Security for MS Exchange SQL
|
[OOTB] Kaspersky Security for MS Exchange SQL
|
sql
|
Normalizer for Kaspersky Security for Exchange (KSE) 9.0 events stored in the database.
|
Kaspersky Secure Mail Gateway (KSMG) |
[OOTB] KSMG Syslog CEF |
Syslog |
Designed for processing events of Kaspersky Secure Mail Gateway version 2.0 in CEF format via Syslog. |
Kaspersky Web Traffic Security (KWTS) |
[OOTB] KWTS Syslog CEF |
Syslog |
Designed for processing events received from Kaspersky Web Traffic Security in CEF format via Syslog. |
Kaspersky Web Traffic Security (KWTS) |
[OOTB] KWTS (KV) |
Syslog |
Designed for processing events in Kaspersky Web Traffic Security for Key-Value format. |
Kemptechnologies LoadMaster |
[OOTB] Syslog-CEF |
Syslog |
Designed for processing events in the CEF format. |
Kerio Control |
[OOTB] Kerio Control |
Syslog |
Designed for processing events of Kerio Control firewalls. |
KUMA |
[OOTB] KUMA forwarding |
json |
Designed for processing events forwarded from KUMA. |
Libvirt |
[OOTB] Libvirt syslog |
Syslog |
Designed for processing events of Libvirt version 8.0.0 received via syslog. |
Lieberman Software ERPM |
[OOTB] Syslog-CEF |
Syslog |
Designed for processing events in the CEF format. |
Linux |
[OOTB] Linux audit and iptables Syslog v1 |
Syslog |
Designed for processing events of the Linux operating system. This normalizer does not support processing events in the "ENRICHED" format. |
MariaDB |
[OOTB] MariaDB Audit Plugin Syslog |
Syslog |
Designed for processing events coming from the MariaDB audit plugin over Syslog. |
Microsoft 365 (Office 365) |
[OOTB] Microsoft Office 365 json |
json |
This normalizer is designed for processing Microsoft 365 events. |
Microsoft Active Directory Federation Service (AD FS) |
[OOTB] Microsoft Products for KUMA 3 |
xml |
Designed for processing Microsoft AD FS events. The [OOTB] Microsoft Products for KUMA 3 normalizer supports this event source in KUMA 3.0.1 and later versions. |
Microsoft Active Directory Domain Service (AD DS) |
[OOTB] Microsoft Products for KUMA 3 |
xml |
Designed for processing Microsoft AD DS events. The [OOTB] Microsoft Products for KUMA 3 normalizer supports this event source in KUMA 3.0.1 and later versions. |
Microsoft Defender |
[OOTB] Microsoft Products, [OOTB] Microsoft Products for KUMA 3 |
xml |
Designed for processing Microsoft Defender events. |
Microsoft DHCP |
[OOTB] MS DHCP file |
regexp |
Designed for processing Microsoft DHCP server events. The event source is Windows DHCP server logs. |
Microsoft DNS |
[OOTB] DNS Windows |
regexp |
Designed for processing Microsoft DNS server events. The event source is Windows DNS server logs. |
Microsoft Exchange |
[OOTB] Exchange CSV |
csv |
Designed for processing the event log of the Microsoft Exchange system. The event source is Exchange server MTA logs. |
Microsoft Hyper-V |
[OOTB] Microsoft Products, [OOTB] Microsoft Products for KUMA 3 |
xml |
Designed for processing Microsoft Windows events. The event source is Microsoft Hyper-V logs: Microsoft-Windows-Hyper-V-VMMS-Admin, Microsoft-Windows-Hyper-V-Compute-Operational, Microsoft-Windows-Hyper-V-Hypervisor-Operational, Microsoft-Windows-Hyper-V-StorageVSP-Admin, Microsoft-Windows-Hyper-V-Hypervisor-Admin, Microsoft-Windows-Hyper-V-VMMS-Operational, Microsoft-Windows-Hyper-V-Compute-Admin. |
Microsoft IIS |
[OOTB] IIS Log File Format |
regexp |
The normalizer processes events in the format described at https://learn.microsoft.com/en-us/windows/win32/http/iis-logging. The event source is Microsoft IIS logs. |
Microsoft Network Policy Server (NPS) |
[OOTB] Microsoft Products, [OOTB] Microsoft Products for KUMA 3 |
xml |
The normalizer is designed for processing events of the Microsoft Windows operating system. The event source is Network Policy Server events. |
Microsoft SCCM |
[OOTB] Microsoft SCCM file |
regexp |
Designed for processing events of the Microsoft SCCM system version 2309. The normalizer supports processing of some of the events stored in the AdminService.log file. |
Microsoft SharePoint Server |
[OOTB] Microsoft SharePoint Server diagnostic log file |
regexp |
The normalizer supports processing part of Microsoft SharePoint Server 2016 events stored in diagnostic logs. |
Microsoft Sysmon |
[OOTB] Microsoft Products, [OOTB] Microsoft Products for KUMA 3 |
xml |
This normalizer is designed for processing Microsoft Sysmon module events. |
Microsoft Windows 7, 8.1, 10, 11 |
[OOTB] Microsoft Products, [OOTB] Microsoft Products for KUMA 3, [OOTB] Microsoft Products via KES WIN
|
xml |
Designed for processing part of events from the Security, System, Application logs of the Microsoft Windows operating system. The "[OOTB] Microsoft Products via KES WIN" normalizer supports a limited number of audit event types sent to KUMA by Kaspersky Endpoint Security 12.6 for Windows via Syslog.
|
Microsoft PowerShell |
[OOTB] Microsoft Products, [OOTB] Microsoft Products for KUMA 3, [OOTB] Microsoft Products via KES WIN |
xml |
Designed for processing Microsoft Windows PowerShell log events. The "[OOTB] Microsoft Products via KES WIN" normalizer supports a limited number of audit event types sent to KUMA by Kaspersky Endpoint Security 12.6 for Windows via Syslog. |
Microsoft SQL Server |
[Deprecated][OOTB] Microsoft SQL Server xml |
xml |
Designed for processing events of MS SQL Server versions 2008, 2012, 2014, 2016. The normalizer supports KUMA 2.1.3 and later. |
Microsoft Windows Remote Desktop Services |
[OOTB] Microsoft Products, [OOTB] Microsoft Products for KUMA 3, [OOTB] Microsoft Products via KES WIN |
xml |
Designed for processing Microsoft Windows events. The event source is the log at Applications and Services Logs - Microsoft - Windows - TerminalServices-LocalSessionManager - Operational The "[OOTB] Microsoft Products via KES WIN" normalizer supports a limited number of audit event types sent to KUMA by Kaspersky Endpoint Security 12.6 for Windows via Syslog.
|
Microsoft Windows Server 2008 R2, 2012 R2, 2016, 2019, 2022 |
[OOTB] Microsoft Products, [OOTB] Microsoft Products for KUMA 3, [OOTB] Microsoft Products via KES WIN |
xml |
Designed for processing part of events from the Security, System logs of the Microsoft Windows Server operating system. The "[OOTB] Microsoft Products via KES WIN" normalizer supports a limited number of audit event types sent to KUMA by Kaspersky Endpoint Security 12.6 for Windows via Syslog. |
Microsoft Windows XP/2003 |
[OOTB] SNMP. Windows {XP/2003} |
json |
Designed for processing events received from workstations and servers running Microsoft Windows XP, Microsoft Windows 2003 operating systems using the SNMP protocol. |
Microsoft WSUS |
[OOTB] Microsoft WSUS file |
regexp |
Designed for processing events of the Gardatech Perimeter system version 5.3, 5.4 received via syslog. |
MikroTik |
[OOTB] MikroTik syslog |
regexp |
Designed for events received from MikroTik devices via Syslog. |
Minerva Labs Minerva EDR |
[OOTB] Minerva EDR |
regexp |
Designed for processing events from the Minerva EDR system. |
MongoDb |
[OOTB] MongoDb syslog |
Syslog |
Designed for processing part of events received from the MongoDB 7.0 database via syslog. |
Multifactor Radius Server for Windows |
[OOTB] Multifactor Radius Server for Windows syslog |
Syslog |
Designed for processing events received from the Multifactor Radius Server 1.0.2 for Microsoft Windows via Syslog. |
MySQL 5.7 |
[OOTB] MariaDB Audit Plugin Syslog |
Syslog |
Designed for processing events coming from the MariaDB audit plugin over Syslog. |
NetApp ONTAP (AFF, FAM) |
[OOTB] NetApp syslog, [OOTB] NetApp file |
regexp |
[OOTB] NetApp syslog — designed for processing events of the NetApp system (version — ONTAP 9.12) received via syslog. [OOTB] NetApp file — designed for processing events of the NetApp system (version — ONTAP 9.12) stored in a file. |
NetApp SnapCenter |
[OOTB] NetApp SnapCenter file |
regexp |
Designed to process part of the events of the NetApp SnapCenter system (SnapCenter Server 5.0). The normalizer supports processing some of the events from the C:\Program Files\NetApp\SnapCenter WebApp\App_Data\log\napManagerWeb.*.log file. Types of supported events in xml format from the SnapManagerWeb.*.log file: SmDiscoverPluginRequest, SmDiscoverPluginResponse, SmGetDomainsResponse, SmGetHostPluginStatusRequest, SmGetHostPluginStatusResponse, SmGetHostRequest, SmGetHostResponse, SmRequest. The normalizer supports processing some of the events from the C:\Program Files\NetApp\SnapCenter WebApp\App_Data\log\audit.log file. |
NetIQ Identity Manager |
[OOTB] Syslog-CEF |
Syslog |
Designed for processing events in the CEF format. |
NetScout Systems nGenius Performance Manager |
[OOTB] Syslog-CEF |
Syslog |
Designed for processing events in the CEF format. |
Netskope Cloud Access Security Broker |
[OOTB] Syslog-CEF |
Syslog |
Designed for processing events in the CEF format. |
Netwrix Auditor |
[OOTB] Syslog-CEF |
Syslog |
Designed for processing events in the CEF format. |
Nextcloud |
[OOTB] Nextcloud syslog |
Syslog |
Designed for events of Nextcloud version 26.0.4 received via syslog. The normalizer does not save information from the Trace field. |
Nexthink Engine |
[OOTB] Syslog-CEF |
Syslog |
Designed for processing events in the CEF format. |
Nginx |
[OOTB] Nginx regexp |
regexp |
Designed for processing Nginx web server log events. |
NIKSUN NetDetector |
[OOTB] Syslog-CEF |
Syslog |
Designed for processing events in the CEF format. |
One Identity Privileged Session Management |
[OOTB] Syslog-CEF |
Syslog |
Designed for processing events in the CEF format. |
OpenLDAP |
[OOTB] OpenLDAP |
regexp |
Designed for line-by-line processing of some events of the OpenLDAP 2.5 system in an auditlog.ldif file. |
Open VPN |
[OOTB] OpenVPN file |
regexp |
Designed for processing the event log of the OpenVPN system. |
Oracle |
[OOTB] Oracle Audit Trail |
sql |
Designed for processing database audit events received by the connector directly from an Oracle database. |
OrionSoft Termit |
[OOTB] OrionSoft Termit syslog |
syslog |
Designed for processing events received from the OrionSoft Termit 2.2 system via syslog. |
Orion soft zVirt |
[OOTB] Orion Soft zVirt syslog |
regexp |
Designed for processing events of the Orion soft zVirt 3.1 virtualization system. |
PagerDuty |
[OOTB] Syslog-CEF |
Syslog |
Designed for processing events in the CEF format. |
Palo Alto Cortex Data Lake |
[OOTB] Syslog-CEF |
Syslog |
Designed for processing events in the CEF format. |
Palo Alto Networks NGFW |
[OOTB] PA-NGFW (Syslog-CSV) |
Syslog |
Designed for processing events from Palo Alto Networks firewalls received via Syslog in CSV format. |
Palo Alto Networks PANOS |
[OOTB] Syslog-CEF |
Syslog |
Designed for processing events in the CEF format. |
Parsec ParsecNet |
[OOTB] Parsec ParsecNet |
sql |
Designed for processing events received by the connector from the database of the Parsec ParsecNet 3 system. |
Passwork |
[OOTB] Passwork syslog |
Syslog |
Designed for processing events received from the Passwork version 050219 system via Syslog. |
Penta Security WAPPLES |
[OOTB] Syslog-CEF |
Syslog |
Designed for processing events in the CEF format. |
Positive Technologies ISIM |
[OOTB] PTsecurity ISIM |
regexp |
Designed for processing events from the PT Industrial Security Incident Manager system. |
Positive Technologies Sandbox |
[OOTB] PTsecurity Sandbox |
regexp |
Designed for processing events of the PT Sandbox system. |
Positive Technologies Web Application Firewall |
[OOTB] PTsecurity WAF |
Syslog |
Designed for processing events from the PTsecurity (Web Application Firewall) system. |
Postfix |
[OOTB] Postfix syslog |
regexp |
The [OOTB] Postfix package contains a set of resources for processing Postfix 3.6 events. It supports processing syslog events received over TCP. The package is available for KUMA 3.0 and newer versions. |
PostgreSQL pgAudit |
[OOTB] PostgreSQL pgAudit Syslog |
Syslog |
Designed for processing events of the pgAudit audit plug-in for the PostgreSQL database received via Syslog. |
PowerDNS |
[OOTB] PowerDNS syslog |
Syslog |
Designed for processing events of PowerDNS Authoritative Server 4.5 received via Syslog. |
Proofpoint Insider Threat Management |
[OOTB] Syslog-CEF |
Syslog |
Designed for processing events in the CEF format. |
Proxmox |
[OOTB] Proxmox file |
regexp |
Designed for processing events of the Proxmox system version 7.2-3 stored in a file. The normalizer supports processing of events in access and pveam logs. |
PT NAD |
[OOTB] PT NAD json |
json |
Designed for processing events coming from PT NAD in json format. This normalizer supports events from PT NAD version 11.1, 11.0. |
QEMU - hypervisor logs |
[OOTB] QEMU - Hypervisor file |
regexp |
Designed for processing events of the QEMU hypervisor stored in a file. QEMU 6.2.0 and Libvirt 8.0.0 are supported. |
QEMU - virtual machine logs |
[OOTB] QEMU - Virtual Machine file |
regexp |
Designed for processing events from logs of virtual machines of the QEMU hypervisor version 6.2.0, stored in a file. |
Radware DefensePro AntiDDoS |
[OOTB] Radware DefensePro AntiDDoS |
Syslog |
Designed for processing events from the DDOS Mitigator protection system received via Syslog. |
Reak Soft Blitz Identity Provider |
[OOTB] Reak Soft Blitz Identity Provider file |
regexp |
Designed for processing events of the Reak Soft Blitz Identity Provider system version 5.16, stored in a file. |
RedCheck Desktop |
[OOTB] RedCheck Desktop file |
regexp |
Designed for processing logs of the RedCheck Desktop 2.6 system stored in a file. |
RedCheck WEB |
[OOTB] RedCheck WEB file |
regexp |
Designed for processing logs of the RedCheck Web 2.6 system stored in files. |
RED SOFT RED ADM |
[OOTB] RED SOFT RED ADM syslog |
regexp |
Designed for processing events received from the RED ADM system (RED ADM: Industrial edition 1.1) via syslog. The normalizer supports processing: - Management subsystem events - Controller events |
ReversingLabs N1000 Appliance |
[OOTB] Syslog-CEF |
Syslog |
Designed for processing events in the CEF format. |
Rubicon Communications pfSense |
[OOTB] pfSense Syslog |
Syslog |
Designed for processing events from the pfSense firewall received via Syslog. |
Rubicon Communications pfSense |
[OOTB] pfSense w/o hostname |
Syslog |
Designed for processing events from the pfSense firewall. The Syslog header of these events does not contain a hostname. |
SailPoint IdentityIQ |
[OOTB] Syslog-CEF |
Syslog |
Designed for processing events in the CEF format. |
SecurityCode Continent 4 |
[OOTB] SecurityCode Continent 4 syslog |
regexp |
Designed for processing events of the SecurityCode Continent system version 4 received via syslog. |
Sendmail |
[OOTB] Sendmail syslog |
Syslog |
Designed for processing events of Sendmail version 8.15.2 received via syslog. |
SentinelOne |
[OOTB] Syslog-CEF |
Syslog |
Designed for processing events in the CEF format. |
Skype for Business |
[OOTB] Microsoft Products for KUMA 3 |
xml |
Designed for processing some of the events from the log of the Skype for Business system, the Lync Server log. |
Snort |
[OOTB] Snort 3 json file |
json |
Designed for processing events of Snort version 3 in JSON format. |
Sonicwall TZ |
[OOTB] Sonicwall TZ Firewall |
Syslog |
Designed for processing events received via Syslog from the SonicWall TZ firewall. |
SolarWinds DameWare MRC
|
[OOTB] SolarWinds DameWare MRC xml
|
xml
|
This normalizer supports processing some of the DameWare Mini Remote Control (MRC) 7.5 events stored in the Application log of Windows. The normalizer processes events generated by the "dwmrcs" provider.
|
Sophos Firewall |
[OOTB] Sophos Firewall syslog |
regexp |
Designed for processing events received from Sophos Firewall 20 via syslog. |
Sophos XG |
[OOTB] Sophos XG |
regexp |
Designed for processing events from the Sophos XG firewall. |
Squid |
[OOTB] Squid access Syslog |
Syslog |
Designed for processing events of the Squid proxy server received via the Syslog protocol. |
Squid |
[OOTB] Squid access.log file |
regexp |
Designed for processing Squid log events from the Squid proxy server. The event source is access.log logs |
S-Terra VPN Gate |
[OOTB] S-Terra |
Syslog |
Designed for processing events from S-Terra VPN Gate devices. |
Suricata |
[OOTB] Suricata json file |
json |
This package contains a normalizer for Suricata 7.0.1 events stored in a JSON file. The normalizer supports processing the following event types: flow, anomaly, alert, dns, http, ssl, tls, ftp, ftp_data, ftp, smb, rdp, pgsql, modbus, quic, dhcp, bittorrent_dht, rfb. |
ThreatConnect Threat Intelligence Platform |
[OOTB] Syslog-CEF |
Syslog |
Designed for processing events in the CEF format. |
ThreatQuotient |
[OOTB] Syslog-CEF |
Syslog |
Designed for processing events in the CEF format. |
Tionix Cloud Platform |
[OOTB] Tionix Cloud Platform syslog |
Syslog |
Designed for processing events of the Tionix Cloud Platform system version 2.9 received via syslog. The normalizer makes a partial selection of event data. The normalizer is available in KUMA 3.0 and later. |
Tionix VDI
|
[OOTB] Tionix VDI file
|
regexp
|
This normalizer supports processing some of the Tionix VDI system (version 2.8) events stored in the tionix_lntmov.log file.
|
TrapX DeceptionGrid |
[OOTB] Syslog-CEF |
Syslog |
Designed for processing events in the CEF format. |
Trend Micro Control Manager |
[OOTB] Syslog-CEF |
Syslog |
Designed for processing events in the CEF format. |
Trend Micro Deep Security |
[OOTB] Syslog-CEF |
Syslog |
Designed for processing events in the CEF format. |
Trend Micro NGFW |
[OOTB] Syslog-CEF |
Syslog |
Designed for processing events in the CEF format. |
Trustwave Application Security DbProtect |
[OOTB] Syslog-CEF |
Syslog |
Designed for processing events in the CEF format. |
Unbound |
[OOTB] Unbound Syslog |
Syslog |
Designed for processing events from the Unbound DNS server received via Syslog. |
UserGate |
[OOTB] Syslog-CEF |
Syslog |
Designed for processing events in the CEF format received from the UserGate system via Syslog. |
Varonis DatAdvantage |
[OOTB] Syslog-CEF |
Syslog |
Designed for processing events in the CEF format. |
Veriato 360 |
[OOTB] Syslog-CEF |
Syslog |
Designed for processing events in the CEF format. |
ViPNet TIAS |
[OOTB] Vipnet TIAS syslog |
Syslog |
Designed for processing events of ViPNet TIAS 3.8 received via Syslog. |
VMware ESXi |
[OOTB] VMware ESXi syslog |
regexp |
Designed for processing VMware ESXi events (support for a limited number of events from ESXi versions 5.5, 6.0, 6.5, 7.0) received via Syslog. |
VMWare Horizon |
[OOTB] VMware Horizon - Syslog |
Syslog |
Designed for processing events received from the VMware Horizon 2106 system via Syslog. |
VMwareCarbon Black EDR |
[OOTB] Syslog-CEF |
Syslog |
Designed for processing events in the CEF format. |
Vormetric Data Security Manager |
[OOTB] Syslog-CEF |
Syslog |
Designed for processing events in the CEF format. |
Votiro Disarmer for Windows |
[OOTB] Syslog-CEF |
Syslog |
Designed for processing events in the CEF format. |
Wallix AdminBastion |
[OOTB] Wallix AdminBastion syslog |
regexp |
Designed for processing events received from the Wallix AdminBastion system via Syslog. |
WatchGuard - Firebox |
[OOTB] WatchGuard Firebox |
Syslog |
Designed for processing WatchGuard Firebox events received via Syslog. |
Webroot BrightCloud |
[OOTB] Syslog-CEF |
Syslog |
Designed for processing events in the CEF format. |
Winchill Fracas |
[OOTB] PTC Winchill Fracas |
regexp |
Designed for processing events of the Windchill FRACAS failure registration system. |
Yandex Browser corporate |
[OOTB] Yandex Browser |
json |
Designed for processing events received from the corporate version of Yandex Browser 23 or 24.4. |
Yandex Cloud |
[OOTB] Yandex Cloud |
regexp |
Designed for processing part of Yandex Cloud audit events. The normalizer supports processing audit log events of the configuration level: IAM (Yandex Identity and Access Management), Compute (Yandex Compute Cloud), Network (Yandex Virtual Private Cloud), Storage (Yandex Object Storage), Resourcemanager (Yandex Resource Manager). |
Zabbix |
[OOTB] Zabbix SQL |
sql |
Designed for processing events of Zabbix 6.4. |
Zecurion DLP |
[OOTB] Zecurion DLP syslog |
regexp |
Designed for processing events of the Zecurion DLP system version 12.0 received via syslog. |
ZEEK IDS |
[OOTB] ZEEK IDS json file |
json |
Designed for processing logs of the ZEEK IDS system in JSON format. The normalizer supports events from ZEEK IDS version 1.8. |
Zettaset BDEncrypt |
[OOTB] Syslog-CEF |
Syslog |
Designed for processing events in the CEF format. |
Zscaler Nanolog Streaming Service (NSS) |
[OOTB] Syslog-CEF |
Syslog |
Designed for processing events in the CEF format. |
IT-Bastion – SKDPU |
[OOTB] Syslog-CEF |
Syslog |
Designed for processing events in the CEF format received from the IT-Bastion SKDPU system via Syslog. |
A-Real Internet Control Server (ICS) |
[OOTB] A-real IKS syslog |
regexp |
Designed for processing events of the A-Real Internet Control Server (ICS) system received via Syslog. The normalizer supports events from A-Real ICS version 7.0 and later. |
Apache web server |
[OOTB] Apache HTTP Server file |
regexp |
Designed for processing Apache HTTP Server 2.4 events stored in a file. The normalizer supports processing of events from the Application log in the Common or Combined Log formats, as well as the Error log. Expected format of the Error log events: "[%t] [%-m:%l] [pid %P:tid %T] [server\ %v] [client\ %a] %E: %M;\ referer\ %-{Referer}i" |
Apache web server |
[OOTB] Apache HTTP Server syslog |
Syslog |
Designed for processing events of the Apache HTTP Server received via syslog. The normalizer supports processing of Apache HTTP Server 2.4 events from the Access log in the Common or Combined Log format, as well as the Error log. Expected format of the Error log events: "[%t] [%-m:%l] [pid %P:tid %T] [server\ %v] [client\ %a] %E: %M;\ referer\ %-{Referer}i" |
Lighttpd web server |
[OOTB] Lighttpd syslog |
Syslog |
Designed for processing Access events of the Lighttpd system received via syslog. The normalizer supports processing of Lighttpd version 1.4 events. Expected format of Access log events: $remote_addr $http_request_host_name $remote_user [$time_local] "$request" $status $body_bytes_sent "$http_referer" "$http_user_agent" |
IVK Kolchuga-K |
[OOTB] Kolchuga-K Syslog |
Syslog |
Designed for processing events from the IVK Kolchuga-K system, version LKNV.466217.002, via Syslog. |
infotecs ViPNet IDS |
[OOTB] Syslog-CEF |
Syslog |
Designed for processing events in the CEF format received from the infotecs ViPNet IDS system via Syslog. |
infotecs ViPNet Coordinator |
[OOTB] VipNet Coordinator Syslog |
Syslog |
Designed for processing events from the ViPNet Coordinator system received via Syslog. |
Kod Bezopasnosti — Continent |
[OOTB][regexp] Continent IPS/IDS & TLS |
regexp |
Designed for processing events of Continent IPS/IDS device log. |
Kod Bezopasnosti — Continent |
[OOTB] Continent SQL |
sql |
Designed for getting events of the Continent system from the database. |
Kod Bezopasnosti SecretNet 7 |
[OOTB] SecretNet SQL |
sql |
Designed for processing events received by the connector from the database of the SecretNet system. |
Confident - Dallas Lock |
[OOTB] Confident Dallas Lock |
regexp |
Designed for processing events from the Dallas Lock 8 information protection system. |
CryptoPro NGate |
[OOTB] Ngate Syslog |
Syslog |
Designed for processing events received from the CryptoPro NGate system via Syslog. |
H3C (Huawei-3Com) routers
|
[OOTB] H3C Routers syslog
|
regexp
|
Normalizer for some types of events received from H3C (Huawei-3Com) SR6600 network devices (Comware 7 firmware) via Syslog. The normalizer supports the "standard" event format (RFC 3164-compliant format).
|
NT Monitoring and Analytics |
[OOTB] Syslog-CEF |
Syslog |
Designed for processing events in the CEF format received from the NT Monitoring and Analytics system via Syslog. |
BlueCoat proxy server |
[OOTB] BlueCoat Proxy v0.2 |
regexp |
Designed to process BlueCoat proxy server events. The event source is the BlueCoat proxy server event log. |
SKDPU NT Access Gateway |
[OOTB] Bastion SKDPU-GW |
Syslog |
Designed for processing events of the SKDPU NT Access gateway system received via Syslog. |
Solar Dozor |
[OOTB] Solar Dozor Syslog |
Syslog |
Designed for processing events received from the Solar Dozor system version 7.9 via Syslog. The normalizer supports custom format events and does not support CEF format events. |
- |
[OOTB] Syslog header |
Syslog |
Designed for processing events received via Syslog. The normalizer parses the header of the Syslog event, the message field of the event is not parsed. If necessary, you can parse the message field using other normalizers. |
Aggregation rules
Aggregation rules let you combine repetitive events of the same type and replace them with one common event. Aggregation rules support fields of the standard KUMA event schema as well as fields of the extended event schema. In this way, you can reduce the number of similar events sent to the storage and/or the correlator, reduce the workload on services, conserve data storage space and licensing quota (EPS). An aggregation event is created when a time or number of events threshold is reached, whichever occurs first.
For aggregation rules, you can configure a filter and apply it only to events that match the specified conditions.
You can configure aggregation rules under Resources → Aggregation rules, and then select the created aggregation rule from the drop-down list in the collector settings. You can also configure aggregation rules directly in collector settings. Available aggregation rule settings are listed in the table below.
Available aggregation rule settings
Setting |
Description |
||
|---|---|---|---|
Name |
Unique name of the resource. Maximum length of the name: 128 Unicode characters. Required setting. |
||
Tenant |
The name of the tenant that owns the resource. Required setting. |
||
Threshold |
Threshold on the number of events. After accumulating the specified number of events with identical fields, the collector creates an aggregation event and begins accumulating events for the next aggregated event. The default value is |
||
Triggered rule lifetime |
Threshold on time in seconds. When the specified time expires, the accumulation of base events stops, the collector creates an aggregated event and starts obtaining events for the next aggregated event. The default value is Required setting. |
||
Description |
Description of the resource. Maximum length of the description: 4000 Unicode characters. |
||
Identical fields |
Fields of normalized events whose values must match. For example, for network events, Required setting. |
||
Unique fields |
Fields whose range of values must be preserved in the aggregated event. For example, if the |
||
Sum fields |
Fields whose values are summed up during aggregation and written to the same-name fields of the aggregated event. The following special considerations are relevant to field behavior:
|
||
Filter |
Conditions for determining which events must be processed by the resource. In the drop-down list, you can select an existing filter Create new to create a new filter. In aggregation rules, do not use filters with the TI operand or the TIDetect, inActiveDirectoryGroup, or hasVulnerability operators. The Creating a filter in resources To create a filter:
|
||
The KUMA distribution kit includes aggregation rules listed in the table below.
Predefined aggregation rules
Aggregation rule name |
Description |
[OOTB] Netflow 9 |
The rule is triggered after 100 events or 10 seconds. Events are aggregated by the following fields:
The |
Enrichment rules
Event enrichment involves adding information to events that can be used to identify and investigate an incident.
Enrichment rules let you add supplementary information to event fields by transforming data that is already present in the fields, or by querying data from external systems. For example, suppose that a user name is recorded in the event. You can use an enrichment rule to add information about the department, position, and manager of this user to the event fields.
Enrichment rules can be used in the following KUMA services and features:
- Collector. In the collector, you can create an enrichment rule, and it becomes a resource that you can reuse in other services. You can also link an enrichment rule created as a standalone resource.
- Correlator. In the correlator, you can create an enrichment rule, and it becomes a resource that you can reuse in other services. You can also link an enrichment rule created as a standalone resource.
- Normalizer. In the normalizer, you can only create an enrichment rule linked to that normalizer. Such a rule will not be available as a standalone resource for reuse in other services.
Available enrichment rule settings are listed in the table below.
Basic settings tab
Setting |
Description |
|---|---|
Name |
Required setting. Unique name of the resource. Must contain 1 to 128 Unicode characters. |
Tenant |
Required setting. The name of the tenant that owns the resource. |
Source kind |
Required setting. Drop-down list for selecting the type of incoming events. Depending on the selected type, you may see the following additional settings:
|
Debug |
You can use this toggle switch to enable the logging of service operations. Logging is disabled by default. |
Description |
Resource description: up to 4,000 Unicode characters. |
Filter |
Group of settings in which you can specify the conditions for identifying events that must be processed by this resource. You can select an existing filter from the drop-down list or create a new filter. Creating a filter in resources To create a filter:
|
Predefined enrichment rules
The KUMA distribution kit includes enrichment rules listed in the table below.
Predefined enrichment rules
Enrichment rule name |
Description |
[OOTB] KATA alert |
Used to enrich events received from KATA in the form of a hyperlink to an alert. The hyperlink is put in the DeviceExternalId field. |
Data collection and analysis rules
Data collection and analysis rules are used to recognize events from stored data.
Data collection and analysis rules, in contrast to real-time streaming correlation, allow using the SQL language to recognize and analyze events stored in the database.
To manage the section, you need one of the following roles: General administrator, Tenant administrator, Tier 1 analyst, Tier 2 analyst.
When creating or editing data collection and analysis rules, you need to specify the settings listed in the table below.
Settings of data collection and analysis rules
Setting |
Description |
Name |
Required setting. Unique name of the resource. Must contain 1 to 128 Unicode characters. |
Tenant |
Required setting. The name of the tenant that owns the resource. If you have access to only one tenant, this field is filled in automatically. If you have access to multiple tenants, the name of the first tenant from your list of available tenants is inserted. You can select any tenant from this list. |
Sql |
Required setting. The SQL query must contain an aggregation function with a LIMIT and/or a data grouping with a LIMIT. You must use a LIMIT value between 1 and 10,000. Examples of SQL queries
You can also use SQL function sets: |
Query interval |
Required setting. The interval for executing the SQL query. You can specify the interval in minutes, hours, and days. The minimum interval is 1 minute. The default timeout of the SQL query is equal to the interval that you specify in this field. If the execution of the SQL query takes longer than the timeout, an error occurs. In this case, we recommend increasing the interval. For example, if the interval is 1 minute, and the query takes 80 seconds to execute, we recommend setting the interval to at least 90 seconds. |
Tags |
Optional setting. Tags for resource search. |
Depth |
Optional setting. Expression for the lower bound of the interval for searching events in the database. To select a value from the list or to specify the depth as a relative interval, place the cursor in the field. For example, if you want to find all events from one hour ago to now, set the relative interval of |
Description |
Optional setting. Description of data collection and analysis rules. |
Mapping |
Settings of the mapping the fields of an SQL query result to KUMA events: Source field is the field from the SQL query result that you want to convert into a KUMA event. Event field is the KUMA event field. You can select one of the values in the list by placing the mouse cursor in this field. Label is a unique custom label for event fields that begin with DeviceCustom*. You can add new table rows or delete table rows. To add a new table row, click Add mapping. To delete a row, select the check box next to the row and click the If you do not want to fill in the fields manually, you can click the Add mapping from SQL button. The field mapping table is populated with the values of the SQL query fields, including aliases (if any). For example, if the value of an SQL query field is Clicking the Add mapping from SQL button again does not refresh the table, and fields from the SQL query are added to it again. |
 button.
You can create a data collection and analysis rule in one of the following ways:
- In the Resources → Resources and services → Data collection and analysis rules section.
- In the Events section.
To create a data collection and analysis rule in the Events section:
- Create or generate an SQL query and click the
 button.
A new browser tab for creating a data collection and analysis rule is opened in the browser with pre-filled SQL query and Depth fields. The field mapping table is also be populated automatically if you did not use an asterisk (*) in the SQL query.
- Fill in the required fields.
If necessary, you can change the value in the Query interval field.
- Save the settings.
The data collection and analysis rule is saved and is available in the Resources and services → Data collection and analysis rules section.
Page top
Configuring the scheduler for a data collection and analysis rule
For a data collection and analysis rule to run, you must create a scheduler for it.
The scheduler makes SQL queries to specified storage partitions with the interval and search depth configured in the rule, and then converts the SQL query results into base events, which it then sends to the correlator.
SQL query results converted to base events are not stored in the storage.
For the scheduler to work correctly, you must configure the link between the data collection and analysis rule, the storage, and the correlators in the Resources → Data collection and analysis section.
To manage this section, you need one of the following roles: General administrator, Tenant administrator, Tier 2 analyst, Access to shared resources, Manage shared resources.
The schedulers are arranged in the table by the date of their last launch. You can sort the data in columns in ascending or descending order by clicking the ![]() icon in the column heading.
icon in the column heading.
Available columns of the table of schedulers:
- Rule name is the name of the data collection and analysis rule for which you created the scheduler.
- Tenant name is the name of the tenant to which the data collection and analysis rule belongs.
- Status is the status of the scheduler. The following values are possible:
- Enabled means the scheduler is running, and the data collection and analysis rule will be started in accordance with the specified schedule.
- Disabled means the scheduler is not running.
This is the default status of a newly created scheduler. For the scheduler to run, it must be Enabled.
- The scheduler finished at is the last time the scheduler's data collection and analysis rule was started.
- Rule run status is the status with which the scheduler has finished. The following values are possible:
- Ok means the scheduler finished without errors, the rule was started.
- Unknown means the scheduler was Enabled and its status is currently unknown. The Unknown status is displayed if you have linked storages and correlators on the corresponding tabs and Enabled the scheduler, but have not yet started it.
- Stopped means the scheduler is stopped, the rule is not running.
- Error means the scheduler has finished, and the rule was completed with an error.
- Last error lists errors (if any) that occurred during the execution of the data collection and analysis rule.
Failure to send events to the configured correlator does not constitute an error.
You can use the toolbar in the upper part of the table to perform actions on schedulers.
To edit the scheduler, click the corresponding line in the table.
Available scheduler settings for data collection and analysis rules are described below.
General tab
On this tab you can:
- Enable or disable the scheduler using a toggle switch.
If the toggle switch is enabled, the data collection and analysis rule runs in accordance with the schedule configured in its settings.
- Edit the following settings of the data collection and analysis rule:
- Name
- Query interval
- Depth
- Sql
- Description
- Mapping
The Linked storages tab
On this tab you need to specify the storage to which the scheduler will send SQL queries.
To specify a storage:
- Click the Link button in the toolbar.
- This opens a window; in that window, specify the name of the storage to which you want to add the link, as well as the name of the section of the selected storage.
You can select only one storage, but multiple sections of that storage.
- Click Add.
The link is created and displayed in the table on the Linked storages tab.
If necessary, you can remove the links by selecting the check boxes in the relevant rows of the table and clicking the Unlink selected button.
The Linked correlators tab
On this tab, you must add correlators for handling base events.
To add a correlator:
- Click the Link button in the toolbar.
- This opens a window; in that window, hover over the Correlator field.
- In the displayed list of correlators, select check boxes next to the correlators you want to add.
- Click Add.
The correlators are added and displayed in the table on the Linked correlators tab.
If necessary, you can remove the correlators by selecting the check boxes in the relevant rows of the table and clicking the Unlink selected button.
You can also view the result of the scheduler in the Core log; to do so, you must first configure the Debug mode in Core settings. To download the log, select the Resources → Active services in KUMA, then select the Core service and click the Log button.
Log records with scheduler results have the datamining scheduler prefix.
Correlation rules
Correlation rules are used to recognize specific sequences of processed events and to take certain actions after recognition, such as creating correlation events/alerts or interacting with an active list.
Correlation rules can be used in the following KUMA services and features:
- Correlator.
- Notification rule.
- Links of segmentation rules.
- Retroscan.
The available correlation rule settings depend on the selected type. Types of correlation rules:
- standard—used to find correlations between several events. Resources of this kind can create correlation events.
This rule kind is used to determine complex correlation patterns. For simpler patterns you should use other correlation rule kinds that require less resources to operate.
- simple—used to create correlation events if a certain event is found.
- operational—used for operations with Active lists and context tables. This rule kind cannot create correlation events.
For these resources, you can enable the display of control characters in all input fields except the Description field.
If a correlation rule is used in the correlator and an alert was created based on it, any change to the correlation rule will not result in a change to the existing alert even if the correlator service is restarted. For example, if the name of a correlation rule is changed, the name of the alert will remain the same. If you close the existing alert, a new alert will be created and it will take into account the changes made to the correlation rule.
Correlation rules of the 'standard' type
Correlation rules of the standard type are used for identifying complex patterns in processed events.
The search for patterns is conducted by using buckets
Settings for a correlation rule of the standard type are described in the following tables.
General tab
This tab lets you specify the general settings of the correlation rule.
Setting |
Description |
|---|---|
Name |
Unique name of the resource. The maximum length of the name is 128 Unicode characters. Required setting. |
Tenant |
The name of the tenant that owns the resource. Required setting. |
Type |
Correlation rule type: standard. Required setting. |
Tags |
Tags for resource search. Optional setting. |
Identical fields |
Event fields that must be grouped in a Bucket. The hash of the values of the selected event fields is used as the Bucket key. If one of the selectors specified on the Selectors tab is triggered, the selected event fields are copied to the correlation event. If different selectors of the correlation rule use event fields that have different meanings in the events, do not specify such event fields in the Identical fields drop-down list. You can specify local variables. To refer to a local variable, its name must be preceded with the Required setting. |
Window, sec |
Bucket lifetime in seconds. The time starts counting when the bucket is created, when the bucket receives the first event. When the bucket lifetime expires, the trigger specified on the Actions → On timeout tab is triggered, and the container is deleted. Triggers specified on the Actions → On every threshold and On subsequent thresholds tabs can trigger more than once during the lifetime of the bucket. Required setting. |
Unique fields |
Unique event fields to be sent to the bucket. If you specify unique event fields, only these event fields will be sent to the container. The hash of values of the selected fields is used as the Bucket key. You can specify local variables. To refer to a local variable, its name must be preceded with the |
Rate limit |
Maximum number of times a correlation rule can be triggered per second. The default value is If correlation rules employing complex logic for pattern detection are not triggered, this may be due to the way rule triggers are counted in KUMA. In this case, we recommend increasing the Rate limit , for example, to |
Base events keep policy |
This drop-down list lets you select base events that you want to put in the correlation event:
|
Severity |
Base coefficient used to determine the importance of a correlation rule:
|
Order by |
Event field to be used by selectors of the correlation rule to track the evolution of the situation. This can be useful, for example, if you want to configure a correlation rule to be triggered when several types of events occur in a sequence. |
Description |
Description of the resource. The maximum length of the description is 4000 Unicode characters. |
MITRE techniques |
Downloaded MITRE ATT&CK techniques for analyzing the security coverage status using the MITRE ATT&CK matrix. |
Use unique field mapping |
This toggle switch allows you to save the values of unique fields to an array and pass it to a correlation event field. If the toggle switch is enabled, in the lower part of the General tab, an additional Unique field mapping group of settings is displayed, in which you can configure the mapping of the source original unique fields to correlation event fields. When processing an event using a correlation rule, field mapping takes place first, and then operations from the Actions tab are applied to the correlation event resulting from the initial mapping. The toggle switch is turned off by default. Optional setting. |
Unique field mapping group of settings
If you need to pass values of fields listed under Unique fields to the correlation event, here you can configure the mapping of unique fields to correlation event fields. This group of settings is displayed on the General tab if the Use unique field mapping toggle switch is enabled. Values of unique fields are an array, therefore the field in the correlation event must have the appropriate type: SA, NA, FA.
You can add a mapping by clicking the Add button and selecting a field from the drop-down list in the Raw event field column. You can select fields specified in the Unique fields parameter. In the drop-down list in the Target event field column, select the correlation event field to which you want to write the array of values of the source field. You can select fields whose type matches the type of the array (SA, NA, or FA, depending on the type of the source field).
You can delete one or more mappings by selecting the check boxes next to the relevant mappings and clicking Delete.
Selectors tab
This tab is used to define the conditions that the processed events must fulfill to trigger the correlation rule. To add a selector, click the + Add selector button. You can add multiple selectors, reorder selectors, or remove selectors. To reorder selectors, use the reorder icons. To remove a selector, click the delete icon next to it.
Each selector has a Settings tab and a Local variables tab.
The settings available on the Settings tab are described in the table below.
Setting |
Description |
|---|---|
Name |
Unique name of the resource. The maximum length of the name is 128 Unicode characters. Required setting. |
Selector threshold (event count) |
The number of events that must be received for the selector to trigger. The default value is Required setting. |
Recovery |
This toggle switch lets the correlation rule not trigger when the selector receives the number of events specified in the Selector threshold (event count) field. This toggle switch is turned off by default. |
Filter |
The filter that defines criteria for identifying events that trigger the selector when received. You can select an existing filter or create a new filter. To create a new filter, select Create new. If you want to edit the settings of an existing filter, click the pencil To create a filter:
Filtering based on data from the Extra event field The order of conditions specified in the selector filter of the correlation rule is significant and affects system performance. We recommend putting the most unique condition in the first place in the selector filter. Consider two examples of selector filters that select successful authentication events in Microsoft Windows. Selector filter 1: Condition 1: Condition 2: Selector filter 2: Condition 1: Condition 2: The order of conditions specified in selector filter 2 is preferable because it places less load on the system. |
On the Local variables tab, you can add variables that will be valid inside the correlation rule. To add a variable, click the + Add button, then specify the variable and its value. You can add multiple variables or delete variables. To delete a variable, select the check box next to it and click the Delete button.
In the selector of the correlation rule, you can use regular expressions conforming to the RE2 standard. Using regular expressions in correlation rules is computationally intensive compared to other operations. When designing correlation rules, we recommend limiting the use of regular expressions to the necessary minimum and using other available operations.
To use a regular expression, you must use the match operator. The regular expression must be placed in a constant. The use of capture groups in regular expressions is optional. For the correlation rule to trigger, the field text matched against the regexp must exactly match the regular expression.
For a primer on the syntax and examples of correlation rules that use regular expressions in their selectors, see the following rules that are provided with KUMA:
- R105_04_Suspicious PowerShell commands. Suspected obfuscation.
- R333_Suspicious creation of files in the autorun folder.
Actions tab
You can use this tab to configure the triggers of the correlation rule. You can configure triggers on the following tabs:
- On first threshold triggers when the Bucket registers the first triggering of the selector during the lifetime of the Bucket.
- On subsequent thresholds triggers when the Bucket registers the second and all subsequent triggering of the selector during the lifetime of the Bucket.
- On every threshold triggers every time the Bucket registers the triggering of the selector.
- On timeout triggers when the lifetime of the Bucket ends, and is used together with a selector that has the Recovery check box selected in its settings. Thus, this trigger activates if the situation detected by the correlation rule is not resolved within the specified lifetime.
Available trigger settings are listed in the table below.
Setting |
Description |
||||||
|---|---|---|---|---|---|---|---|
Output |
This check box enables the sending of correlation events for post-processing, that is, for external enrichment outside the correlation rule, for response, and to destinations. By default, this check box is cleared. |
||||||
Loop to correlator |
This check box enables the processing of the created correlation event by the rule chain of the current correlator. This makes hierarchical correlation possible. By default, this check box is cleared. If the Output and Loop to correlator check boxes are selected, the correlation rule is sent to post-processing first, and then to the selectors of the current correlation rule. |
||||||
No alert |
The check box disables the creation of alerts when the correlation rule is triggered. By default, this check box is cleared. If you do not want to create an alert when a correlation rule is triggered, but you still want to send a correlation event to the storage, select the Output and No alert check boxes. If you select only the No alert check box, a correlation event is not saved in the storage. |
||||||
Enrichment |
Enrichment rules for modifying the values of correlation event fields. Enrichment rules are stored in the correlation rule where they were created. To create an enrichment rule, click the + Add enrichment button. Available enrichment rule settings:
You can create multiple enrichment rules, reorder enrichment rules, or delete enrichment rules. To reorder enrichment rules, use the reorder |
||||||
Categorization |
Categorization rules for assets involved in the event. Using categorization rules, you can link and unlink only reactive categories to and from assets. To create an enrichment rule, click the + Add categorization button. Available categorization rule settings:
You can create multiple categorization rules, reorder categorization rules, or delete categorization rules. To reorder categorization rules, use the reorder |
||||||
Active lists update |
Operations with active lists. To create an operation with an active list, click the + Add active list action button. Available parameters of an active list operation:
You can create multiple operations with active lists, reorder operations with active lists, or delete operations with active lists. To reorder operations with active lists, use the reorder |
||||||
Updating context tables |
Operations with context tables. To create an operation with a context table, click the + Add context table action button. Available parameters of a context table operation:
You can create multiple operations with context tables, reorder operations with context tables, or delete operations with context tables. To reorder operations with context tables, use the reorder |
Correlators tab
This tab is displayed only when you edit the settings of the created correlation rule; on this tab, you can link correlators to the correlation rule.
To add correlators, click the + Add button, specify one or more correlators in the displayed window, and click OK. The correlation rule is linked to the specified correlators and added to the end of the execution queue in the correlator settings. If you want to change the position of a correlation rule in the execution queue, go to the Resources → Correlator section, click the correlator, and in the displayed window, go to the Correlation section, select the check box next to the correlation rule, and change the position of the correlation rule by clicking the Move up and Move down buttons.
You can add multiple correlators or delete correlators. To delete a correlator, select the check box next to it and click Delete.
Page top
Correlation rules of the 'simple' type
Correlation rules of the simple type are used to define simple sequences of events. Settings for a correlation rule of the simple type are described in the following tables.
General tab
This tab lets you specify the general settings of the correlation rule.
Setting |
Description |
|---|---|
Name |
Unique name of the resource. The maximum length of the name is 128 Unicode characters. Required setting. |
Tenant |
The name of the tenant that owns the resource. Required setting. |
Type |
Correlation rule type: simple. Required setting. |
Tags |
Tags for resource search. Optional setting. |
Propagated fields |
Event fields by which events are selected. If a selector specified on the Selectors tab is triggered, the selected event fields are copied to the correlation event. |
Rate limit |
Maximum number of times a correlation rule can be triggered per second. The default value is If correlation rules employing complex logic for pattern detection are not triggered, this may be due to the way rule triggers are counted in KUMA. In this case, we recommend increasing the Rate limit , for example, to |
Severity |
Base coefficient used to determine the importance of a correlation rule:
|
Description |
Description of the resource. The maximum length of the description is 4000 Unicode characters. |
MITRE techniques |
Downloaded MITRE ATT&CK techniques for analyzing the security coverage status using the MITRE ATT&CK matrix. |
Selectors tab
This tab is used to define the conditions that the processed events must fulfill to trigger the correlation rule. A selector has a Settings tab and a Local variables tab.
The settings available on the Settings tab are described in the table below.
Setting |
Description |
|---|---|
Filter |
The filter that defines criteria for identifying events that trigger the selector when received. You can select an existing filter or create a new filter. To create a new filter, select Create new. If you want to edit the settings of an existing filter, click the pencil To create a filter:
Filtering based on data from the Extra event field The order of conditions specified in the selector filter of the correlation rule is significant and affects system performance. We recommend putting the most unique condition in the first place in the selector filter. Consider two examples of selector filters that select successful authentication events in Microsoft Windows. Selector filter 1: Condition 1: Condition 2: Selector filter 2: Condition 1: Condition 2: The order of conditions specified in selector filter 2 is preferable because it places less load on the system. |
On the Local variables tab, you can add variables that will be valid inside the correlation rule. To add a variable, click the + Add button, then specify the variable and its value. You can add multiple variables or delete variables. To delete a variable, select the check box next to it and click the Delete button.
Actions tab
You can use this tab to configure the trigger of the correlation rule. A correlation rule of the simple type can have only one trigger, which is activated each time the bucket registers the selector triggering. Available trigger settings are listed in the table below.
Setting |
Description |
||||||
|---|---|---|---|---|---|---|---|
Output |
This check box enables the sending of correlation events for post-processing, that is, for external enrichment outside the correlation rule, for response, and to destinations. By default, this check box is cleared. |
||||||
Loop to correlator |
This check box enables the processing of the created correlation event by the rule chain of the current correlator. This makes hierarchical correlation possible. By default, this check box is cleared. If the Output and Loop to correlator check boxes are selected, the correlation rule is sent to post-processing first, and then to the selectors of the current correlation rule. |
||||||
No alert |
The check box disables the creation of alerts when the correlation rule is triggered. By default, this check box is cleared. If you do not want to create an alert when a correlation rule is triggered, but you still want to send a correlation event to the storage, select the Output and No alert check boxes. If you select only the No alert check box, a correlation event is not saved in the storage. |
||||||
Enrichment |
Enrichment rules for modifying the values of correlation event fields. Enrichment rules are stored in the correlation rule where they were created. To create an enrichment rule, click the + Add enrichment button. Available enrichment rule settings:
You can create multiple enrichment rules, reorder enrichment rules, or delete enrichment rules. To reorder enrichment rules, use the reorder |
||||||
Categorization |
Categorization rules for assets involved in the event. Using categorization rules, you can link and unlink only reactive categories to and from assets. To create an enrichment rule, click the + Add categorization button. Available categorization rule settings:
You can create multiple categorization rules, reorder categorization rules, or delete categorization rules. To reorder categorization rules, use the reorder |
||||||
Active lists update |
Operations with active lists. To create an operation with an active list, click the + Add active list action button. Available parameters of an active list operation:
You can create multiple operations with active lists, reorder operations with active lists, or delete operations with active lists. To reorder operations with active lists, use the reorder |
||||||
Updating context tables |
Operations with context tables. To create an operation with a context table, click the + Add context table action button. Available parameters of a context table operation:
You can create multiple operations with context tables, reorder operations with context tables, or delete operations with context tables. To reorder operations with context tables, use the reorder |
Correlators tab
This tab is displayed only when you edit the settings of the created correlation rule; on this tab, you can link correlators to the correlation rule.
To add correlators, click the + Add button, specify one or more correlators in the displayed window, and click OK. The correlation rule is linked to the specified correlators and added to the end of the execution queue in the correlator settings. If you want to change the position of a correlation rule in the execution queue, go to the Resources → Correlator section, click the correlator, and in the displayed window, go to the Correlation section, select the check box next to the correlation rule, and change the position of the correlation rule by clicking the Move up and Move down buttons.
You can add multiple correlators or delete correlators. To delete a correlator, select the check box next to it and click Delete.
Page top
Correlation rules of the 'operational' type
Correlation rules of the operational type are used for working with active lists. Settings for a correlation rule of the operational type are described in the following tables.
General tab
This tab lets you specify the general settings of the correlation rule.
Setting |
Description |
|---|---|
Name |
Unique name of the resource. The maximum length of the name is 128 Unicode characters. Required setting. |
Tenant |
The name of the tenant that owns the resource. Required setting. |
Type |
Correlation rule type: operational. Required setting. |
Tags |
Tags for resource search. Optional setting. |
Rate limit |
Maximum number of times a correlation rule can be triggered per second. The default value is If correlation rules employing complex logic for pattern detection are not triggered, this may be due to the way rule triggers are counted in KUMA. In this case, we recommend increasing the Rate limit , for example, to |
Description |
Description of the resource. The maximum length of the description is 4000 Unicode characters. |
MITRE techniques |
Downloaded MITRE ATT&CK techniques for analyzing the security coverage status using the MITRE ATT&CK matrix. |
Selectors tab
This tab is used to define the conditions that the processed events must fulfill to trigger the correlation rule. A selector has a Settings tab and a Local variables tab.
The settings available on the Settings tab are described in the table below.
Setting |
Description |
|---|---|
Filter |
The filter that defines criteria for identifying events that trigger the selector when received. You can select an existing filter or create a new filter. To create a new filter, select Create new. If you want to edit the settings of an existing filter, click the pencil To create a filter:
Filtering based on data from the Extra event field The order of conditions specified in the selector filter of the correlation rule is significant and affects system performance. We recommend putting the most unique condition in the first place in the selector filter. Consider two examples of selector filters that select successful authentication events in Microsoft Windows. Selector filter 1: Condition 1: Condition 2: Selector filter 2: Condition 1: Condition 2: The order of conditions specified in selector filter 2 is preferable because it places less load on the system. |
On the Local variables tab, you can add variables that will be valid inside the correlation rule. To add a variable, click the + Add button, then specify the variable and its value. You can add multiple variables or delete variables. To delete a variable, select the check box next to it and click the Delete button.
Actions tab
You can use this tab to configure the trigger of the correlation rule. A correlation rule of the operational type can have only one trigger, which is activated each time the bucket registers the selector triggering. Available trigger settings are listed in the table below.
Setting |
Description |
|---|---|
Active lists update |
Operations with active lists. To create an operation with an active list, click the + Add active list action button. Available parameters of an active list operation:
You can create multiple operations with active lists, reorder operations with active lists, or delete operations with active lists. To reorder operations with active lists, use the reorder |
Updating context tables |
Operations with context tables. To create an operation with a context table, click the + Add context table action button. Available parameters of a context table operation:
You can create multiple operations with context tables, reorder operations with context tables, or delete operations with context tables. To reorder operations with context tables, use the reorder |
Correlators tab
This tab is displayed only when you edit the settings of the created correlation rule; on this tab, you can link correlators to the correlation rule.
To add correlators, click the + Add button, specify one or more correlators in the displayed window, and click OK. The correlation rule is linked to the specified correlators and added to the end of the execution queue in the correlator settings. If you want to change the position of a correlation rule in the execution queue, go to the Resources → Correlator section, click the correlator, and in the displayed window, go to the Correlation section, select the check box next to the correlation rule, and change the position of the correlation rule by clicking the Move up and Move down buttons.
You can add multiple correlators or delete correlators. To delete a correlator, select the check box next to it and click Delete.
Page top
Variables in correlators
If tracking values in event fields, active lists, or dictionaries is not enough to cover some specific security scenarios, you can use global and local variables. You can use them to take various actions on the values received by the correlators by implementing complex logic for threat detection. Variables can be declared in the correlator (global variables) or in the correlation rule (local variables) by assigning a function to them, then querying them from correlation rules as if they were ordinary event fields and receiving the triggered function result in response.
Usage scope of variables:
- When searching for identical or unique field values in correlation rules.
- In the correlation rule selectors, in the filters of the conditions under which the correlation rule must be triggered.
- When enriching correlation events. Select Event as the source type.
- When populating active lists with values.
Variables can be queried the same way as event fields by preceding their names with the $ character.
You can use extended event schema fields in correlation rules, local variables, and global variables.
Local variables in identical and unique fields
You can use local variables in the Identical fields and Unique fields sections of 'standard' type correlation rules. To use a local variable, its name must be preceded with the "$" character.
For an example of using local variables in the Identical fields and Unique fields sections, refer to the rule provided with KUMA: R403_Access to malicious resources from a host with disabled protection or an out-of-date anti-virus database.
Page top
Local variables in selector
To use a local variable in a selector:
- Add a local variable to the rule.
- In the Correlation rules window, go to the General tab and add the created local variable to the Identical fields section. Prefix the local variable name with a "$" character.
- In Correlation rules window, go to the Selectors tab, select an existing filter or create a new filter and click Add condition.
- Select the event field as the operand.
- Select the local variable as the event field value and prefix the variable name with a "$" character.
- Specify the remaining filter settings.
- Click Save.
For an example of using local variables, refer to the rule provided with KUMA: R403_Access to malicious resources from a host with disabled protection or an out-of-date anti-virus database.
Page top
Local Variables in event enrichment
You can use 'standard' and 'simple' correlation rules to enrich events with local variables.
Enrichment with text and numbers
You can enrich events with text (strings). To do so, you can use functions that modify strings: to_lower, to_upper, str_join, append, prepend, substring, tr, replace, str_join.
You can enrich events with numbers. To do so, you can use the following functions: addition ("+"), subtraction ("-"), multiplication ("*"), division ("/"), round, ceil, floor, abs, pow.
You can also use regular expressions to manage data in local variables.
Using regular expressions in correlation rules is computationally intensive compared to other operations. Therefore, when designing correlation rules, we recommend limiting the use of regular expressions to the necessary minimum and using other available operations.
Timestamp enrichment
You can enrich events with timestamps (date and time). To do so, you can use functions that let you get or modify timestamps: now, extract_from_timestamp, parse_timestamp, format_timestamp, truncate_timestamp, time_diff.
Operations with active lists and tables
You can enrich events with local variables and data from active lists and tables.
To enrich events with data from an active list, use the active_list, active_list_dyn functions.
To enrich events with data from a table, use the table_dict, dict functions.
You can create conditional statements by using the 'conditional' function in local variables. In this way, the variable can return one of the values depending on what data was received for processing.
Enriching events with a local variable
To use a local variable to enrich events:
- Add a local variable to the rule.
- In the Correlation rules window, go to the General tab and add the created local variable to the Identical fields section. Prefix the local variable name with a "$" character.
- In the Correlation rules window, go to the Actions tab, and under Enrichment, in the Source kind drop-down list, select Event.
- From the Target field drop-down list, select the KUMA event field to which you want to pass the value of the local variable.
- From the Source field drop-down list, select a local variable. Prefix the local variable name with a "$" character.
- Specify the remaining rule settings.
- Click Save.
Local variables in active list enrichment
You can use local variables to enrich active lists.
To enrich the active list with a local variable:
- Add a local variable to the rule.
- In the Correlation rules window, go to the General tab and add the created local variable to the Identical fields section. Prefix the local variable name with a "$" character.
- In the Correlation rules window, go to the Actions tab and under Active lists update, add the local variable to the Key fields field. Prefix the local variable name with a "$" character.
- Under Mapping, specify the correspondence between the event fields and the active list fields.
- Click the Save button.
Properties of variables
Local and global variables
The properties of global variables differ from the properties of local variables.
Global variables:
- Global variables are declared at the correlator level and are applied only within the scope of this correlator.
- The global variables of the correlator can be queried from all correlation rules that are specified in it.
- In standard correlation rules, the same global variable can take different values in each selector.
- It is not possible to transfer global variables between different correlators.
Local variables:
- Local variables are declared at the correlation rule level and are applied only within the limits of this rule.
- In standard correlation rules, the scope of a local variable consists of only the selector in which the variable was declared.
- Local variables can be declared in any type of correlation rule.
- Local variables cannot be transferred between rules or selectors.
- A local variable cannot be used as a global variable.
Variables used in various types of correlation rules
- In operational correlation rules, on the Actions tab, you can specify all variables available or declared in this rule.
- In standard correlation rules, on the Actions tab, you can provide only those variables specified in these rules on the General tab, in the Identical fields field.
- In simple correlation rules, on the Actions tab, you can provide only those variables specified in these rules on the General tab, in the Inherited Fields field.
Requirements for variables
When adding a variable function, you must first specify the name of the function, and then list its parameters in parentheses. Basic mathematical operations (addition, subtraction, multiplication, division) are an exception to this requirement. When these operations are used, parentheses are used to designate the severity of the operations.
Requirements for function names:
- Must be unique within the correlator.
- Must contain 1 to 128 Unicode characters.
- Must not begin with the character $.
- Must be written in camelCase or CamelCase.
Special considerations when specifying functions of variables:
- The sequence of parameters is important.
- Parameters are separated by a comma:
,. - String parameters are passed in single quotes:
'. - Event field names and variables are specified without quotation marks.
- When querying a variable as a parameter, add the
$character before its name. - You do not need to add a space between parameters.
- In all functions in which a variable can be used as parameters, nested functions can be created.
Functions of variables
Operations with active lists and dictionaries
"active_list" and "active_list_dyn" functions
These functions allow you to receive information from an active list and dynamically generate a field name for an active list and key.
You must specify the parameters in the following sequence:
- Name of the active list.
- Expression that returns the field name of the active list.
- One or more expressions whose results are used to generate the key.
Usage example
Result
active_list('Test', to_lower('DeviceHostName'), to_lower(DeviceCustomString2), to_lower(DeviceCustomString1))Gets the field value of the active list.
Use these functions to query the active list of the shared tenant from a variable. To do so, add the @Shared suffix after the name of the active list (case sensitive). For example, active_list('exampleActiveList@Shared', 'score', SourceAddress, SourceUserName).
"table_dict" function
Gets information about the value in the specified column of a dictionary of the table type.
You must specify the parameters in the following sequence:
- Dictionary name
- Dictionary column name
- One or more expressions whose results are used to generate the dictionary row key.
Usage example
Result
table_dict('exampleTableDict', 'office', SourceUserName)Gets data from the
exampleTableDictdictionary from the row with theSourceUserNamekey in theofficecolumn.table_dict('exampleTableDict', 'office', SourceAddress, to_lower(SourceUserName))Gets data from the
exampleTableDictdictionary from a composite key string from theSourceAddressfield value and the lowercase value of theSourceUserNamefield from theofficecolumn.
Use this function to access the dictionary of the shared tenant from a variable. To do so, add the @Shared suffix after the name of the active list (case sensitive). For example, table_dict('exampleTableDict@Shared', 'office', SourceUserName).
"dict" function
Gets information about the value in the specified column of a dictionary of the dictionary type.
You must specify the parameters in the following sequence:
- Dictionary name
- One or more expressions whose results are used to generate the dictionary row key.
Usage example
Result
dict('exampleDictionary', SourceAddress)Gets data from
exampleDictionaryfrom the row with theSourceAddresskey.dict('exampleDictionary', SourceAddress, to_lower(SourceUserName))Gets data from the
exampleDictionaryfrom a composite key string from theSourceAddressfield value and the lowercase value of theSourceUserNamefield.
Use this function to access the dictionary of the shared tenant from a variable. To do so, add the @Shared suffix after the name of the active list (case sensitive). For example, dict('exampleDictionary@Shared', SourceAddress).
Operations with context tables
"context_table" function
Returns the value of the specified field in the base type (for example, integer, array of integers).
You must specify the parameters in the following sequence:
- Name of the context table. The name must be specified.
- Expression that returns the field name of context table.
- Expression that returns the name of key field 1 of the context table.
- Expression that returns the value of key field 1 of the context table.
The function must contain at least 4 parameters.
Usage example |
Result |
|
|
"len" function
Returns the length of a string or array.
The function returns the length of the array if the passed array is of one of the following types:
- array of integers
- array of floats
- array of strings
- array of booleans
If an array of a different type is passed, the data of the array is cast to the string type, and the function returns the length of the resulting string.
Usage examples |
|
|
"distinct_items" function
Returns a list of unique elements in an array.
The function returns the list of unique elements of the array if the passed array is of one of the following types:
- array of integers
- array of floats
- array of strings
- array of booleans
If an array of a different type is passed, the data of the array is cast to the string type, and the function returns a string consisting of the unique characters from the original string.
Usage examples |
|
|
"sort_items" function
Returns a sorted list of array elements.
You must specify the parameters in the following sequence:
- Expression that returns the object of the sorting.
- Sorting order Possible values:
asc,desc. If the parameter is not specified, the default value isasc.
The function returns the list of sorted elements of the array if the passed array is of one of the following types:
- array of integers
- array of floats
- array of strings
For a boolean array, the function returns the list of array elements in the original order.
If an array of a different type is passed, the data of the array is cast to the string type, and the function returns a string of sorted characters.
Usage examples |
|
|
"item" function
Returns the array element with the specified index or the character of a string with the specified index if an array of integers, floats, strings, or boolean values is passed.
You must specify the parameters in the following sequence:
- Expression that returns the object of the indexing.
- Expression that returns the index of the element or character.
The function must contain at least 2 parameters.
The function returns the array element with the specified index or the string character with the specified index if the index falls within the range of the array and the passed array is of one of the following types:
- array of integers
- array of floats
- array of strings
- array of booleans
If an array of a different type is passed and the index falls within the range of the array, the data is cast to the string type, and the function returns the string character with the specified index. If an array of a different type is passed and the index is outside the range of the array, the function returns an empty string.
Usage examples |
|
|
Operations with strings
"to_lower" function
Converts characters in a string to lowercase. Supported for standard fields and extended event schema fields of the "string" type.
A string can be passed as a string, field name or variable.
Usage examples |
|
|
|
"to_upper" function
Converts characters in a string to uppercase. Supported for standard fields and extended event schema fields of the "string" type. A string can be passed as a string, field name or variable.
Usage examples |
|
|
|
"append" function
Adds characters to the end of a string. Supported for standard fields and extended event schema fields of the "string" type.
You must specify the parameters in the following sequence:
- Original string.
- Added string.
Strings can be passed as a string, field name or variable.
Usage examples |
Usage result |
|
The string |
|
The string |
|
A string from |
"prepend" function
Adds characters to the beginning of a string. Supported for standard fields and extended event schema fields of the "string" type.
You must specify the parameters in the following sequence:
- Original string.
- Added string.
Strings can be passed as a string, field name or variable.
Usage examples |
Usage result |
|
The string |
|
The string |
|
A string from |
"substring" function
Returns a substring from a string. Supported for standard fields and extended event schema fields of the "string" type.
You must specify the parameters in the following sequence:
- Original string.
- Substring start position (natural number or 0).
- (Optional) substring end position.
Strings can be passed as a string, field name or variable. If the position number is greater than the original data string length, an empty string is returned.
Usage examples |
Usage result |
|
Returns a part of the string from the |
|
Returns a part of the string from the |
|
Returns the entire string from the |
"index_of" function
The "index_of" function returns the position of the first occurrence of a character or substring in a string; the first character in the string has index 0. If the function does not find the substring, the function returns -922337203685477580.
The function accepts the following parameters:
- As source data, an event field, another variable, or constant.
- Any expression out of those that are available in local variables.
To use this function, you must specify the parameters in the following order:
- Character or substring whose position you want to find.
- String to be searched.
Usage examples |
Usage result |
|
The function looks for the "@" character in the SourceUserName field. The SourceUserName field contains the "user@example.com" string. Result = 4 The function returns the index of the first occurrence of the character in the string. The first character in the string has index 0. |
|
The function looks for the "m" character in the Result = 8 The function returns the index of the first occurrence of the character in the string. The first character in the string has index 0. |
"last_index_of" function
The "last_index_of" function returns the position of the last occurrence of a character or substring in a string; the first character in the string has index 0. If the function does not find the substring, the function returns -922337203685477580.
The function accepts the following parameters:
- As source data, an event field, another variable, or constant.
- Any expression out of those that are available in local variables.
To use this function, you must specify the parameters in the following order:
- Character or substring whose position you want to find.
- String to be searched.
Usage examples |
Usage result |
|
The function looks for the "m" character in the SourceUserName field. The SourceUserName field contains the "user@example.com" string. Result = 15 The function returns the index of the last occurrence of the character in the string. The first character in the string has index 0. |
"tr" function
Removes the specified characters from the beginning and end of a string. Supported for standard fields and extended event schema fields of the "string" type.
You must specify the parameters in the following sequence:
- Original string.
- (Optional) string that should be removed from the beginning and end of the original string.
Strings can be passed as a string, field name or variable. If you do not specify a string to be deleted, spaces will be removed from the beginning and end of the original string.
Usage examples |
Usage result |
|
Spaces have been removed from the beginning and end of the string from the |
|
If the |
|
If the |
"replace" function
Replaces all occurrences of character sequence A in a string with character sequence B. Supported for standard fields and extended event schema fields of the "string" type.
You must specify the parameters in the following sequence:
- Original string.
- Search string: sequence of characters to be replaced.
- Replacement string: sequence of characters to replace the search string.
Strings can be passed as an expression.
Usage examples |
Usage result |
|
Returns a string from the |
|
Returns a string from |
"regexp_replace" function
Replaces a sequence of characters that match a regular expression with a sequence of characters and regular expression capturing groups. Supported for standard fields and extended event schema fields of the "string" type.
You must specify the parameters in the following sequence:
- Original string.
- Search string: regular expression.
- Replacement string: sequence of characters to replace the search string, and IDs of the regular expression capturing groups. A string can be passed as an expression.
Strings can be passed as a string, field name or variable. Unnamed capturing groups can be used.
In regular expressions used in variable functions, each backslash character must be additionally escaped. For example, ^example\\\\ must be used instead of the regular expression ^example\\.
Usage examples |
Usage result |
|
Returns a string from the |
"regexp_capture" function
Gets the result matching the regular expression condition from the original string. Supported for standard fields and extended event schema fields of the "string" type.
You must specify the parameters in the following sequence:
- Original string.
- Search string: regular expression.
Strings can be passed as a string, field name or variable. Unnamed capturing groups can be used.
In regular expressions used in variable functions, each backslash character must be additionally escaped. For example, ^example\\\\ must be used instead of the regular expression ^example\\.
Usage examples |
Example values |
Usage result |
|
|
|
"template" function
Returns the string specified in the function, with variables replaced with their values. Variables for substitution can be passed in the following ways:
- Inside the string.
- After the string. In this case, inside the string, you must specify variables in the
{{index.<n>}}notation, where <n> is the index of the variable passed after the string. The index is 0-based.Usage examples
template('Very long text with values of rule={{.DeviceCustomString1}} and {{.Name}} event fields, as well as values of {{index.0}} and {{index.1}} local variables and then {{index.2}}', $var1, $var2, $var10)
Operations with timestamps
now function
Gets a timestamp in epoch format. Runs with no arguments.
Usage examples |
|
"extract_from_timestamp" function
Gets atomic time representations (year, month, day, hour, minute, second, day of the week) from fields and variables with time in the epoch format.
The parameters must be specified in the following sequence:
- Event field of the timestamp type, or variable.
- Notation of the atomic time representation. This parameter is case sensitive.
Possible variants of atomic time notation:
- y refers to the year in number format.
- M refers to the month in number notation.
- d refers to the number of the month.
- wd refers to the day of the week: Monday, Tuesday, Wednesday, Thursday, Friday, Saturday, Sunday.
- h refers to the hour in 24-hour format.
- m refers to the minutes.
- s refers to the seconds.
- (optional) Time zone notation. If this parameter is not specified, the time is calculated in UTC format.
Usage examples
extract_from_timestamp(Timestamp, 'wd')extract_from_timestamp(Timestamp, 'h')extract_from_timestamp($otherVariable, 'h')extract_from_timestamp(Timestamp, 'h', 'Europe/Moscow')
"parse_timestamp" function
Converts the time from RFC3339 format (for example, "2022-05-24 00:00:00", "2022-05-24 00:00:00+0300) to epoch format.
Usage examples |
|
|
"format_timestamp" function
Converts the time from epoch format to RFC3339 format.
The parameters must be specified in the following sequence:
- Event field of the timestamp type, or variable.
- Time format notation: RFC3339.
- (optional) Time zone notation. If this parameter is not specified, the time is calculated in UTC format.
Usage examples
format_timestamp(Timestamp, 'RFC3339')format_timestamp($otherVariable, 'RFC3339')format_timestamp(Timestamp, 'RFC3339', 'Europe/Moscow')
"truncate_timestamp" function
Rounds the time in epoch format. After rounding, the time is returned in epoch format. Time is rounded down.
The parameters must be specified in the following sequence:
- Event field of the timestamp type, or variable.
- Rounding parameter:
- 1s rounds to the nearest second.
- 1m rounds to the nearest minute.
- 1h rounds to the nearest hour.
- 24h rounds to the nearest day.
- (optional) Time zone notation. If this parameter is not specified, the time is calculated in UTC format.
Usage examples
Examples of rounded values
Usage result
truncate_timestamp(Timestamp, '1m')1654631774175 (7 June 2022, 19:56:14.175)
1654631760000 (7 June 2022, 19:56:00)
truncate_timestamp($otherVariable, '1h')1654631774175 (7 June 2022, 19:56:14.175)
1654628400000 (7 June 2022, 19:00:00)
truncate_timestamp(Timestamp, '24h', 'Europe/Moscow')1654631774175 (7 June 2022, 19:56:14.175)
1654560000000 (7 June 2022, 0:00:00)
"time_diff" function
Gets the time interval between two timestamps in epoch format.
The parameters must be specified in the following sequence:
- Interval end time. Event field of the timestamp type, or variable.
- Interval start time. Event field of the timestamp type, or variable.
- Time interval notation:
- ms refers to milliseconds.
- s refers to seconds.
- m refers to minutes.
- h refers to hours.
- d refers to days.
Usage examples
time_diff(EndTime, StartTime, 's')time_diff($otherVariable, Timestamp, 'h')time_diff(Timestamp, DeviceReceiptTime, 'd')
Mathematical operations
These are comprised of basic mathematical operations and functions.
Basic mathematical operations
Supported for integer and float fields of the extended event schema.
Operations:
- Addition
- Subtraction
- Multiplication
- Division
- Modulo division
Parentheses determine the sequence of actions
Available arguments:
- Numeric event fields
- Numeric variables
- Real numbers
When modulo dividing, only natural numbers can be used as arguments.
Usage constraints:
- Division by zero returns zero.
- Mathematical operations on a number and a strings return the number unchanged. For example, 1 + abc returns 1.
- Integers resulting from operations are returned without a dot.
Usage examples
(Type=3; otherVariable=2; Message=text)Usage result
Type + 14
$otherVariable - Type-1
2 * 2.55
2 / 00
Type * Message0
(Type + 2) * 210
Type % $otherVariable1
"round" function
Rounds numbers. Supported for integer and float fields of the extended event schema.
Available arguments:
- Numeric event fields
- Numeric variables
- Numeric constants
Usage examples
(DeviceCustomFloatingPoint1=7.75; DeviceCustomFloatingPoint2=7.5 otherVariable=7.2)Usage result
round(DeviceCustomFloatingPoint1)8
round(DeviceCustomFloatingPoint2)8
round($otherVariable)7
"ceil" function
Rounds up numbers. Supported for integer and float fields of the extended event schema.
Available arguments:
- Numeric event fields
- Numeric variables
- Numeric constants
Usage examples
(DeviceCustomFloatingPoint1=7.15; otherVariable=8.2)Usage result
ceil(DeviceCustomFloatingPoint1)8
ceil($otherVariable)9
"floor" function
Rounds down numbers. Supported for integer and float fields of the extended event schema.
Available arguments:
- Numeric event fields
- Numeric variables
- Numeric constants
Usage examples
(DeviceCustomFloatingPoint1=7.15; otherVariable=8.2)Usage result
floor(DeviceCustomFloatingPoint1)7
floor($otherVariable)8
"abs" function
Gets the modulus of a number. Supported for integer and float fields of the extended event schema.
Available arguments:
- Numeric event fields
- Numeric variables
- Numeric constants
Usage examples
(DeviceCustomNumber1=-7; otherVariable=-2)Usage result
abs(DeviceCustomFloatingPoint1)7
abs($otherVariable)2
"pow" function
Exponentiates a number. Supported for integer and float fields of the extended event schema.
The parameters must be specified in the following sequence:
- Base — real numbers.
- Power — natural numbers.
Available arguments:
- Numeric event fields
- Numeric variables
- Numeric constants
Usage examples
pow(DeviceCustomNumber1, DeviceCustomNumber2)pow($otherVariable, DeviceCustomNumber1)
"str_join" function
Join multiple strings into one using a separator. Supported for integer and float fields of the extended event schema.
The parameters must be specified in the following sequence:
- Separator. String.
- String1, string2, stringN. At least 2 expressions.
Usage examples
Usage result
str_join('|', to_lower(Name), to_upper(Name), Name)String.
"conditional" function
Get one value if a condition is met and another value if the condition is not met. Supported for integer and float fields of the extended event schema.
The parameters must be specified in the following sequence:
- Condition. String. The syntax is similar to the conditions of the Where statement in SQL. You can use the functions of the KUMA variables and references to other variables in a condition.
- The value if the condition is met. Expression.
- The value if the condition is not met. Expression.
Supported operators:
- AND
- OR
- NOT
- =
- !=
- <
- <=
- >
- >=
- LIKE (RE2 regular expression is used, rather than an SQL expression)
- ILIKE (RE2 regular expression is used, rather than an SQL expression)
- BETWEEN
- IN
- IS NULL (check for an empty value, such as 0 or an empty string)
Usage examples (the value depends on arguments 2 and 3)
conditional('SourceUserName = \\'root\\' AND DestinationUserName = SourceUserName', 'match', 'no match')conditional(`DestinationUserName ILIKE 'svc_.*'`, 'match', 'no match')conditional(`DestinationUserName NOT LIKE 'svc_.*'`, 'match', 'no match')
Operations for extended event schema fields
For extended event schema fields of the "string" type, the following kinds of operations are supported:
- "len" function
- "to_lower" function
- "to_upper" function
- "append" function
- "prepend" function
- "substring" function
- "tr" function
- "replace" function
- "regexp_replace" function
- "regexp_capture" function
For extended event schema fields of the integer or float type, the following kinds of operations are supported:
- Basic mathematical operations:
- "round" function
- "ceil" function
- "floor" function
- "abs" function
- "pow" function
- "str_join" function
- "conditional" function
For extended event schema fields of the "array of integers", "array of floats", and "array of strings" types, KUMA supports the following functions:
- Get the i-th element of the array. Example: item(<type>.someStringArray).
- Get an array of values. Example: <type>.someStringArray. Returns ["string1", "string2", "string3"].
- Get the count of elements in an array. Example: len(<type>.someStringArray). Returns ["string1", "string2"].
- Gett unique elements from an array. Example: distinct_items(<type>.someStringArray).
- Generate a TSV string of array elements. Example: to_string(<type>.someStringArray).
- Sort the elements of the array. Example: sort_items(<type>.someStringArray).
In the examples, instead of <type>, you must specify the array type: NA for an array of integers, FA for an array of floats, SA for an array of strings.
For fields of the "array of integers" and "array of floats" types, the following functions are supported:
• math_min — returns the minimum element of an array. Example: math_min(NA.NumberArray), math_min(FA.FloatArray)
• math_max — returns the maximum element of an array Example: math_max(NA.NumberArray), math_max(FA.FloatArray)
• math_avg — returns the average value of an array. Example: math_avg(NA.NumberArray), math_avg(FA.FloatArray)
Page top
Declaring variables
To declare variables, they must be added to a correlator or correlation rule.
To add a global variable to an existing correlator:
- In the KUMA Console, under Resources → Correlators, select the resource set of the relevant correlator.
The Correlator Installation Wizard opens.
- Select the Global variables step of the Installation Wizard.
- click the Add variable button and specify the following parameters:
- In the Variable window, enter the name of the variable.
- In the Value window, enter the variable function.
When entering functions, you can use autocomplete as a list of hints with possible function names, their brief description and usage examples. You can select a function from the list and insert it together with its list of arguments into the input field.
To display the list of all hints in the field, press Ctrl+Space. Press Enter to select a function from the list. Press Tab to go to the next argument in the list of arguments of the selected function.
Multiple variables can be added. Added variables can be edited or deleted by using the
icon. - Select the Setup validation step of the Installation Wizard and click Save.
A global variable is added to the correlator. It can be queried like an event field by inserting the $ character in front of the variable name. The variable will be used for correlation after restarting the correlator service.
To add a local variable to an existing correlation rule:
- In the KUMA Console, under Resources → Correlation rules, select the relevant correlation rule.
The correlation rule settings window opens. The parameters of a correlation rule can also be opened from the correlator to which it was added by proceeding to the Correlation step of the Installation Wizard.
- Click the Selectors tab.
- In the selector, open the Local variables tab, click the Add variable button and specify the following parameters:
- In the Variable window, enter the name of the variable.
- In the Value window, enter the variable function.
When entering functions, you can use autocomplete as a list of hints with possible function names, their brief description and usage examples. You can select a function from the list and insert it together with its list of arguments into the input field.
To display the list of all hints in the field, press Ctrl+Space. Press Enter to select a function from the list. Press Tab to go to the next argument in the list of arguments of the selected function.
Multiple variables can be added. Added variables can be edited or deleted by using the
icon.For standard correlation rules, repeat this step for each selector in which you want to declare variables.
- Click Save.
The local variable is added to the correlation rule. It can be queried like an event field by inserting the $ character in front of the variable name. The variable will be used for correlation after restarting the correlator service.
Added variables can be edited or deleted. If the correlation rule queries an undeclared variable (for example, if its name has been changed), an empty string is returned.
If you change the name of a variable, you will need to manually change the name of this variable in all correlation rules where you have used it.
Page top
Adding a temporary exclusion list for a correlation rule
Users that do not have the rights to edit correlation rules in the KUMA Console, can create a temporary list of exclusions (for example, create exclusions for false positives when managing alerts). A user with the rights to edit correlation rules can then add the exclusions to the rule and remove them from the temporary list.
To add exclusions to a correlation rule when managing alerts:
- Go to the Alerts section and select an alert.
- Click the Find in events button.
Events of the alert are displayed on the events page.
- Open the correlation event.
This opens the event card in which each field has a
 (arrow) button that lets you add an exclusion.
 - Click the button and select Add to exclusions.
A sidebar is displayed, containing the following fields: Correlation rule, Exclusion, Alert, Comment.
- Click the Create button.
The exclusion rule is added.
The exclusion is added to the temporary list. This list is available to anyone with rights to read correlation rules: in the Resources → Correlation rules section, in the toolbar of the rule list, click the List of exclusions button. If you want to view the exclusions of a specific rule, open the card of the rule and select the Exclusions tab.
The exclusion list contains entries with the following parameters:
ExclusionExclusion condition.
Correlation ruleName of the correlation rule.
AlertName of the alert from which the exclusion was added.
TenantThe tenant to which the rule and the exclusion apply.
ConditionGenerated automatically based on the selected field of the correlation event.
Сreation dateDate and time when the exclusion was added.
Expires
Date and time when the exclusion will be automatically removed from the list.
CreatedName of the user that added the exclusion.
Comment
After the exclusion is added, by default, the correlation rule takes the exclusion into account for 7 days. In the Options → General section, you can configure the duration of exclusions by editing the corr_rule_exclusion_ttl_hours parameter in the Core properties section. You can configure the lifetime of exclusions in hours and days. The minimum value is 1 hour, the maximum is 365 days. This setting is available only for users with the General administrator role.
For fields from base events to be propagated to correlation events, these fields must be specified in the card of the correlation rule on the General tab, in the Propagated fields field. If the fields of base events are not mapped to the correlation event, these fields cannot be added to exclusions.
To remove exclusions from a correlation rule:
- Go to the Resources → Correlation rules section.
- In the toolbar of the rule list, click List of exclusions button.
This opens the window with the list of exclusions.
- Select the exclusions that you want to delete and click the Delete button.
Exceptions are deleted from the correlation rule.
KUMA generates an audit event whenever an exception is created or deleted. You can view the changes of event settings in the Event details window.
Page top
Predefined correlation rules
The KUMA distribution kit includes correlation rules listed in the table below.
Predefined correlation rules
Correlation rule name |
Description |
[OOTB] KATA alert |
Used for enriching KATA events. |
[OOTB] Successful Bruteforce |
Triggers when a successful authentication attempt is detected after multiple unsuccessful authentication attempts. This rule works based on the events of the sshd daemon. |
[OOTB][AD] Account created and deleted within a short period of time |
Detects instances of creation and subsequent deletion of accounts on Microsoft Windows hosts. |
[OOTB][AD] An account failed to log on from different hosts |
Detects multiple unsuccessful attempts to authenticate on different hosts. |
[OOTB][AD] Membership of sensitive group was modified |
Works based on Microsoft Windows events. |
[OOTB][AD] Multiple accounts failed to log on from the same host |
Triggers after multiple failed authentication attempts are detected on the same host from different accounts. |
[OOTB][AD] Successful authentication with the same account on multiple hosts |
Detects connections to different hosts under the same account. This rule works based on Microsoft Windows events. |
[OOTB][AD] The account added and deleted from the group in a short period of time |
Detects the addition of a user to a group and subsequent removal. This rule works based on Microsoft Windows events. |
[OOTB][Net] Possible port scan |
Detects suspected port scans. This rule works based on Netflow, Ipfix events. |
MITRE ATT&CK matrix coverage
If you want to assess the coverage of the MITRE ATT&CK matrix by your correlation rules:
- Download the list of MITRE techniques from the official MITRE ATT&CK repository and import it into KUMA.
- Map MITRE techniques to correlation rules.
- Export correlation rules to MITRE ATT&CK Navigator.
As a result, you can visually assess the coverage of the MITRE ATT&CK matrix.
Importing the list of MITRE techniques
Only a user with the General Administrator role can import the list of MITRE techniques.
To import the list of MITRE ATT&CK techniques:
- Download the list of MITRE ATT&CK techniques from the GitHub portal.
KUMA 3.2 supports only the MITRE ATT&CK technique list version 14.1.
- In the KUMA Console, go to the Settings → Other.
- In the MITRE technique list settings, click Import from file.
This opens the file selection window.
- Select the downloaded MITRE ATT&CK technique list and click Open.
This closes the file selection window.
The list of MITRE ATT&CK techniques is imported into KUMA. You can see the list of imported techniques and the version of the MITRE ATT&CK technique list by clicking View list.
Mapping MITRE techniques to correlation rules
To map MITRE ATT&CK techniques to correlation rules:
- In the KUMA Console, go to the Resources → Correlation rules section.
- Click the name of the correlation rule to open the correlation rule editing window.
This opens the correlation rule editing window.
- On the General tab, clicking the MITRE techniques field opens a list of available techniques. For the convenience of searching, a filter is provided, in which you can enter the name of a technique or the ID of a technique or tactic. One or more MITRE ATT&CK techniques are available for linking to a correlation rule.
- Click the Save button.
The MITRE ATT&CK techniques are mapped to the correlation rule. In the web interface, in the Resources → Correlation rules section, the MITRE techniques column of the edited rule displays the ID of the selected technique, and when you hover over the item, the full name of the technique is displayed, including the ID of the technique and tactic.
Exporting correlation rules to MITRE ATT&CK Navigator
To export correlation rules with mapped MITRE techniques to MITRE ATT&CK Navigator:
- In the KUMA Console, go to the Resources → Correlation rules section.
- Click the
 button in the upper-right corner.
 - In the drop-down list, click Export to MITRE ATT&CK Navigator.
- This opens a window; in that window, select the correlation rules that you want to export.
- Click OK.
A file with exported rules is downloaded to your computer.
- Upload the file from your computer to MITRE ATT&CK Navigator to assess the coverage of the MITRE ATT&CK matrix.
You can assess the coverage of the MITRE ATT&CK matrix.
Page top
Filters
Filters let you select events based on specified conditions. The collector service uses filters to select events that you want to send to KUMA. Events that satisfy the filter conditions are sent to KUMA for further processing.
You can use filters in the following KUMA services and features:
- Collector.
- Correlator.
- Storage.
- Correlation rules.
- Enrichment rules.
- Aggregation rules.
- Destinations.
- Response rules.
- Segmentation rules.
You can use standalone filters or built-in filters that are stored in the service or resource in which they were created. For resources in input fields except the Description field, you can enable the display of control characters. Available filter settings are listed in the table below.
Setting |
Description |
|---|---|
Name |
Unique name of the resource. The maximum length of the name is 128 Unicode characters. Required setting. Inline filters are created in other resources or services and do not have names. |
Tenant |
The name of the tenant that owns the resource. Required setting. |
Tags |
Tags for resource search. Optional setting. |
Description |
Description of the resource. The maximum length of the description is 4000 Unicode characters. |
You can create filter conditions and filter groups, or add existing filters to a filter.
To create filtering criteria, you can use builder mode or source code mode. In builder mode, you can create or edit filter criteria by selecting filter conditions and operators from drop-down lists. In source code mode, you can use text commands to create and edit search queries. The builder mode is used by default.
You can freely switch between modes when creating filtering criteria. To switch to source code mode, select the Code tab. When switching between modes, the created condition filters are preserved. If the filter code is not displayed on the Code tab after linking the created filter to the resource, go to the Builder tab and then go back to the Code tab to display the filter code.
Creating filtering criteria in builder mode
To create filtering criteria in builder mode, you need to select one of the following operators from the drop-down list:
- AND: The filter selects events that match all of the specified conditions.
- OR: The filter selects events that match one of the specified conditions.
- NOT: The filter selects events that match none of the specified conditions.
You can add filtering criteria in one of the following ways:
- To add a condition, click the + Add condition button.
- To add a group of conditions, click the + Add group button. When adding groups of conditions, you can also select the AND, OR, and NOT operators. In turn, you can add conditions and condition groups to a condition group.
You can add multiple filtering criteria, reorder the filtering criteria, or remove filtering criteria. To reorder filtering criteria, use the reorder icons. To remove a filtering criterion, click the delete icon next to it.
Available condition settings are listed in the table below.
Setting |
Description |
|---|---|
<Condition type> |
Condition type. The default is If. You can click the default value and select If not from the displayed drop-down list. Required setting. |
<Left operand> and <Right operand> |
Values to be processed by the operator. The available types of values of the right operand depend on the selected operator. Required settings. |
<Operator> |
Condition operator. When selecting a condition operator in the drop-down list, you can select the do not match case check box if you want the operator to ignore the case of values. This check box is ignored if the inSubnet, inActiveList, inCategory, InActiveDirectoryGroup, hasBit, and inDictionary operators are selected. By default, this check box is cleared. You can change or delete the specified operator. To change the operator, click it and specify a new operator. To delete the operator, click it, then press Backspace. |
The available operand kinds depends on whether the operand is left (L) or right (R).
Available operand kinds for left (L) and right (R) operands
Operator |
Event field type |
Active list type |
Dictionary type |
Context table type |
Table type |
TI type |
Constant type |
List type |
= |
L,R |
L,R |
L,R |
L,R |
L,R |
L,R |
R |
R |
> |
L,R |
L,R |
L,R |
L,R (only when looking up a table value by index) |
L,R |
L |
R |
|
>= |
L,R |
L,R |
L,R |
L,R (only when looking up a table value by index) |
L,R |
L |
R |
|
< |
L,R |
L,R |
L,R |
L,R (only when looking up a table value by index) |
L,R |
L |
R |
|
<= |
L,R |
L,R |
L,R |
L,R (only when looking up a table value by index) |
L,R |
L |
R |
|
inSubnet |
L,R |
L,R |
L,R |
L,R |
L,R |
L,R |
R |
R |
contains |
L,R |
L,R |
L,R |
L,R |
L,R |
L,R |
R |
R |
startsWith |
L,R |
L,R |
L,R |
L,R |
L,R |
L,R |
R |
R |
endsWith |
L,R |
L,R |
L,R |
L,R |
L,R |
L,R |
R |
R |
match |
L |
L |
L |
L |
L |
L |
R |
R |
hasVulnerability |
L |
L |
L |
L |
L |
|
|
|
hasBit |
L |
L |
L |
L |
L |
|
R |
R |
inActiveList |
|
|
|
|
|
|
|
|
inDictionary |
|
|
|
|
|
|
|
|
inCategory |
L |
L |
L |
L |
L |
|
R |
R |
inContextTable |
|
|
|
|
|
|
|
|
inActiveDirectoryGroup |
L |
L |
L |
L |
L |
|
R |
R |
TIDetect |
|
|
|
|
|
|
|
|
You can use hotkeys when managing filters. Hotkeys are described in the table below.
Hotkeys and their functions
Key |
Function |
|---|---|
e |
Invokes a filter by the event field |
d |
Invokes a filter by the dictionary field |
a |
Invokes a filter by the active list field |
c |
Invokes a filter by the context table field |
t |
Invokes a filter by the table field |
f |
Invokes a filter |
t+i |
Invokes a filter using TI |
Ctrl+Enter |
Finish editing a condition |
The usage of extended event schema fields of the "String", "Number", or "Float" types is the same as the usage of fields of the KUMA event schema.
When using filters with extended event schema fields of the "Array of strings", "Array of numbers", and "Array of floats" types, you can use the following operations:
- The
containsoperation returnsTrueif the specified substring is present in the array, otherwise it returnsFalse. - The
matchoperation matches the string against a regular expression. - The
intersecoperation.
Creating filtering criteria in source code mode
The source code mode allows you to quickly edit conditions, select and copy blocks of code. In the right part of the builder, you can find the navigator, which lets you to navigate the filter code. Line wrapping is performed automatically at AND, OR, NOT logical operators, or at commas that separate the items in the list of values.
Names of resources used in the filter are automatically specified. Fields containing the names of linked resources cannot be edited. The names of shared resource categories are not displayed in the filter if you do not have the "Access to shared resources" role. To view the list of resources for the selected operand inside the expression, press Ctrl+Space. This displays a list of resources.
The filters listed in the table below are included in the KUMA kit.
Predefined filters
Filter name |
Description |
[OOTB][AD] A member was added to a security-enabled global group (4728) |
Selects events of adding a user to an Active Directory security-enabled global group. |
[OOTB][AD] A member was added to a security-enabled universal group (4756) |
Selects events of adding a user to an Active Directory security-enabled universal group. |
[OOTB][AD] A member was removed from a security-enabled global group (4729) |
Selects events of removing a user from an Active Directory security-enabled global group. |
[OOTB][AD] A member was removed from a security-enabled universal group (4757) |
Selects events of removing a user from an Active Directory security-enabled universal group. |
[OOTB][AD] Account Created |
Selects Windows user account creation events. |
[OOTB][AD] Account Deleted |
Selects Windows user account deletion events. |
[OOTB][AD] An account failed to log on (4625) |
Selects Windows logon failure events. |
[OOTB][AD] Successful Kerberos authentication (4624, 4768, 4769, 4770) |
Selects successful Windows logon events and events with IDs 4769, 4770 that are logged on domain controllers. |
[OOTB][AD][Technical] 4768. TGT Requested |
Selects Microsoft Windows events with ID 4768. |
[OOTB][Net] Possible port scan |
Selects events that may indicate a port scan. |
[OOTB][SSH] Accepted Password |
Selects events of successful SSH connections with a password. |
[OOTB][SSH] Failed Password |
Selects attempts to connect over SSH with a password. |
Active lists
The active list is a bucket for data that is used by KUMA correlators for analyzing events according to the correlation rules.
For example, for a list of IP addresses with a bad reputation, you can:
- Create a correlation rule of the operational type and add these IP addresses to the active list.
- Create a correlation rule of the standard type and specify the active list as filtering criteria.
- Create a correlator with this rule.
In this case, KUMA selects all events that contain the IP addresses in the active list and creates a correlation event.
You can fill active lists automatically using correlation rules of the simple type or import a file that contains data for the active list.
You can add, copy, or delete active lists.
Active lists can be used in the following KUMA services and features:
The same active list can be used by different correlators. However, a separate entity of the active list is created for each correlator. Therefore, the contents of the active lists used by different correlators differ even if the active lists have the same names and IDs.
Only data based on correlation rules of the correlator are added to the active list.
You can add, edit, duplicate, delete, and export records in the active correlator sheet.
During the correlation process, when entries are deleted from active lists after their lifetime expires, service events are generated in the correlators. These events only exist in the correlators, and they are not redirected to other destinations. Correlation rules can be configured to track these events so that they can be processed and used to identify threats. Service event fields for deleting an entry from the active list are described below.
Event field |
Value or comment |
|
Event identifier |
|
Time when the expired entry was deleted |
|
|
|
|
|
|
|
Correlator ID |
|
Correlator name |
|
Active list ID |
|
Key of the expired entry |
|
Number of deleted entry updates increased by one |
S.<active list field> |
Dropped-out entry of the active list in the following format: S.<active list field> = <value of active list field> |
Viewing the table of active lists
To view the table of correlator active lists:
- In the KUMA Console, select the Resources section.
- In the Services section, click the Active services button.
- Select the check box next to the correlator for which you want to view the active list.
- Click the Go to active lists button.
The Correlator active lists table is displayed.
The table contains the following data:
- Name—the name of the correlator list.
- Records—the number of record the active list contains.
- Size on disk—the size of the active list.
- Directory—the path to the active list on the KUMA Core server.
Adding active list
To add active list:
- In the KUMA Console, select the Resources section.
- In the Resources section, click the Active lists button.
- Click the Add active list button.
- Do the following:
- In the Name field, enter a name for the active list.
- In the Tenant drop-down list, select the tenant that owns the resource.
- In the TTL field, specify time the record added to the active list is stored in it.
When the specified time expires, the record is deleted. The time is specified in seconds.
The default value is 0. If the value of the field is 0, the record is retained for 36,000 days (roughly 100 years).
- In the Description field, provide any additional information.
You can use up to 4,000 Unicode characters.
This field is optional.
- Click the Save button.
The active list is added.
Page top
Viewing the settings of an active list
To view the settings of an active list:
- In the KUMA Console, select the Resources section.
- In the Resources section, click the Active lists button.
- In the Name column, select the active list whose settings you want to view.
This opens the active list settings window. It displays the following information:
- ID—identifier selected Active list.
- Name—unique name of the resource.
- Tenant—the name of the tenant that owns the resource.
- TTL—the record added to the active list is stored in it for this time. This value is specified in seconds.
- Description—any additional information about the resource.
Changing the settings of an active list
To change the settings of an active list:
- In the KUMA Console, select the Resources section.
- In the Resources section, click the Active lists button.
- In the Name column, select the active list whose settings you want to change.
- Specify the values of the following parameters:
- Name—unique name of the resource.
- TTL—the record added to the active list is stored in it for this time. This value is specified in seconds.
If the field is set to 0, the record is stored indefinitely.
- Description—any additional information about the resource.
The ID and Tenant fields are not editable.
Duplicating the settings of an active list
To copy an active list:
- In the KUMA Console, select the Resources section.
- In the Resources section, click the Active lists button.
- Select the check box next to the active lists you want to copy.
- Click Duplicate.
- Specify the necessary settings.
- Click the Save button.
The active list is copied.
Page top
Deleting an active list
To delete an active list:
- In the KUMA Console, select the Resources section.
- In the Resources section, click the Active lists button.
- Select the check boxes next to the active lists you want to delete.
To delete all lists, select the check box next to the Name column.
At least one check box must be selected.
- Click the Delete button.
- Click OK.
The active lists are deleted.
Page top
Viewing records in the active list
To view the records in the active list:
- In the KUMA Console, select the Resources section.
- In the Services section, click the Active services button.
- Select the check box next to the correlator for which you want to view the active list.
- Click the Go to active lists button.
The Correlator active lists table is displayed.
- In the Name column, select the desired active list.
A table of records for the selected list is opened.
The table contains the following data:
- Key – the value of the record key.
- Record repetitions – total number of times the record was mentioned in events and identical records were downloaded when importing active lists to KUMA.
- Expiration date – date and time when the record must be deleted.
If the TTL field had the value of 0 when the active list was created, the records of this active list are retained for 36,000 days (roughly 100 years).
- Created – the time when the active list was created.
- Updated – the time when the active list was last updated.
Searching for records in the active list
To find a record in the active list:
- In the KUMA Console, select the Resources section.
- In the Services section, click the Active services button.
- Select the check box next to the correlator for which you want to view the active list.
- Click the Go to active lists button.
The Correlator active lists table is displayed.
- In the Name column, select the desired active list.
A window with the records for the selected list is opened.
- In the Search field, enter the record key value or several characters from the key.
The table of records of the active list displays only the records with the key containing the entered characters.
Page top
Adding a record to an active list
To add a record to the active list:
- In the KUMA Console, select the Resources section.
- In the Services section, click the Active services button.
- Select the check box next to the required correlator.
- Click the Go to active lists button.
The Correlator active lists table is displayed.
- In the Name column, select the desired active list.
A window with the records for the selected list is opened.
- Click Add.
The Create record window opens.
- Specify the values of the following parameters:
- In the Key field, enter the name of the record.
You can specify several values separated by the "|" character.
The Key field cannot be empty. If the field is not filled in, KUMA returns an error when trying to save the changes.
- In the Value field, specify the values for fields in the Field column.
KUMA takes field names from the correlation rules with which the active list is associated. These names are not editable. You can delete these fields if necessary.
- Click the Add new element button to add more values.
- In the Field column, specify the field name.
The name must meet the following requirements:
- To be unique
- Do not contain tab characters
- Do not contain special characters except for the underscore character
- The maximum number of characters is 128.
The name must not begin with an underscore and contain only numbers.
- In the Value column, specify the value for this field.
It must meet the following requirements:
- Do not contain tab characters.
- Do not contain special characters except for the underscore character.
- The maximum number of characters is 1024.
This field is optional.
- In the Key field, enter the name of the record.
- Click the Save button.
The record is added. After saving, the records in the active list are sorted in alphabet order.
Page top
Duplicating records in the active list
To duplicate a record in the active list:
- In the KUMA Console, select the Resources section.
- In the Services section, click the Active services button.
- Select the check box next to the correlator for which you want to view the active list.
- Click the Go to active lists button.
The Correlator active lists table is displayed.
- In the Name column, select the desired active list.
A window with the records for the selected list is opened.
- Select the check boxes next to the record you want to copy.
- Click Duplicate.
- Specify the necessary settings.
The Key field cannot be empty. If the field is not filled in, KUMA returns an error when trying to save the changes.
Editing the field names in the Field column is not available for the records that have been added to the active list before. You can change the names only for records added at the time of editing. The name must not begin with an underscore and contain only numbers.
- Click the Save button.
The record is copied. After saving, the records in the active list are sorted in alphabet order.
Page top
Changing a record in the active list
To edit a record in the active list:
- In the KUMA Console, select the Resources section.
- In the Services section, click the Active services button.
- Select the check box next to the correlator for which you want to view the active list.
- Click the Go to active lists button.
The Correlator active lists table is displayed.
- In the Name column, select the desired active list.
A window with the records for the selected list is opened.
- Click the record name in the Key column.
- Specify the required values.
- Click the Save button.
The record is overwritten. After saving, the records in the active list are sorted in alphabet order.
Restrictions when editing a record:
- The record name is not editable. You can change it by importing the same data with a different name.
- Editing the field names in the Field column is not available for the records that have been added to the active list before. You can change the names only for records added at the time of editing. The name must not begin with an underscore and contain only numbers.
- The values in the Value column must meet the following requirements:
- Do not contain Cyrillic characters.
- Do not contain spaces or tabs.
- Do not contain special characters except for the underscore character.
- The maximum number of characters is 128.
Deleting records from the active list
To delete records from the active list:
- In the KUMA Console, select the Resources section.
- In the Services section, click the Active services button.
- Select the check box next to the correlator for which you want to view the active list.
- Click the Go to active lists button.
The Correlator active lists table is displayed.
- In the Name column, select the desired active list.
A window with the records for the selected list is opened.
- Select the check boxes next to the records you want to delete.
To delete all records, select the check box next to the Key column.
At least one check box must be selected.
- Click the Delete button.
- Click OK.
The records will be deleted.
Page top
Import data to an active list
To import active list:
- In the KUMA Console, select the Resources section.
- In the Services section, click the Active services button.
- Select the check box next to the correlator for which you want to view the active list.
- Click the Go to active lists button.
The Correlator active lists table is displayed.
- Point the mouse over the row with the desired active list.
- Click to the left of the active list name.
- Select Import.
The active list import window opens.
- In the File field select the file you wan to import.
- In the Format drop-down list select the format of the file:
- csv
- tsv
- internal
- Under Key field, enter the name of the column containing the active list record keys.
- Click the Import button.
The data from the file is imported into the active list. The records included in the list before are saved.
Data imported from a file is not checked for invalid characters. If you use this data in widgets, widgets are displayed incorrectly if invalid characters are present in the data.
Page top
Exporting data from the active list
To export active list:
- In the KUMA Console, select the Resources section.
- In the Services section, click the Active services button.
- Select the check box next to the correlator for which you want to view the active list.
- Click the Go to active lists button.
The Correlator active lists table is displayed.
- Point the mouse over the row with the desired active list.
- Click to the left of the desired active list.
- Click the Export button.
The active list is downloaded in the JSON format using your browsers settings. The name of the downloaded file reflects the name of active list.
Page top
Predefined active lists
The active lists listed in the table below are included in the KUMA distribution kit.
Predefined active lists
Active list name |
Description |
[OOTB][AD] End-users tech support accounts |
This active list is used as a filter for the "[OOTB][AD] Successful authentication with same user account on multiple hosts" correlation rule. Accounts of technical support staff may be added to the active list. Records are not deleted from the active list. |
[OOTB][AD] List of sensitive groups |
This active list is used as a filter for the "[OOTB][AD] Membership of sensitive group was modified" correlation rule. Critical domain groups, whose membership must be monitored, can be added to the active list. Records are not deleted from the active list. |
[OOTB][Linux] CompromisedHosts |
This active list is populated by the [OOTB] Successful Bruteforce by potentially compromised Linux hosts rule. Records are removed from the list 24 hours after they are recorded. |
Dictionaries
Description of parameters
Dictionaries are resources storing data that can be used by other KUMA resources and services. Dictionaries can be used in the following KUMA services and features:
Available dictionary settings are listed in the table below.
Available dictionary settings
Setting |
Description |
|---|---|
Name |
Unique name for this resource type. Maximum length of the name: 128 Unicode characters. Required setting. |
Tenant |
The name of the tenant that owns the resource. Required setting. |
Description |
Description of the resource. Maximum length of the description: 4000 Unicode characters. |
Type |
Dictionary type. The selected dictionary type determines the format of the data that the dictionary can contain:
Required setting. |
Values |
Table with dictionary data.
If the dictionary contains more than 5,000 entries, they are not displayed in the KUMA Console. To view the contents of such dictionaries, the contents must be exported in CSV format. If you edit the CSV file and import it back into KUMA, the dictionary is updated. |
 . To remove a row from the table, hover over the table row until the
  button appears and click the button.
Importing and exporting dictionaries
You can import or export dictionary data in CSV format (in UTF-8 encoding) by using the Import CSV or Export CSV buttons.
The format of the CSV file depends on the dictionary type:
- Dictionary type:
{KEY},{VALUE}\n - Table type:
{Column header 1}, {Column header N}, {Column header N+1}\n{Key1}, {ValueN}, {ValueN+1}\n{Key2}, {ValueN}, {ValueN+1}\nThe keys must be unique for both the CSV file and the dictionary. In tables, the keys are specified in the first column. Keys must contain 1 to 128 Unicode characters.
Values must contain 0 to 256 Unicode characters.
During an import, the contents of the dictionary are overwritten by the imported file. When imported into the dictionary, the resource name is also changed to reflect the name of the imported file.
If the key or value contains comma or quotation mark characters (, and "), they are enclosed in quotation marks (") when exported. Also, quotation mark character (") is shielded with additional quotation mark (").
If incorrect lines are detected in the imported file (for example, invalid separators), these lines will be ignored during import into the dictionary, and the import process will be interrupted during import into the table.
Interacting with dictionaries via API
You can use the REST API to read the contents of Table-type dictionaries. You can also modify them even if these resources are being used by active services. This lets you, for instance, configure enrichment of events with data from dynamically changing tables exported from third-party applications.
Predefined dictionaries
The dictionaries listed in the table below are included in the KUMA distribution kit.
Predefined dictionaries
Dictionary name |
Type |
Description |
[OOTB] Ahnlab. Severity |
dictionary |
Contains a table of correspondence between a priority ID and its name. |
[OOTB] Ahnlab. SeverityOperational |
dictionary |
Contains values of the SeverityOperational parameter and a corresponding description. |
[OOTB] Ahnlab. VendorAction |
dictionary |
Contains a table of correspondence between the ID of the operation being performed and its name. |
[OOTB] Cisco ISE Message Codes |
dictionary |
Contains Cisco ISE event codes and their corresponding names. |
[OOTB] DNS. Opcodes |
dictionary |
Contains a table of correspondence between decimal opcodes of DNS operations and their IANA-registered descriptions. |
[OOTB] IANAProtocolNumbers |
dictionary |
Contains the port numbers of transport protocols (TCP, UDP) and their corresponding service names, registered by IANA. |
[OOTB] Juniper - JUNOS |
dictionary |
Contains JUNOS event IDs and their corresponding descriptions. |
[OOTB] KEDR. AccountType |
dictionary |
Contains the ID of the user account type and its corresponding type name. |
[OOTB] KEDR. FileAttributes |
dictionary |
Contains IDs of file attributes stored by the file system and their corresponding descriptions. |
[OOTB] KEDR. FileOperationType |
dictionary |
Contains IDs of file operations from the KATA API and their corresponding operation names. |
[OOTB] KEDR. FileType |
dictionary |
Contains modified file IDs from the KATA API and their corresponding file type descriptions. |
[OOTB] KEDR. IntegrityLevel |
dictionary |
Contains the SIDs of the Microsoft Windows INTEGRITY LEVEL parameter and their corresponding descriptions. |
[OOTB] KEDR. RegistryOperationType |
dictionary |
Contains IDs of registry operations from the KATA API and their corresponding values. |
[OOTB] Linux. Sycall types |
dictionary |
Contains Linux call IDs and their corresponding names. |
[OOTB] MariaDB Error Codes |
dictionary |
The dictionary contains MariaDB error codes and is used by the [OOTB] MariaDB Audit Plugin syslog normalizer to enrich events. |
[OOTB] Microsoft SQL Server codes |
dictionary |
Contains MS SQL Server error IDs and their corresponding descriptions. |
[OOTB] MS DHCP Event IDs Description |
dictionary |
Contains Microsoft Windows DHCP server event IDs and their corresponding descriptions. |
[OOTB] S-Terra. Dictionary MSG ID to Name |
dictionary |
Contains IDs of S-Terra device events and their corresponding event names. |
[OOTB] S-Terra. MSG_ID to Severity |
dictionary |
Contains IDs of S-Terra device events and their corresponding Severity values. |
[OOTB] Syslog Priority To Facility and Severity |
table |
The table contains the Priority values and the corresponding Facility and Severity field values. |
[OOTB] VipNet Coordinator Syslog Direction |
dictionary |
Contains direction IDs (sequences of special characters) used in ViPNet Coordinator to designate a direction, and their corresponding values. |
[OOTB] Wallix EventClassId - DeviceAction |
dictionary |
Contains Wallix AdminBastion event IDs and their corresponding descriptions. |
[OOTB] Windows.Codes (4738) |
dictionary |
Contains operation codes present in the MS Windows audit event with ID 4738 and their corresponding names. |
[OOTB] Windows.Codes (4719) |
dictionary |
Contains operation codes present in the MS Windows audit event with ID 4719 and their corresponding names. |
[OOTB] Windows.Codes (4663) |
dictionary |
Contains operation codes present in the MS Windows audit event with ID 4663 and their corresponding names. |
[OOTB] Windows.Codes (4662) |
dictionary |
Contains operation codes present in the MS Windows audit event with ID 4662 and their corresponding names. |
[OOTB] Windows. EventIDs and Event Names mapping |
dictionary |
Contains Windows event IDs and their corresponding event names. |
[OOTB] Windows. FailureCodes (4625) |
dictionary |
Contains IDs from the Failure Information\Status and Failure Information\Sub Status fields of Microsoft Windows event 4625 and their corresponding descriptions. |
[OOTB] Windows. ImpersonationLevels (4624) |
dictionary |
Contains IDs from the Impersonation level field of Microsoft Windows event 4624 and their corresponding descriptions. |
[OOTB] Windows. KRB ResultCodes |
dictionary |
Contains Kerberos v5 error codes and their corresponding descriptions. |
[OOTB] Windows. LogonTypes (Windows all events) |
dictionary |
Contains IDs of user logon types and their corresponding names. |
[OOTB] Windows_Terminal Server. EventIDs and Event Names mapping |
dictionary |
Contains Microsoft Terminal Server event IDs and their corresponding names. |
[OOTB] Windows. Validate Cred. Error Codes |
dictionary |
Contains IDs of user logon types and their corresponding names. |
[OOTB] ViPNet Coordinator Syslog Direction |
dictionary |
Contains direction IDs (sequences of special characters) used in ViPNet Coordinator to designate a direction, and their corresponding values. |
[OOTB] Syslog Priority To Facility and Severity |
table |
Contains the Priority values and the corresponding Facility and Severity field values. |
Response rules
Response rules let you initiate automatic running of Open Single Management Platform tasks, Threat Response actions for Kaspersky Endpoint Detection and Response, KICS/KATA, Active Directory, and running a custom script for specific events.
Automatic execution of Open Single Management Platform tasks, Kaspersky Endpoint Detection and Response tasks, and KICS/KATA and Active Directory tasks in accordance with response rules is available when integrated with the relevant programs.
You can configure response rules under Resources → Response, and then select the created response rule from the drop-down list in the correlator settings. You can also configure response rules directly in the correlator settings.
Response rules for Open Single Management Platform
You can configure response rules to automatically start tasks of anti-virus scan and updates on Open Single Management Platform assets.
When creating and editing response rules for Open Single Management Platform, you need to define values for the following settings.
Response rule settings
Setting |
Description |
|---|---|
Name |
Required setting. Unique name of the resource. Must contain 1 to 128 Unicode characters. |
Tenant |
Required setting. The name of the tenant that owns the resource. |
Type |
Required setting, available if KUMA is integrated with Open Single Management Platform. Response rule type, ksctasks. |
Open Single Management Platform task |
Required setting. Name of the Open Single Management Platform task to run. Tasks must be created beforehand, and their names must begin with " You can use KUMA to run the following types of Open Single Management Platform tasks:
|
Event field |
Required setting. Defines the event field of the asset for which the Open Single Management Platform task should be started. Possible values:
|
Handlers |
The number of handlers that the service can run simultaneously to process response rules in parallel. By default, the number of handlers is the same as the number of virtual processors on the server where the service is installed. |
Description |
Description of the response rule. You can add up to 4,000 Unicode characters. |
Filter |
Used to define the conditions for the events to be processed using the response rule. You can select an existing filter from the drop-down list or create a new filter. Creating a filter in resources To create a filter:
|
To send requests to Open Single Management Platform, you must ensure that Open Single Management Platform is available over the UDP protocol.
If a response rule is owned by the shared tenant, the displayed Open Single Management Platform tasks that are available for selection are from the Open Single Management Platform server that the main tenant is connected to.
If a response rule has a selected task that is absent from the Open Single Management Platform server that the tenant is connected to, the task is not performed for assets of this tenant. This situation could arise when two tenants are using a common correlator, for example.
Page top
Response rules for a custom script
You can create a script containing commands to be executed on the Kaspersky Unified Monitoring and Analysis Platform server when selected events are detected and configure response rules to automatically run this script. In this case, the program will run the script when it receives events that match the response rules.
The script file is stored on the server where the correlator service using the response resource is installed: /opt/kaspersky/kuma/correlator/<Correlator ID>/scripts. The kuma user of this server requires the permissions to run the script.
When creating and editing response rules for a custom script, you need to define values for the following parameters.
Response rule settings
Setting |
Description |
|---|---|
Name |
Required setting. Unique name of the resource. Must contain 1 to 128 Unicode characters. |
Tenant |
Required setting. The name of the tenant that owns the resource. |
Type |
Required setting. Response rule type, script. |
Timeout |
The number of seconds allotted for the script to finish. If this amount of time is exceeded, the script is terminated. |
Script name |
Required setting. Name of the script file. If the response resource is attached to the correlator service but there is no script file in the /opt/kaspersky/kuma/correlator/<Correlator ID>/scripts folder, the correlator will not work. |
Script arguments |
Arguments or event field values that must be passed to the script. If the script includes actions taken on files, you should specify the absolute path to these files. Parameters can be written with quotation marks ("). Event field names are passed in the Example: |
Handlers |
The number of handlers that the service can run simultaneously to process response rules in parallel. By default, the number of handlers is the same as the number of virtual processors on the server where the service is installed. |
Description |
Description of the resource. You can add up to 4,000 Unicode characters. |
Filter |
Used to define the conditions for the events to be processed using the response rule. You can select an existing filter from the drop-down list or create a new filter. Creating a filter in resources To create a filter:
|
Response rules for KICS for Networks
You can configure response rules to automatically trigger response actions on KICS for Networks assets. For example, you can change the asset status in KICS for Networks.
When creating and editing response rules for KICS for Networks, you need to define values for the following settings.
Response rule settings
Setting |
Description |
|---|---|
Name |
Required setting. Unique name of the resource. Must contain 1 to 128 Unicode characters. |
Tenant |
Required setting. The name of the tenant that owns the resource. |
Type |
Required setting. Response rule type, Response via KICS/KATA. |
Event field |
Required setting. Specifies the event field for the asset for which response actions must be performed. Possible values:
|
KICS for Networks task |
Response action to be performed when data is received that matches the filter. The following types of response actions are available:
When a response rule is triggered, KUMA will send KICS for Networks an API request to change the status of the specified device to Authorized or Unauthorized. |
Handlers |
The number of handlers that the service can run simultaneously to process response rules in parallel. By default, the number of handlers is the same as the number of virtual processors on the server where the service is installed. |
Description |
Description of the resource. You can add up to 4,000 Unicode characters. |
Filter |
Used to define the conditions for the events to be processed using the response rule. You can select an existing filter from the drop-down list or create a new filter. Creating a filter in resources To create a filter:
|
Response rules for Kaspersky Endpoint Detection and Response
You can configure response rules to automatically trigger response actions on Kaspersky Endpoint Detection and Response assets. For example, you can configure automatic asset network isolation.
When creating and editing response rules for Kaspersky Endpoint Detection and Response, you need to define values for the following settings.
Response rule settings
Setting |
Description |
|---|---|
Event field |
Required setting. Specifies the event field for the asset for which response actions must be performed. Possible values:
|
Task type |
Response action to be performed when data is received that matches the filter. The following types of response actions are available:
At least one of the above fields must be completed.
All of the listed operations can be performed on assets that have Kaspersky Endpoint Agent for Windows. On assets that have Kaspersky Endpoint Agent for Linux, the program can only be started. At the software level, the capability to create prevention rules and network isolation rules for assets with Kaspersky Endpoint Agent for Linux is unlimited. Kaspersky Unified Monitoring and Analysis Platform and Kaspersky Endpoint Detection and Response do not notify about failing to apply these rules. |
Handlers |
The number of handlers that the service can run simultaneously to process response rules in parallel. By default, the number of handlers is the same as the number of virtual processors on the server where the service is installed. |
Description |
Description of the response rule. You can add up to 4,000 Unicode characters. |
Filter |
Used to define the conditions for the events to be processed using the response rule. You can select an existing filter from the drop-down list or create a new filter. Creating a filter in resources To create a filter:
|
Active Directory response rules
Active Directory response rules define the actions to be applied to an account if a rule is triggered.
When creating and editing response rules using Active Directory, specify the values for the following settings.
Response rule settings
Setting |
Description |
|---|---|
Name |
Required setting. Unique name of the resource. Must contain 1 to 128 Unicode characters. |
Tenant |
Required setting. The name of the tenant that owns the resource. |
Type |
Required setting. Response rule type, Response via Active Directory. |
Source of the user account ID |
Event field from which the Active Directory account ID value is taken. Possible values:
|
AD command |
Command that is applied to the account when the response rule is triggered. Available values:
If your Active Directory domain allows selecting the User cannot change password check box, resetting the user account password as a response will result in a conflict of requirements for the user account: the user will not be able to authenticate. The domain administrator will need to clear one of the check boxes for the affected user account: User cannot change password or User must change password at next logon.
|
Group DN |
The DistinguishedName of the domain group in fields for each role. The users of this domain group must be able to authenticate with their domain user accounts. Example of entering a group: OU=KUMA users,OU=users,DC=example,DC=domain |
Handlers |
The number of handlers that the service can run simultaneously to process response rules in parallel. By default, the number of handlers is the same as the number of virtual processors on the server where the service is installed. |
Filter |
Used to define the conditions for the events to be processed using the response rule. You can select an existing filter from the drop-down list or create a new filter. Creating a filter in resources To create a filter:
|
Connectors
Connectors are used for establishing connections between Kaspersky Unified Monitoring and Analysis Platform services and for receiving events actively and passively.
You can specify connector settings on the Basic settings and Advanced settings tabs. The available settings depend on the selected type of connector.
Connectors can have the following types:
- internal – Used for receiving data from KUMA services using the 'internal' protocol.
- tcp – Used for passively receiving events over TCP when working with Windows and Linux agents.
- udp – Used for passively receiving events over UDP when working with Windows and Linux agents.
- netflow – Used for passively receiving events in the NetFlow format.
- sflow – Used for passively receiving events in the sFlow format. For sFlow, only structures described in sFlow version 5 are supported.
- nats-jetstream – Used for interacting with a NATS message broker when working with Windows and Linux agents.
- kafka – Used for communicating with the Apache Kafka data bus when working with Windows and Linux agents.
- http – Used for receiving events over HTTP when working with Windows and Linux agents.
- sql – Used for querying databases. KUMA supports multiple types of databases. When creating a connector of the sql type, you must specify general connector settings and individual database connection settings.
- file – Used for getting data from text files when working with Windows and Linux agents. One line of a text file is considered to be one event.
\nis used as the newline character. - 1c-log – Used for getting data from 1C technology logs when working with Linux agents.
\nis used as the newline character. The connector accepts only the first line from a multi-line event record. - 1c-xml – Used for getting data from 1C registration logs when working with Linux agents. When the connector handles multi-line events, it converts them into single-line events.
- diode – Used for unidirectional data transmission in industrial ICS networks using data diodes.
- ftp – Used for getting data over File Transfer Protocol (FTP) when working with Windows and Linux agents.
- nfs – Used for getting data over Network File System (NFS) when working with Windows and Linux agents.
- wmi – Used for getting data using Windows Management Instrumentation when working with Windows agents.
- wec – Used for getting data using Windows Event Forwarding (WEF) and Windows Event Collector (WEC), or local operating system logs of a Windows host when working with Windows agents.
- etw – Used for getting extended logs of DNS servers.
- snmp – Used for getting data over Simple Network Management Protocol (SNMP) when working with Windows and Linux agents. To process events received over SNMP, you must use the json normalizer. Supported SNMP protocol versions:
- snmpV1
- snmpV2
- snmpV3
- snmp-trap – Used for passively receiving events using SNMP traps when working with Windows and Linux agents. The connector receives snmp-trap events and prepares them for normalization by mapping SNMP object IDs to temporary keys. Then the message is passed to the JSON normalizer, where the temporary keys are mapped to the KUMA fields and an event is generated. To process events received over SNMP, you must use the json normalizer. Supported SNMP protocol versions:
- snmpV1
- snmpV2
- kata/edr – Used for getting KEDR data via the API.
- vmware – Used for getting VMware vCenter data via the API.
- elastic – Used for getting Elasticsearch data. Elasticsearch version 7.0.0 is supported.
- office365 – Used for receiving Microsoft 365 (Office 365) data via the API.
Some connector types (such as tcp, sql, wmi, wec, and etw) support TLS encryption. KUMA supports TLS 1.2 and 1.3. When TLS mode is enabled for these connectors, the connection is established according to the following algorithm:
- If KUMA is being used as a client:
- KUMA sends a connection request to the server with a ClientHello message specifying the maximum supported TLS version (1.3), as well as a list of supported ciphersuites.
- The server responds with the preferred TLS version and a ciphersuite.
- Depending on the TLS version in the server response:
- If the server responds to the request with TLS 1.3 or 1.2, KUMA establishes a connection with the server.
- If the server responds to the request with TLS 1.1, KUMA terminates the connection with the server.
- If KUMA is being used as a server:
- The client sends a connection request to KUMA with the maximum supported TLS version, as well as a list of supported ciphersuites.
- Depending on the TLS version in the client request:
- If the ClientHello message of the client request specifies TLS 1.1, KUMA terminates the connection.
- If the client request specifies TLS 1.2 or 1.3, KUMA responds to the request with the preferred TLS version and a ciphersuite.
Viewing connector settings
To view connector settings:
- In the web interface of Kaspersky Unified Monitoring and Analysis Platform, go to the Resources → Connectors section.
- In the folder structure, select the folder containing the relevant connector.
- Select the connector whose settings you want to view.
The settings of connectors are displayed on two tabs: Basic settings and Advanced settings. For a detailed description of each connector settings, please refer to the Connector settings section.
Page top
Adding a connector
You can enable the display of non-printing characters for all entry fields except the Description field.
To add a connector:
- In the web interface of Kaspersky Unified Monitoring and Analysis Platform, go to the Resources → Connectors section.
- In the folder structure, select the folder in which you want the connector to be located.
Root folders correspond to tenants. To make a connector available to a specific tenant, the resource must be created in the folder of that tenant.
If the required folder is absent from the folder tree, you need to create it.
By default, added connectors are created in the Shared folder.
- Click the Add connector button.
- Define the settings for the selected connector type.
The settings that you must specify for each type of connector are provided in the Connector settings section.
- Click the Save button.
Connector settings
This section contains the description of all connector types supported by Kaspersky Unified Monitoring and Analysis Platform.
Connector, internal type
Connectors of the internaltypeUsed for receiving data from KUMA services using the 'internal' protocol. For example, you must use such a connector to receive the following data:
- Internal data, such as event routes.
- File attributes. If while creating the collector at the Transport step of the installation wizard, you specified a connector of the file, 1c-xml, or 1c-log type, at the Event parsing step, in the Mapping table, you can pass the name of the file being processed by the collector or the path to the file in the KUMA event field. To do this, in the Source column, specify one of the following values:
$kuma_fileSourceNameto pass the name of the file being processed by the collector in the KUMA event field.$kuma_fileSourcePathto pass the path to the file being processed by the collector in the KUMA event field.
When you use a file, 1c-xml, or 1c-log connector, the new variables in the normalizer will only work with destinations of the internal type.
- Events to the event router. The event router can only receive events over the 'internal' protocol, therefore you can only use internal destinations when sending events to the event router.
Settings for a connector of the internal type are described in the following tables.
Basic settings tab
Setting |
Description |
|---|---|
Name |
Unique name of the resource. The maximum length of the name is 128 Unicode characters. Required setting. |
Tenant |
The name of the tenant that owns the resource. Required setting. |
Type |
Connector type: internal. Required setting. |
Tags |
Tags for resource search. Optional setting. |
URL |
The URL and port that the connector is listening on. You can enter a value in one of the following formats:
You can specify IPv6 addresses in the following format: You can add multiple values or delete values. To add a value, click the + Add button. To delete a value, click the delete Required setting. |
Description |
Description of the resource. The maximum length of the description is 4000 Unicode characters. |
Advanced settings tab
Setting |
Description |
|---|---|
Debug |
Ths switch enables resource logging. The toggle switch is turned off by default. |
Connector, tcp type
Connectors of the tcp typeUsed for passively receiving events over TCP when working with Windows and Linux agents. Settings for a connector of the tcp type are described in the following tables.
Basic settings tab
Setting |
Description |
|---|---|
Name |
Unique name of the resource. The maximum length of the name is 128 Unicode characters. Required setting. |
Tenant |
The name of the tenant that owns the resource. Required setting. |
Type |
Connector type: tcp. Required setting. |
Tags |
Tags for resource search. Optional setting. |
URL |
URL that you want to connect to. You can enter a URL in one of the following formats:
Required setting. |
Auditd |
This toggle switch enables the auditd mechanism to group auditd event lines received from the connector into an auditd event. If you enable this toggle switch, you cannot select a value in the Delimiter drop-down list because \n is automatically selected for the auditd mechanism. If you enable this toggle switch in the connector settings of the agent, you need to select \n in the Delimiter drop-down list in the connector settings of the collector to which the agent sends events. The maximum size of a grouped auditd event is approximately 4,174,304 characters. |
Delimiter |
The character that marks the boundary between events:
If you do not select a value in this drop-down list, \n is selected by default. |
Description |
Description of the resource. The maximum length of the description is 4000 Unicode characters. |
Advanced settings tab
Setting |
Description |
|---|---|
Debug |
Ths switch enables resource logging. The toggle switch is turned off by default. |
Buffer size |
Buffer size in bytes for accumulating events in the RAM of the server before sending them for further processing or storage. The value must be a positive integer. Default buffer size: 1,048,576 bytes (1 MB). Maximum buffer size: 67,108,864 bytes (64 MB). |
Character encoding |
Character encoding. The default is UTF-8. |
Event buffer TTL |
Buffer lifetime for auditd event lines, in milliseconds. Auditd event lines enter the KUMA collector and accumulate in the buffer. This allows multiple auditd event lines to be grouped into a single auditd event. The buffer lifetime countdown begins when the first auditd event line is received or when the previous buffer lifetime expires. Possible values: from 50 to 30,000. The default value is This field is available if you have enabled the Auditd toggle switch on the Basic settings tab. The auditd event lines accumulated in the buffer are kept in the RAM of the server. We recommend caution when increasing the buffer size because memory usage by the KUMA collector may become excessive. You can see how much server RAM the KUMA collector is using in KUMA metrics. If you want a buffer lifetime to exceed 30,000 milliseconds, we recommend using a different auditd event transport. For example, you can use an agent or pre-accumulate auditd events in a file, and then process this file with the KUMA collector. |
Transport header |
Regular expression for auditd events, which is used to identify auditd event lines. You can use the default value or edit it. The regular expression must contain the You can revert to the default regular expression for auditd events by clicking Reset to default value. |
TLS mode |
TLS encryption mode. When using TLS encryption, you cannot specify an IP address in the URL field on the Basic settings. Available values:
|
Compression |
Drop-down list for configuring Snappy compression:
|
Connector, udp type
Connectors of the udp typeUsed for passively receiving events over UDP when working with Windows and Linux agents. Settings for a connector of the udp type are described in the following tables.
Basic settings tab
Setting |
Description |
|---|---|
Name |
Unique name of the resource. The maximum length of the name is 128 Unicode characters. Required setting. |
Tenant |
The name of the tenant that owns the resource. Required setting. |
Type |
Connector type: udp. Required setting. |
URL |
URL that you want to connect to. You can enter a URL in one of the following formats:
Required setting. |
Auditd |
This toggle switch enables the auditd mechanism to group auditd event lines received from the connector into an auditd event. If you enable this toggle switch, you cannot select a value in the Delimiter drop-down list because \n is automatically selected for the auditd mechanism. If you enable this toggle switch in the connector settings of the agent, you need to select \n in the Delimiter drop-down list in the connector settings of the collector to which the agent sends events. The maximum size of a grouped auditd event is approximately 4,174,304 characters. |
Delimiter |
The character that marks the boundary between events:
If you do not select a value in this drop-down list, \n is selected by default. |
Description |
Description of the resource. The maximum length of the description is 4000 Unicode characters. |
Advanced settings tab
Setting |
Description |
|---|---|
Debug |
Ths switch enables resource logging. The toggle switch is turned off by default. |
Buffer size |
Buffer size in bytes for accumulating events in the RAM of the server before sending them for further processing or storage. The value must be a positive integer. Default buffer size: 1,048,576 bytes (1 MB). Maximum buffer size: 67,108,864 bytes (64 MB). |
Number of handlers |
Number of handlers that the service can run simultaneously to process response rules in parallel. To determine the number of handlers, you can use the following formula: (<number of CPUs> / 2) + 2. The value must be a positive integer. |
Character encoding |
Character encoding. The default is UTF-8. |
Event buffer TTL |
Buffer lifetime for auditd event lines, in milliseconds. Auditd event lines enter the KUMA collector and accumulate in the buffer. This allows multiple auditd event lines to be grouped into a single auditd event. The buffer lifetime countdown begins when the first auditd event line is received or when the previous buffer lifetime expires. Possible values: from 50 to 30,000. The default value is This field is available if you have enabled the Auditd toggle switch on the Basic settings tab. The auditd event lines accumulated in the buffer are kept in the RAM of the server. We recommend caution when increasing the buffer size because memory usage by the KUMA collector may become excessive. You can see how much server RAM the KUMA collector is using in KUMA metrics. If you want a buffer lifetime to exceed 30,000 milliseconds, we recommend using a different auditd event transport. For example, you can use an agent or pre-accumulate auditd events in a file, and then process this file with the KUMA collector. |
Transport header |
Regular expression for auditd events, which is used to identify auditd event lines. You can use the default value or edit it. The regular expression must contain the You can revert to the default regular expression for auditd events by clicking Reset to default value. |
Compression |
Drop-down list for configuring Snappy compression:
|
Connector, netflow type
Connectors of the netflow typeUsed for passively receiving events in the NetFlow format. Settings for a connector of the netflow type are described in the following tables.
Basic settings tab
Setting |
Description |
|---|---|
Name |
Unique name of the resource. The maximum length of the name is 128 Unicode characters. Required setting. |
Tenant |
The name of the tenant that owns the resource. Required setting. |
Type |
Connector type: netflow. Required setting. |
Tags |
Tags for resource search. Optional setting. |
URL |
URL that you want to connect to. The following URL formats are supported:
You can add multiple URLs or remove an URL. To add an URL, click the + Add button. To remove an URL, click the delete Required setting. |
Description |
Description of the resource. The maximum length of the description is 4000 Unicode characters. |
Advanced settings tab
Setting |
Description |
|---|---|
Debug |
Ths switch enables resource logging. The toggle switch is turned off by default. |
Buffer size |
Buffer size in bytes for accumulating events in the RAM of the server before sending them for further processing or storage. The value must be a positive integer. Default buffer size: 1,048,576 bytes (1 MB). Maximum buffer size: 67,108,864 bytes (64 MB). |
Number of handlers |
Number of handlers that the service can run simultaneously to process response rules in parallel. To determine the number of handlers, you can use the following formula: (<number of CPUs> / 2) + 2. The value must be a positive integer. |
Character encoding |
Character encoding. The default is UTF-8. |
Connector, sflow type
Connectors of the sflow typeUsed for passively receiving events in the sFlow format. For sFlow, only structures described in sFlow version 5 are supported. Settings for a connector of the sflow type are described in the following tables.
Basic settings tab
Setting |
Description |
|---|---|
Name |
Unique name of the resource. The maximum length of the name is 128 Unicode characters. Required setting. |
Tenant |
The name of the tenant that owns the resource. Required setting. |
Type |
Connector type: sflow. Required setting. |
URL |
URL that you want to connect to. You can enter a URL in one of the following formats:
Required setting. |
Description |
Description of the resource. The maximum length of the description is 4000 Unicode characters. |
Advanced settings tab
Setting |
Description |
|---|---|
Debug |
Ths switch enables resource logging. The toggle switch is turned off by default. |
Buffer size |
Buffer size in bytes for accumulating events in the RAM of the server before sending them for further processing or storage. The value must be a positive integer. Default buffer size: 1,048,576 bytes (1 MB). Maximum buffer size: 67,108,864 bytes (64 MB). |
Number of handlers |
Number of handlers that the service can run simultaneously to process response rules in parallel. To determine the number of handlers, you can use the following formula: (<number of CPUs> / 2) + 2. The value must be a positive integer. |
Character encoding |
Character encoding. The default is UTF-8. |
Connector, nats-jetstream type
Connectors of the nats-jetstream typeUsed for interacting with a NATS message broker when working with Windows and Linux agents. Settings for a connector of the nats-jetstream type are described in the following tables.
Basic settings tab
Setting |
Description |
|---|---|
Name |
Unique name of the resource. The maximum length of the name is 128 Unicode characters. Required setting. |
Tenant |
The name of the tenant that owns the resource. Required setting. |
Type |
Connector type: nats-jetstream. Required setting. |
Tags |
Tags for resource search. Optional setting. |
URL |
URL that you want to connect to. The following URL formats are supported:
You can add multiple URLs or remove an URL. To add an URL, click the + Add button. To remove an URL, click the delete Required setting. |
Authorization |
Type of authorization when connecting to the URL specified in the URL field:
|
Subject |
The topic of NATS messages. Characters are entered in Unicode encoding. Required setting. |
GroupID. |
The value of the |
Delimiter |
The character that marks the boundary between events:
If you do not select a value in this drop-down list, \n is selected by default. |
Description |
Description of the resource. The maximum length of the description is 4000 Unicode characters. |
Advanced settings tab
Setting |
Description |
|---|---|
Debug |
Ths switch enables resource logging. The toggle switch is turned off by default. |
Buffer size |
Buffer size in bytes for accumulating events in the RAM of the server before sending them for further processing or storage. The value must be a positive integer. Default buffer size: 1,048,576 bytes (1 MB). Maximum buffer size: 67,108,864 bytes (64 MB). |
Number of handlers |
Number of handlers that the service can run simultaneously to process response rules in parallel. To determine the number of handlers, you can use the following formula: (<number of CPUs> / 2) + 2. The value must be a positive integer. |
Character encoding |
Character encoding. The default is UTF-8. |
TLS mode |
TLS encryption mode. When using TLS encryption, you cannot specify an IP address in the URL field on the Basic settings. Available values:
|
Compression |
Drop-down list for configuring Snappy compression:
|
Connector, kafka type
Connectors of the kafka typeUsed for communicating with the Apache Kafka data bus when working with Windows and Linux agents. Settings for a connector of the kafka type are described in the following tables.
Basic settings tab
Setting |
Description |
|---|---|
Name |
Unique name of the resource. The maximum length of the name is 128 Unicode characters. Required setting. |
Tenant |
The name of the tenant that owns the resource. Required setting. |
Type |
Connector type: kafka. Required setting. |
Tags |
Tags for resource search. Optional setting. |
URL |
URL that you want to connect to. The following URL formats are supported:
You can add multiple URLs or remove an URL. To add an URL, click the + Add button. To remove an URL, click the delete Required setting. |
Authorization |
Type of authorization when connecting to the URL specified in the URL field:
|
Topic |
Subject of Kafka messages. The maximum length of the subject is 255 characters. You can use the following characters: a–z, A–Z, 0–9, ".", "_", "-". Required setting. |
GroupID. |
The value of the |
Delimiter |
The character that marks the boundary between events:
If you do not select a value in this drop-down list, \n is selected by default. |
Description |
Description of the resource. The maximum length of the description is 4000 Unicode characters. |
Advanced settings tab
Setting |
Description |
|---|---|
Debug |
Ths switch enables resource logging. The toggle switch is turned off by default. |
Number of handlers |
Number of handlers that the service can run simultaneously to process response rules in parallel. To determine the number of handlers, you can use the following formula: (<number of CPUs> / 2) + 2. The value must be a positive integer. |
Character encoding |
Character encoding. The default is UTF-8. |
TLS mode |
TLS encryption mode. When using TLS encryption, you cannot specify an IP address in the URL field on the Basic settings. Available values:
|
Size of message to fetch |
Size of one message in the request, in bytes. The default value of 16 MB is applied if no value is specified or 0 is specified. |
Maximum fetch wait time |
Timeout for one message in seconds. The default value of 5 seconds is applied if no value is specified or 0 is specified. |
Connection timeout |
Kafka broker connection timeout in seconds. Maximum possible value: 2147483647. The default value is 30 seconds. |
Read timeout |
Read operation timeout in seconds. Maximum possible value: 2147483647. The default value is 30 seconds. |
Write timeout |
Write operation timeout in seconds. Maximum possible value: 2147483647. The default value is 30 seconds. |
Group status update interval |
Group status update interval in seconds Cannot exceed session time. The recommended value is 1/3 of the session time. Maximum possible value: 2147483647. The default value is 30 seconds. |
Session time |
Session time in seconds. Maximum possible value: 2147483647. The default value is 30 seconds. |
Maximum time to process one message |
Maximum time to process one message by a single thread, in milliseconds. Maximum possible value: 2147483647. The default value is 100 milliseconds. |
Enable autocommit |
Enabled by default. |
Autocommit interval |
Autocommit interval in seconds The default value is 1 second. Maximum possible value: 18446744073709551615. Any positive number can be specified. |
Connector, http type
Connectors of the http typeUsed for receiving events over HTTP when working with Windows and Linux agents. Settings for a connector of the http type are described in the following tables.
Basic settings tab
Setting |
Description |
|---|---|
Name |
Unique name of the resource. The maximum length of the name is 128 Unicode characters. Required setting. |
Tenant |
The name of the tenant that owns the resource. Required setting. |
Type |
Connector type: http. Required setting. |
Tags |
Tags for resource search. Optional setting. |
URL |
URL that you want to connect to. You can enter a URL in one of the following formats:
Required setting. |
Delimiter |
The character that marks the boundary between events:
If you do not select a value in this drop-down list, \n is selected by default. |
Description |
Description of the resource. The maximum length of the description is 4000 Unicode characters. |
Advanced settings tab
Setting |
Description |
|---|---|
Debug |
Ths switch enables resource logging. The toggle switch is turned off by default. |
Character encoding |
Character encoding. The default is UTF-8. |
TLS mode |
TLS encryption mode. When using TLS encryption, you cannot specify an IP address in the URL field on the Basic settings. Available values:
|
Connector, sql type
Connectors of the sql typeUsed for querying databases. KUMA supports multiple types of databases. When creating a connector of the sql type, you must specify general connector settings and individual database connection settings. Settings for a connector of the sql type are described in the following tables.
Basic settings tab
Setting |
Description |
|---|---|
Name |
Unique name of the resource. The maximum length of the name is 128 Unicode characters. Required setting. |
Tenant |
The name of the tenant that owns the resource. Required setting. |
Type |
Connector type: sql. Required setting. |
Tags |
Tags for resource search. Optional setting. |
Default query |
SQL query that is executed when connecting to the database. Required setting. |
Reconnect to the database every time a query is sent |
This toggle enables reconnection of the connector to the database every time a query is sent. This toggle switch is turned off by default. |
Poll interval, sec |
Interval for executing SQL queries in seconds. The default value is 10 seconds. |
Connection |
Database connection settings:
You can add multiple connections or delete a connection. To add a connection, click the +Add connection button. To remove a connection, click the delete |
Description |
Description of the resource. The maximum length of the description is 4000 Unicode characters. |
Advanced settings tab
Setting |
Description |
|---|---|
Debug |
Ths switch enables resource logging. The toggle switch is turned off by default. |
Character encoding |
Character encoding. The default is UTF-8. KUMA converts SQL responses to UTF-8 encoding. You can configure the SQL server to send responses in UTF-8 encoding or change the encoding of incoming messages on the KUMA side. |
Within a single connector, you can create a connection for multiple supported databases. If a collector with a connector of the sql type cannot be started, check if the /opt/kaspersky/kuma/collector/<collector ID>/sql/state-<file ID> state file is empty. If the state file is empty, delete it and restart the collector.
Supported SQL types and their specific usage features
The following SQL types are supported:
- MSSQL.
For example:
sqlserver://{user}:{password}@{server:port}/{instance_name}?database={database}
We recommend using this URL variant.
sqlserver://{user}:{password}@{server}?database={database}
The characters
@p1are used as a placeholder in the SQL query.If you want to connect using domain account credentials, specify the account name in
<domain>%5C<user>format. For example:sqlserver://domain%5Cuser:password@ksc.example.com:1433/SQLEXPRESS?database=KAV. - MySQL/MariaDB
For example:
mysql://{user}:{password}@tcp({server}:{port})/{database}The characters
?are used as placeholders in the SQL query. - PostgreSQL.
For example:
postgres://{user}:{password}@{server}/{database}?sslmode=disableThe characters
$1are used as a placeholder in the SQL query. - CockroachDB
For example:
postgres://{user}:{password}@{server}:{port}/{database}?sslmode=disableThe characters
$1are used as a placeholder in the SQL query. - SQLite3
For example:
sqlite3://file:{file_path}A question mark (
?) is used as a placeholder in the SQL query.When querying SQLite3, if the initial value of the ID is in datetime format, you must add a date conversion with the
sqlite datetimefunction to the SQL query. For example:select * from connections where datetime(login_time) > datetime(?, 'utc') order by login_timeIn this example,
connectionsis the SQLite table, and the value of the variable?is taken from the Identity seed field, and it must be specified in the{<date>}T{<time>}Zformat, for example,2021-01-01T00:10:00Z). - Oracle DB
Example URL of a secret with the 'oracle' driver:
oracle://{user}:{password}@{server}:{port}/{service_name}oracle://{user}:{password}@{server}:{port}/?SID={SID_VALUE}If the query execution time exceeds 30 seconds, the oracle driver aborts the SQL request, and the following error appears in the collector log: user requested cancel of current operation. To increase the execution time of an SQL query, specify the value of the timeout parameter in seconds in the connection string, for example:
oracle://{user}:{password}@{server}:{port}/{service_name}?timeout=300The
:valvariable is used as a placeholder in the SQL query.When querying Oracle DB, if the identity seed is in the datetime format, you must consider the type of the field in the database and, if necessary, add conversions of the time string in the SQL query to make sure the SQL connector works correctly. For example, if the
Connectionstable in the database has alogin_timefield, the following conversions are possible:- If the login_time field has the TIMESTAMP type, then depending on the configuration of the database, the login_time field may contain a value in the
YYYY-MM-DD HH24:MI:SSformat, for example,2021-01-01 00:00:00. In this case, you need to specify2021-01-01T00:00:00Zin the Identity seed field, and in the SQL query, perform the conversion using theto_timestampfunction, for example:select * from connections where login_time > to_timestamp(:val, 'YYYY-MM-DD"T"HH24:MI:SS"Z"') - If the login_time field has the TIMESTAMP WITH TIME ZONE type, then depending on the configuration of the database, the login_time field may contain a value in the
YYYY-MM-DD"T"HH24:MI:SSTZH:TZMformat (for example,2021-01-01T00:00:00+03:00). In this case, you need to specify2021-01-01T00:00:00+03:00in the Identity seed field, and in the SQL query, perform the conversion using theto_timestamp_tzfunction, for example:select * from connections_tz where login_time > to_timestamp_tz(:val, 'YYYY-MM-DD"T"HH24:MI:SSTZH:TZM')For details about the
to_timestampandto_timestamp_tzfunctions, please refer to the official Oracle documentation.
To interact with Oracle DB, you must install the libaio1 Astra Linux package.
- If the login_time field has the TIMESTAMP type, then depending on the configuration of the database, the login_time field may contain a value in the
- Firebird SQL
For example:
firebirdsql://{user}:{password}@{server}:{port}/{database}A question mark (
?) is used as a placeholder in the SQL query.If a problem occurs when connecting Firebird on Windows, use the full path to the database file, for example:
firebirdsql://{user}:{password}@{server}:{port}/C:\Users\user\firebird\db.FDB - ClickHouse
When using TLS encryption, by default, the connector works with ClickHouse only on port 9000. If TLS encryption is not used, by default, the connector works with ClickHouse only on port 9440. If TLS encryption mode is configured on the ClickHouse server, and in connector settings, in the TLS mode drop-down list, you have selected Disabled or vice versa, the database connection cannot be established.
If you want to connect to the KUMA ClickHouse, in the SQL connector settings, specify the PublicPki secret type, which contains the base64-encoded PEM private key and the public key.
In the parameters of the SQL connector for the ClickHouse connection type, you need to select Disabled in the TLS mode drop-down list. This value must not be specified if a certificate is used for authentication. If in the TLS mode drop-down list, you select Custom CA, you need to specify the ID of a secret of the 'certificate' type in the Identity column field. You also need to select one of the following values in the Authorization type drop-down list:
- Disabled. If you select this value, you need to leave the Identity column field blank.
- Plain. Select this value if the Secret separately check box is selected and the ID of a secret of the 'credentials' type is specified in the Identity column field.
- PublicPki. Select this value if the Secret separately check box is selected and the ID of a secret of the 'PublicPki' type is specified in the Identity column field.
The Secret separately check box lets you specify the URL separately, not as part of the secret.
A sequential request for database information is supported in SQL queries. For example, if in the Query field, you enter select * from <name of data table> where id > <placeholder>, the value of the Identity seed field is used as the placeholder value the first time you query the table. In addition, the service that utilizes the SQL connector saves the ID of the last read entry, and the ID of this entry will be used as the placeholder value in the next query to the database.
Connector, file type
Connectors of the file typeUsed for getting data from text files when working with Windows and Linux agents. One line of a text file is considered to be one event. \n is used as the newline character.
If while creating the collector at the Transport step of the installation wizard, you specified a connector of the file type, at the Event parsing in the Mapping table, you can pass the name of the file being processed by the collector or the path to the file in the KUMA event field. To do this, in the Source column, specify one of the following values:
$kuma_fileSourceNameto pass the name of the file being processed by the collector in the KUMA event field.$kuma_fileSourcePathto pass the path to the file being processed by the collector in the KUMA event field.
When you use a file connector, the new variables in the normalizer will only work with destinations of the internal type.
To read Windows files, you need to create a connector of the file type and manually install the agent on Windows. The Windows agent must not read its files in the folder where the agent is installed. The connector will work even with a FAT file system; if the disk is defragmented, the connector re-reads all files from scratch because all inodes of files are reset.
We do not recommend running the agent under an administrator account; read permissions for folders/files must be configured for the user account of the agent. We do not recommend installing the agent on important systems; it is preferable to send the logs and read them on dedicated hosts with the agent.
For each file that the connector of the file type interacts with, a state file (states.ini) is created with the offset, dev, inode, and filename parameters. The state file allows the connector, to resume reading from the position where the connector last stopped instead of starting over when rereading the file. Some special considerations are involved in rereading files:
- If the
inodeparameter in the state file changes, the connector rereads the corresponding file from the beginning. When the file is deleting and recreated, theinodesetting in the associated state file may remain unchanged. In this case, when rereading the file, the connector resumes reading in accordance with theoffsetparameter. - If the file has been truncated or its size has become smaller, the connector start reading from the beginning.
- If the file has been renamed, when rereading the file, the connector resumes reading from the position where the connector last stopped.
- If the directory with the file has been remounted, when rereading the file, the connector resumes reading from the position where the connector last stopped. You can specify the path to the files with which the connector interacts when configuring the connector in the File path field.
Settings for a connector of the file type are described in the following tables.
Basic settings tab
Setting |
Description |
|---|---|
Name |
Unique name of the resource. The maximum length of the name is 128 Unicode characters. Required setting. |
Tenant |
The name of the tenant that owns the resource. Required setting. |
Type |
Connector type: file. Required setting. |
Tags |
Tags for resource search. Optional setting. |
Path to the file. |
The full path to the file that the connector interacts with. For example,
File and folder mask templates Limitations when using prefixes in file paths Limiting the number of files for watching by mask Required setting. |
Modification timeout, sec |
The time in seconds for which the file must not be updated for KUMA to apply the action specified in the Action after timeout drop-down list to the file. Default value: The entered value must not be less than the value that you entered on the Advanced settings in the Poll interval, sec field. |
Action after timeout |
The action that KUMA applies to the file after the time specified in the Modification timeout, sec:
|
Auditd |
This toggle switch enables the auditd mechanism to group auditd event lines received from the connector into an auditd event. If you enable this toggle switch, you cannot select a value in the Delimiter drop-down list because \n is automatically selected for the auditd mechanism. If you enable this toggle switch in the connector settings of the agent, you need to select \n in the Delimiter drop-down list in the connector settings of the collector to which the agent sends events. The maximum size of a grouped auditd event is approximately 4,174,304 characters. |
Description |
Description of the resource. The maximum length of the description is 4000 Unicode characters. |
Advanced settings tab
Setting |
Description |
|---|---|
Debug |
Ths switch enables resource logging. The toggle switch is turned off by default. |
Buffer size |
Buffer size in bytes for accumulating events in the RAM of the server before sending them for further processing or storage. The value must be a positive integer. Default buffer size: 1,048,576 bytes (1 MB). Maximum buffer size: 67,108,864 bytes (64 MB). |
Number of handlers |
Number of handlers that the service can run simultaneously to process response rules in parallel. To determine the number of handlers, you can use the following formula: (<number of CPUs> / 2) + 2. The value must be a positive integer. |
File/folder polling mode |
Specifies how the connector rereads files in the directory:
|
Poll interval, ms |
The interval in milliseconds at which the connector rereads files in the directory. Default value: The entered value must not be less than the value that you entered on the Basic settings in the Modification timeout, sec field. We recommend entering a value less than the value that you entered in the Event buffer TTL field because this may adversely affect the performance of Auditd. |
Character encoding |
Character encoding. The default is UTF-8. |
Event buffer TTL |
Buffer lifetime for auditd event lines, in milliseconds. Auditd event lines enter the KUMA collector and accumulate in the buffer. This allows multiple auditd event lines to be grouped into a single auditd event. The buffer lifetime countdown begins when the first auditd event line is received or when the previous buffer lifetime expires. Possible values: 700 to 30,000. The default value is This field is available if you have enabled the Auditd toggle switch on the Basic settings tab. The auditd event lines accumulated in the buffer are kept in the RAM of the server. We recommend caution when increasing the buffer size because memory usage by the KUMA collector may become excessive. You can see how much server RAM the KUMA collector is using in KUMA metrics. If you want a buffer lifetime to exceed 30,000 milliseconds, we recommend using a different auditd event transport. For example, you can use an agent or pre-accumulate auditd events in a file, and then process this file with the KUMA collector. |
Transport header |
Regular expression for auditd events, which is used to identify auditd event lines. You can use the default value or edit it. The regular expression must contain the You can revert to the default regular expression for auditd events by clicking Reset to default value. |
Connector, 1c-log type
Connectors with the 1c-log typeUsed for getting data from 1C technology logs when working with Linux agents. \n is used as the newline character. The connector accepts only the first line from a multi-line event record.
Settings for a connector of the 1c-log type are described in the following tables.
Basic settings tab
Setting |
Description |
|---|---|
Name |
Unique name of the resource. The maximum length of the name is 128 Unicode characters. Required setting. |
Tenant |
The name of the tenant that owns the resource. Required setting. |
Type |
Connector type: 1c-log. Required setting. |
Tags |
Tags for resource search. Optional setting. |
Directory path |
The full path to the directory with the files that you want to interact with, for example, Limitations when using prefixes in file paths Required setting. |
Description |
Description of the resource. The maximum length of the description is 4000 Unicode characters. |
Advanced settings tab
Setting |
Description |
|---|---|
Debug |
Ths switch enables resource logging. The toggle switch is turned off by default. |
Buffer size |
Buffer size in bytes for accumulating events in the RAM of the server before sending them for further processing or storage. The value must be a positive integer. Default buffer size: 1,048,576 bytes (1 MB). Maximum buffer size: 67,108,864 bytes (64 MB). |
File/folder polling mode |
Specifies how the connector rereads files in the directory:
|
Poll interval, ms |
The interval in milliseconds at which the connector rereads files in the directory. Default value: |
Character encoding |
Buffer size in bytes for accumulating events in the RAM of the server before sending them for further processing or storage. The value must be a positive integer. Default buffer size: 1,048,576 bytes (1 MB). Maximum buffer size: 67,108,864 bytes (64 MB). |
Connector operation diagram:
- All 1C technology log files are searched. Log file requirements:
- Files with the LOG extension are created in the log directory (
/var/log/1c/logs/by default) within a subdirectory for each process.Example of a supported 1C technology log structure
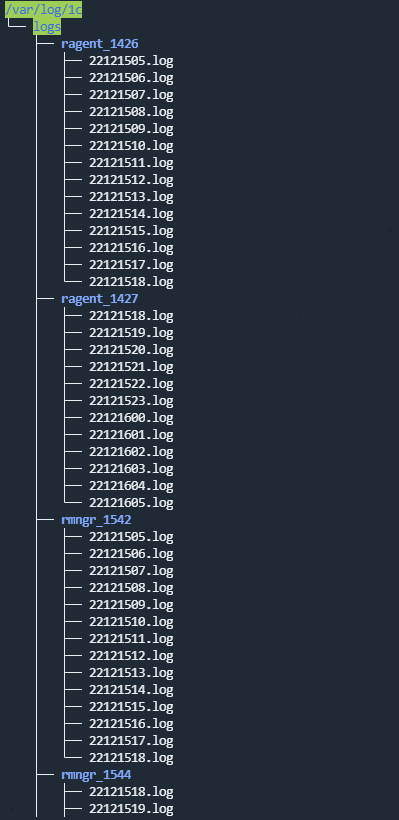
- Events are logged to a file for an hour; after that, the next log file is created.
- The file names have the following format: <YY><MM><DD><HH>.log. For example, 22111418.log is a file created in 2022, in the 11th month, on the 14th at 18:00.
- Each event starts with the event time in the following format: <mm>:<ss>.<microseconds>-<duration in microseconds>.
- Files with the LOG extension are created in the log directory (
- The processed files are discarded. Information about processed files is stored in the file /<collector working directory>/1c_log_connector/state.json.
- Processing of the new events starts, and the event time is converted to the RFC3339 format.
- The next file in the queue is processed.
Connector limitations:
- Installation of a collector with a 1c-log connector is not supported in a Windows operating system. To set up transfer of 1C log files for processing by the KUMA collector:
- On the Windows server, grant read access over the network to the folder with the 1C log files.
- On the Linux server, mount the shared folder with the 1C log files on the Windows server (see the list of supported operating systems).
- On the Linux server, install the collector that you want to process 1C log files from the mounted shared folder.
- Only the first line from a multi-line event record is processed.
- The normalizer processes only the following types of events:
- ADMIN
- ATTN
- CALL
- CLSTR
- CONN
- DBMSSQL
- DBMSSQLCONN
- DBV8DBENG
- EXCP
- EXCPCNTX
- HASP
- LEAKS
- LIC
- MEM
- PROC
- SCALL
- SCOM
- SDBL
- SESN
- SINTEG
- SRVC
- TLOCK
- TTIMEOUT
- VRSREQUEST
- VRSRESPONSE
Connector, 1c-xml type
Connectors with the 1c-xml typeUsed for getting data from 1C registration logs when working with Linux agents. When the connector handles multi-line events, it converts them into single-line events.
Settings for a connector of the 1c-xml type are described in the following tables.
Basic settings tab
Setting |
Description |
|---|---|
Name |
Unique name of the resource. The maximum length of the name is 128 Unicode characters. Required setting. |
Tenant |
The name of the tenant that owns the resource. Required setting. |
Type |
Connector type: 1c-xml. Required setting. |
Tags |
Tags for resource search. Optional setting. |
Directory path |
The full path to the directory with the files that you want to interact with, for example, Limitations when using prefixes in file paths Required setting. |
Description |
Description of the resource. The maximum length of the description is 4000 Unicode characters. |
Advanced settings tab
Setting |
Description |
|---|---|
Debug |
Ths switch enables resource logging. The toggle switch is turned off by default. |
Buffer size |
Buffer size in bytes for accumulating events in the RAM of the server before sending them for further processing or storage. The value must be a positive integer. Default buffer size: 1,048,576 bytes (1 MB). Maximum buffer size: 67,108,864 bytes (64 MB). |
File/folder polling mode |
Specifies how the connector rereads files in the directory:
|
Poll interval, ms |
The interval in milliseconds at which the connector rereads files in the directory. Default value: |
Character encoding |
Character encoding. The default is UTF-8. |
Connector operation diagram:
- The files containing 1C logs with the XML extension are searched within the specified directory. Logs are placed in the directory either manually or using an application written in the 1C language, for example, using the
ВыгрузитьЖурналРегистрации()function. The connector only supports logs received this way. For more information on how to obtain 1C logs, see the official 1C documentation. - Files are sorted by the last modification time in ascending order. All the files modified before the last read are discarded.
Information about processed files is stored in the file /<collector working directory>/1c_xml_connector/state.ini and has the following format: "offset=<number>\ndev=<number>\ninode=<number>".
- Events are defined in each unread file.
- Events from the file are processed one by one. Multi-line events are converted to single-line events.
Connector limitations:
- Installation of a collector with a 1c-xml connector is not supported in a Windows operating system. To set up transfer of 1C log files for processing by the KUMA collector:
- On the Windows server, grant read access over the network to the folder with the 1C log files.
- On the Linux server, mount the shared folder with the 1C log files on the Windows server (see the list of supported operating systems).
- On the Linux server, install the collector that you want to process 1C log files from the mounted shared folder.
- Files with an incorrect event format are not read. For example, if event tags in the file are in Russian, the collector does not read such events.
Example of a correct XML file with an event.
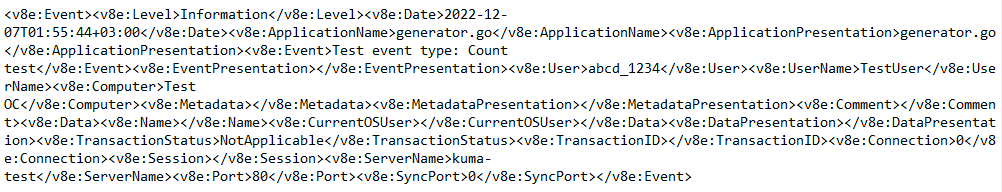
- If a file read by the connector is enriched with the new events and if this file is not the last file read in the directory, all events from the file are processed again.
Connector, diode type
Connectors of the diode typeUsed for unidirectional data transmission in industrial ICS networks using data diodes. Settings for a connector of the diode type are described in the following tables.
Basic settings tab
Setting |
Description |
|---|---|
Name |
Unique name of the resource. The maximum length of the name is 128 Unicode characters. Required setting. |
Tenant |
The name of the tenant that owns the resource. Required setting. |
Type |
Connector type: diode. Required setting. |
Tags |
Tags for resource search. Optional setting. |
Directory with events from the data diode |
Full path to the directory on the KUMA collector server, into which the data diode moves files with events from the isolated network segment. After the connector has read these files, the files are deleted from the directory. Maximum length of the path: 255 Unicode characters. Limitations when using prefixes in paths Required setting. |
Delimiter |
The character that marks the boundary between events:
If you do not select a value in this drop-down list, \n is selected by default. You must select the same value in the Delimiter drop-down list in the settings of the connector and the destination being used to transmit events from the isolated network segment using a data diode. |
Description |
Description of the resource. The maximum length of the description is 4000 Unicode characters. |
Advanced settings tab
Setting |
Description |
|---|---|
Debug |
Ths switch enables resource logging. The toggle switch is turned off by default. |
Number of handlers |
Number of handlers that the service can run simultaneously to process response rules in parallel. To determine the number of handlers, you can use the following formula: (<number of CPUs> / 2) + 2. The value must be a positive integer. |
Poll interval, sec |
Interval at which the files are read from the directory containing events from the data diode. The default value is 2 seconds. |
Character encoding |
Character encoding. The default is UTF-8. |
Compression |
Drop-down list for configuring Snappy compression:
You must select the same value in the Snappy drop-down list in the settings of the connector and the destination being used to transmit events from the isolated network segment using a data diode. |
Connector, ftp type
Connectors of the ftp typeUsed for getting data over File Transfer Protocol (FTP) when working with Windows and Linux agents. Settings for a connector of the ftp type are described in the following tables.
Basic settings tab
Setting |
Description |
|---|---|
Name |
Unique name of the resource. The maximum length of the name is 128 Unicode characters. Required setting. |
Tenant |
The name of the tenant that owns the resource. Required setting. |
Type |
Connector type: ftp. Required setting. |
Tags |
Tags for resource search. Optional setting. |
URL |
URL of file or file mask that begins with the If the URL does not contain the port number of the FTP server, port Required setting. |
Secret |
|
Description |
Description of the resource. The maximum length of the description is 4000 Unicode characters. |
Advanced settings tab
Setting |
Description |
|---|---|
Debug |
Ths switch enables resource logging. The toggle switch is turned off by default. |
Character encoding |
Character encoding. The default is UTF-8. |
Connector, nfs type
Connectors of the nfs typeUsed for getting data over Network File System (NFS) when working with Windows and Linux agents. Settings for a connector of the nfs type are described in the following tables.
Basic settings tab
Setting |
Description |
|---|---|
Name |
Unique name of the resource. The maximum length of the name is 128 Unicode characters. Required setting. |
Tenant |
The name of the tenant that owns the resource. Required setting. |
Type |
Connector type: nfs. Required setting. |
Tags |
Tags for resource search. Optional setting. |
URL |
Path to the remote directory in the Required setting. |
File name mask |
A mask used to filter files containing events. The following wildcards are acceptable " |
Poll interval, sec |
Poll interval in seconds. The time interval after which files are re-read from the remote system. The default value is |
Description |
Description of the resource. The maximum length of the description is 4000 Unicode characters. |
Advanced settings tab
Setting |
Description |
|---|---|
Debug |
Ths switch enables resource logging. The toggle switch is turned off by default. |
Character encoding |
Character encoding. The default is UTF-8. |
Connector, wmi type
Connectors of the wmi typeUsed for getting data using Windows Management Instrumentation when working with Windows agents. Settings for a connector of the wmi type are described in the following tables.
Basic settings tab
Setting |
Description |
|---|---|
Name |
Unique name of the resource. The maximum length of the name is 128 Unicode characters. Required setting. |
Tenant |
The name of the tenant that owns the resource. Required setting. |
Type |
Connector type: wmi. Required setting. |
Tags |
Tags for resource search. Optional setting. |
Description |
Description of the resource. The maximum length of the description is 4000 Unicode characters. |
URL |
URL of the collector that you created to receive data using Windows Management Instrumentation, for example, When a collector is created, an agent is automatically created that will get data on the remote device and forward it to the collector service. If you know which server the collector service will be installed on, the URL is known in advance. You can enter the URL of the collector in the URL field after completing the installation wizard. To do so, you first need to copy the URL of the collector in the Resources → Active services section. Required setting. |
Default credentials |
No value. You need to specify credentials for connecting to hosts in the Remote hosts table. |
Remote hosts |
Settings of remote Windows devices to connect to.
You can add multiple remote Windows devices or remove a remote Windows device. To add a remote Windows device, click +Add. To remove a remote Windows device, select the check box next to it and click Delete. |
Advanced settings tab
Setting |
Description |
|---|---|
Debug |
Ths switch enables resource logging. The toggle switch is turned off by default. |
Character encoding |
Character encoding. The default is UTF-8. |
TLS mode |
TLS encryption mode. When using TLS encryption, you cannot specify an IP address in the URL field on the Basic settings. Available values:
|
Compression |
Drop-down list for configuring Snappy compression:
|
If you edit a connector of this type, the TLS mode and Compression settings are visible and available on the connector resource as well as the collector. If you are using a connector of this type on a collector, the values of TLS mode and Compression settings are sent to the destination of automatically created agents.
Receiving events from a remote device
Conditions for receiving events from a remote Windows device hosting a KUMA agent:
- To start the KUMA agent on the remote device, you must use an account with the “Log on as a service” permissions.
- To receive events from the KUMA agent, you must use an account with Event Log Readers permissions. For domain servers, one such user account can be created so that a group policy can be used to distribute its rights to read logs to all servers and workstations in the domain.
- TCP ports 135, 445, and 49152–65535 must be opened on the remote Windows devices.
- You must run the following services on the remote machines:
- Remote Procedure Call (RPC)
- RPC Endpoint Mapper
Connector, wec type
Connectors of the wec typeUsed for getting data using Windows Event Forwarding (WEF) and Windows Event Collector (WEC), or local operating system logs of a Windows host when working with Windows agents. Settings for a connector of the wec type are described in the following tables.
Basic settings tab
Setting |
Description |
|---|---|
Name |
Unique name of the resource. The maximum length of the name is 128 Unicode characters. Required setting. |
Tenant |
The name of the tenant that owns the resource. Required setting. |
Type |
Connector type: wec. Required setting. |
Tags |
Tags for resource search. Optional setting. |
URL |
URL of the collector that you created to receive data using Windows Event Collector, for example, When a collector is created, an agent is automatically created that will get data on the remote device and forward it to the collector service. If you know which server the collector service will be installed on, the URL is known in advance. You can enter the URL of the collector in the URL field after completing the installation wizard. To do so, you first need to copy the URL of the collector in the Resources → Active services section. Required setting. |
Windows logs |
The names of the Windows logs that you want to get. By default, this drop-down list includes only preconfigured logs, but you can add custom log to the list. To do so, enter the names of the custom logs in the Windows logs field, then press ENTER. KUMA service and resource configurations may require additional changes in order to process custom logs correctly. Preconfigured logs:
If the name of at least one log is specified incorrectly, the agent using the connector does not receive events from any log, even if the names of other logs are correct. |
Description |
Description of the resource. The maximum length of the description is 4000 Unicode characters. |
Advanced settings tab
Setting |
Description |
|---|---|
Debug |
Ths switch enables resource logging. The toggle switch is turned off by default. |
Character encoding |
Character encoding. The default is UTF-8. |
TLS mode |
TLS encryption mode. When using TLS encryption, you cannot specify an IP address in the URL field on the Basic settings. Available values:
|
Compression |
Drop-down list for configuring Snappy compression:
|
If you edit a connector of this type, the TLS mode and Compression settings are visible and available on the connector resource as well as the collector. If you are using a connector of this type on a collector, the values of TLS mode and Compression settings are sent to the destination of automatically created agents.
To start the KUMA agent on the remote device, you must use a service account with the “Log on as a service” permissions. To receive events from the operating system log, the service user account must also have Event Log Readers permissions.
You can create one user account with “Log on as a service” and “Event Log Readers” permissions, and then use a group policy to extend the rights of this account to read the logs to all servers and workstations in the domain.
We recommend that you disable interactive logon for the service account.
Page top
Connector, etw type
Connectors of the etw typeUsed for getting extended logs of DNS servers. Settings for a connector of the etw type are described in the following tables.
Basic settings tab
Setting |
Description |
|---|---|
Name |
Unique name of the resource. The maximum length of the name is 128 Unicode characters. Required setting. |
Tenant |
The name of the tenant that owns the resource. Required setting. |
Type |
Connector type: etw. Required setting. |
Tags |
Tags for resource search. Optional setting. |
URL |
URL of the DNS server. Required setting. |
Session name |
Session name that corresponds to the ETW provider: Microsoft-Windows-DNSServer {EB79061A-A566-4698-9119-3ED2807060E7}. If in a connector of the etw type, the session name is specified incorrectly, an incorrect provider is specified in the session, or an incorrect method is specified for sending events (to send events correctly, on the Windows Server side, you must specify "Real time" or "File and Real time" mode), events will not arrive from the agent, an error will be recorded in the agent log on Windows, and the status of the agent will be green. At the same time, no attempt will be made to get events every 60 seconds. If you modify session settings on the Windows side, you must restart the etw agent and/or the session for the changes to take effect. For details about specifying session settings on the Windows side to receive DNS server events, see the Configuring receipt of DNS server events using the ETW agent section. Required setting. |
Extract event information |
This toggle switch enables the extraction of the minimum set of event information that can be obtained without having to download third-party metadata from the disk. This method helps conserve CPU resources on the computer with the agent. By default, this toggle switch is enabled and all event data is extracted. |
Extract event properties |
This toggle switch enables the extraction of event properties. If this toggle switch is disabled, event properties are not extracted, which helps save CPU resources on the machine with the agent. By default, this toggle switch is enabled and event properties are extracted. You can enable the Extract event properties switch only if the Extract event information toggle switch is enabled. |
Description |
Description of the resource. The maximum length of the description is 4000 Unicode characters. |
Advanced settings tab
Setting |
Description |
|---|---|
Debug |
Ths switch enables resource logging. The toggle switch is turned off by default. |
Character encoding |
Character encoding. The default is UTF-8. |
TLS mode |
TLS encryption mode. When using TLS encryption, you cannot specify an IP address in the URL field on the Basic settings. Available values:
|
Compression |
Drop-down list for configuring Snappy compression:
|
If you edit a connector of this type, the TLS mode and Compression settings are visible and available on the connector resource as well as the collector. If you are using a connector of this type on a collector, the values of TLS mode and Compression settings are sent to the destination of automatically created agents.
Page top
Connector, snmp type
Connectors of the snmp typeUsed for getting data over Simple Network Management Protocol (SNMP) when working with Windows and Linux agents. To process events received over SNMP, you must use the json normalizer. Supported SNMP versions:
- snmpV1
- snmpV2
- snmpV3
Only one snmp connector created in the agent settings can be used in an agent. If you need to use multiple snmp connectors, you must create one or all snmp connectors as a separate resource and select it in the connection settings.
Available settings for a connector of the snmp type are described in the following tables.
Basic settings tab
Setting |
Description |
|---|---|
Name |
Unique name of the resource. The maximum length of the name is 128 Unicode characters. Required setting. |
Tenant |
The name of the tenant that owns the resource. Required setting. |
Type |
Connector type: snmp. Required setting. |
Tags |
Tags for resource search. Optional setting. |
Description |
Description of the resource. The maximum length of the description is 4000 Unicode characters. |
SNMP resource |
Settings for connecting to an SNMP resource:
You can add multiple connections to SNMP resources or delete an SNMP resource connection. To create a connection to an SNMP resource, click the + SNMP resource button. To delete a connection to an SNMP resource, click the delete |
Settings |
Rules for naming the received data, according to which OIDs (object identifiers) are converted to the keys with which the normalizer can interact. Available settings:
You can do the following with rules:
|
Advanced settings tab
Setting |
Description |
|---|---|
Debug |
Ths switch enables resource logging. The toggle switch is turned off by default. |
Character encoding |
Character encoding. The default is UTF-8. |
Connector, snmp-trap type
Connectors of the snmp-trap typeUsed for passively receiving events using SNMP traps when working with Windows and Linux agents. The connector receives snmp-trap events and prepares them for normalization by mapping SNMP object IDs to temporary keys. Then the message is passed to the JSON normalizer, where the temporary keys are mapped to the KUMA fields and an event is generated. To process events received over SNMP, you must use the json normalizer. Supported SNMP versions:
- snmpV1
- snmpV2
Settings for a connector of the snmp-trap type are described in the following tables.
Basic settings tab
Setting |
Description |
|---|---|
Name |
Unique name of the resource. The maximum length of the name is 128 Unicode characters. Required setting. |
Tenant |
The name of the tenant that owns the resource. Required setting. |
Type |
Connector type: snmp-trap. Required setting. |
Tags |
Tags for resource search. Optional setting. |
Description |
Description of the resource. The maximum length of the description is 4000 Unicode characters. |
SNMP resource |
Connection settings for receiving snmp-trap events:
You can add multiple connections or delete a connection. To add a connection, click the + SNMP resource button. To remove a SNMP resource, click the delete |
Settings |
Rules for naming the received data, according to which OIDs (object identifiers) are converted to the keys with which the normalizer can interact. Available settings:
You can do the following with rules:
|
Advanced settings tab
Setting |
Description |
|---|---|
Debug |
Ths switch enables resource logging. The toggle switch is turned off by default. |
Character encoding |
Character encoding. The default is UTF-8. When receiving snmp-trap events from Windows with Russian localization, if you encounter invalid characters in the event, we recommend changing the character encoding in the snmp-trap connector to Windows 1251. |
Configuring a Windows device to send SNMP trap messages to the KUMA collector proceeds in stages:
- Configuring and starting the SNMP and SNMP trap services
- Configuring the Event to Trap Translator service
Events from the source of SNMP trap messages must be received by the KUMA collector, which uses a connector of the snmp-trap type and a json normalizer.
To configure and start the SNMP and SNMP trap services in Windows 10:
- Open Settings → Apps → Apps and features → Optional features → Add feature → Simple Network Management Protocol (SNMP) and click Install.
- Wait for the installation to complete and restart your computer.
- Make sure that the SNMP service is running. If any of the following services are not running, enable them:
- Services → SNMP Service.
- Services → SNMP Trap.
- Right-click Services → SNMP Service, and in the context menu select Properties. Specify the following settings:
- On the Log On tab, select the Local System account check box.
- On the Agent tab, fill in the Contact (for example, specify
User-win10) and Location (for example, specifydetroit) fields. - On the Traps tab:
- In the Community Name field, enter community public and click Add to list.
- In the Trap destination field, click Add, specify the IP address or host of the KUMA server on which the collector that waits for SNMP events is deployed, and click Add.
- On the Security tab:
- Select the Send authentication trap check box.
- In the Accepted community names table, click Add, enter Community Name public and specify READ WRITE as the Community rights.
- Select the Accept SNMP packets from any hosts check box.
- Click Apply and confirm your selection.
- Right click Services → SNMP Service and select Restart.
To configure and start the SNMP and SNMP trap services in Windows XP:
- Open Start → Control Panel → Add or Remove Programs → Add / Remove Windows Components → Management and Monitoring Tools → Details.
- Select Simple Network Management Protocol and WMI SNMP Provider, and then click OK → Next.
- Wait for the installation to complete and restart your computer.
- Make sure that the SNMP service is running. If any of the following services are not running, enable them by setting the Startup type to Automatic:
- Services → SNMP Service.
- Services → SNMP Trap.
- Right-click Services → SNMP Service, and in the context menu select Properties. Specify the following settings:
- On the Log On tab, select the Local System account check box.
- On the Agent tab, fill in the Contact (for example, specify
User-win10) and Location (for example, specifydetroit) fields. - On the Traps tab:
- In the Community Name field, enter community public and click Add to list.
- In the Trap destination field, click Add, specify the IP address or host of the KUMA server on which the collector that waits for SNMP events is deployed, and click Add.
- On the Security tab:
- Select the Send authentication trap check box.
- In the Accepted community names table, click Add, enter Community Name public and specify READ WRITE as the Community rights.
- Select the Accept SNMP packets from any hosts check box.
- Click Apply and confirm your selection.
- Right click Services → SNMP Service and select Restart.
Changing the port for the SNMP trap service
You can change the SNMP trap service port if necessary.
To change the port of the SNMP trap service:
- Open the C:\Windows\System32\drivers\etc folder.
- Open the services file in Notepad as an administrator.
- In the service name section of the file, specify the snmp-trap connector port added to the KUMA collector for the SNMP trap service.
- Save the file.
- Open the Control Panel and select Administrative Tools → Services.
- Right-click SNMP Service and select Restart.
To configure the Event to Trap Translator service that translates Windows events to SNMP trap messages:
- In the command line, type
evntwinand press Enter. - Under Configuration type, select Custom, and click the Edit button.
- In the Event sources group of settings, use the Add button to find and add the events that you want to send to KUMA collector with the SNMP trap connector installed.
- Click the Settings button, in the opened window, select the Don't apply throttle check box, and click OK.
- Click Apply and confirm your selection.
Connector, kata/edr type
Connectors of the kata/edr typeUsed for getting KEDR data via the API. Settings for a connector of the kata/edr type are described in the following tables.
Basic settings tab
Setting |
Description |
|---|---|
Name |
Unique name of the resource. The maximum length of the name is 128 Unicode characters. Required setting. |
Tenant |
The name of the tenant that owns the resource. Required setting. |
Type |
Connector type: kata/edr. Required setting. |
Tags |
Tags for resource search. Optional setting. |
URL |
URL that you want to connect to. The following URL formats are supported:
You can add multiple URLs or remove an URL. To add an URL, click the + Add button. To remove an URL, click the delete Required setting. |
Secret |
Secret that stores the credentials for connecting to the KATA/EDR server. You can select an existing secret or create a new secret. To create a new secret, select Create new. If you want to edit the settings of an existing secret, click the pencil Required setting. |
External ID |
Identifier for external systems. KUMA automatically generates an ID and populates this field with it. |
Description |
Description of the resource. The maximum length of the description is 4000 Unicode characters. |
Advanced settings tab
Setting |
Description |
|---|---|
Debug |
Ths switch enables resource logging. The toggle switch is turned off by default. |
Character encoding |
Character encoding. We only recommend configuring a conversion if you find invalid characters in the fields of the normalized event. By default, no value is selected. |
Number of events |
Maximum number of events in one request. By default, the value set on the KATA/EDR server is used. |
Events fetch timeout |
The time in seconds to wait for receipt of events from the KATA/EDR server. Default value: |
Client timeout |
Time in seconds to wait for a response from the KATA/EDR server. Default value: |
KEDRQL filter |
Filter of requests to the KATA/EDR server. For more details on the query language, please refer to the KEDR Help. |
Connector, vmware type
Connectors of the vmware typeUsed for getting VMware vCenter data via the API. Settings for a connector of the vmware type are described in the following tables.
Basic settings tab
Setting |
Description |
|---|---|
Name |
Unique name of the resource. The maximum length of the name is 128 Unicode characters. Required setting. |
Tenant |
The name of the tenant that owns the resource. Required setting. |
Type |
Connector type: vmware. Required setting. |
Tags |
Tags for resource search. Optional setting. |
URL |
URL of the VMware API. You need to include the hostname and port number in the URL. You can only specify one URL. Required setting. |
VMware credentials |
Secret that stores the user name and password for connecting to the VMware API. You can select an existing secret or create a new secret. To create a new secret, select Create new. If you want to edit the settings of an existing secret, click the pencil Required setting. |
Client timeout |
Time to wait after a request that did not return events before making a new request. The default value is 5 seconds. If you specify |
Maximum number of events |
Number of events requested from the VMware API in one request. The default value is |
Start timestamp |
Starting date and time from which you want to read events from the VMware API. By default, events are read from the VMware API from the time when the collector was started. If started after the collector is stopped, the events are read from the last saved date. |
Description |
Description of the resource. The maximum length of the description is 4000 Unicode characters. |
Advanced settings tab
Setting |
Description |
|---|---|
Debug |
Ths switch enables resource logging. The toggle switch is turned off by default. |
Character encoding |
Character encoding. The default is UTF-8. |
TLS mode |
TLS encryption mode. When using TLS encryption, you cannot specify an IP address in the URL field on the Basic settings. Available values:
|
Connector, elastic type
Connectors of the elastic typeUsed for getting Elasticsearch data. Elasticsearch version 7.0.0 is supported. Settings for a connector of the elastic type are described in the following tables.
Basic settings tab
Setting |
Description |
|---|---|
Name |
Unique name of the resource. The maximum length of the name is 128 Unicode characters. Required setting. |
Tenant |
The name of the tenant that owns the resource. Required setting. |
Type |
Connector type: elastic. Required setting. |
Tags |
Tags for resource search. Optional setting. |
Connection |
Elasticsearch server connection settings:
You can add multiple connections to an Elasticsearch server resources or delete an Elasticsearch server connection. To add an Elasticsearch server connection, click the + Add connection button. To delete an Elasticsearch server connection, click the delete |
Description |
Description of the resource. The maximum length of the description is 4000 Unicode characters. |
Advanced settings tab
Setting |
Description |
|---|---|
Debug |
Ths switch enables resource logging. The toggle switch is turned off by default. |
Character encoding |
Character encoding. The default is UTF-8. |
Connector, office365 type
Connectors of the office365 type are used for receiving Microsoft 365 (Office 365) data via the API.
Available settings for a connector of the office365 type are described in the following tables.
Basic settings tab
Setting |
Description |
|---|---|
Name |
Unique name of the resource. The maximum length of the name is 128 Unicode characters. Required setting. |
Tenant |
The name of the tenant that owns the resource. Required setting. |
Type |
Connector type: office365. Required setting. |
Tags |
Tags for resource search. Optional setting. |
Office365 content types |
Content types that you want to receive in KUMA. The following content types are available, providing information about actions and events in Microsoft 365, grouped by information source:
You can find detailed information about the properties of the available content types and related events in the schema on the Microsoft website. Required setting. You can select one or more content types. |
Office365 tenant ID |
Unique ID that you get after registering an account with Microsoft 365. If you do not have one, contact your administrator or Microsoft. Required setting. |
Office365 client ID |
Unique ID that you get after registering an account with Microsoft 365. If you do not have one, contact your administrator or Microsoft. Required setting. |
Authorization |
Authorization method for connecting to Microsoft 365. The following authorization methods are available:
For more information, see the section on secrets. |
Office365 credentials |
The field becomes available after selecting the authorization method. You can select one of the available authorization secrets or create a new secret of the selected type. Required setting. |
Description |
Description of the resource. The maximum length of the description is 4000 Unicode characters. |
Advanced settings tab
Setting |
Description |
|---|---|
Debug |
Ths switch enables resource logging. The toggle switch is turned off by default. |
Character encoding |
Character encoding. The default is UTF-8. |
Authentication host |
The URL that is used for connection and authorization. By default, a connection is made to https://login.microsoftonline.com. |
Resource host |
URL from which the events are to be received. The default address is https://manage.office.com. |
Retrospective analysis interval, hours |
The period for which all new events are requested, in hours. To avoid losing some events, it is important to set overlapping event reception intervals, because some types of Microsoft 365 content may be sent with a delay. In this case, previously received events are not duplicated. By default, all new events for the last 12 hours are requested. |
Request timeout, sec |
Time to wait for a response to a request to get new events, in seconds. The default response timeout is 30 seconds. |
Repeat interval, sec |
The time in seconds after which a failed request to get new events must be repeated. By default, a request to get new events is repeated 10 seconds after getting an error or no response within the specified timeout. |
Clear interval, sec |
How often obsolete data is deleted, in seconds. The minimum value is 300 seconds. By default, obsolete data is deleted every 1800 seconds. |
Poll interval, min |
How often requests for new events are sent, in minutes. By default, requests are sent every 10 minutes. |
Proxy server |
Proxy settings, if necessary to connect to Microsoft 365. You can select one of the available proxy servers or create a new proxy server. |
Predefined connectors
The connectors listed in the table below are included in the KUMA distribution kit.
Predefined connectors
Connector name |
Comment |
[OOTB] Continent SQL |
Obtains events from the database of the Continent hardware and software encryption system. To use it, you must configure the settings of the corresponding secret type. |
[OOTB] InfoWatch Trafic Monitor SQL |
Obtains events from the database of the InfoWatch Traffic Monitor system. To use it, you must configure the settings of the corresponding secret type. |
[OOTB] KSC MSSQL |
Obtains events from the MS SQL database of the Open Single Management Platform system. To use it, you must configure the settings of the corresponding secret type. |
[OOTB] KSC MySQL |
Obtains events from the MySQL database of the Open Single Management Platform system. To use it, you must configure the settings of the corresponding secret type. |
[OOTB] KSC PostgreSQL |
Obtains events from the PostgreSQL database of the Open Single Management Platform 15.0 system. To use it, you must configure the settings of the corresponding secret type. |
[OOTB] Oracle Audit Trail SQL |
Obtains audit events from the Oracle database. To use it, you must configure the settings of the corresponding secret type. |
[OOTB] SecretNet SQL |
Obtains events from the SecretNet SQL database. To use it, you must configure the settings of the corresponding secret type. |
Secrets
Secrets are used to securely store sensitive information such as user names and passwords that must be used by KUMA to interact with external services. If a secret stores account data such as user login and password, when the collector connects to the event source, the account specified in the secret may be blocked in accordance with the password policy configured in the event source system.
Secrets can be used in the following KUMA services and features:
- Collector (when using TLS encryption).
- Connector (when using TLS encryption).
- Destinations (when using TLS encryption or authorization).
- Proxy servers.
Available settings:
- Name (required)—a unique name for this type of resource. Must contain 1 to 128 Unicode characters.
- Tenant (required)—name of the tenant that owns the resource.
- Type (required)—the type of secret.
When you select the type in the drop-down list, the parameters for configuring this secret type also appear. These parameters are described below.
- Description—up to 4,000 Unicode characters.
Depending on the secret type, different fields are available. You can select one of the following secret types:
- credentials—this type of secret is used to store account credentials required to connect to external services, such as SMTP servers. If you select this type of secret, you must fill in the User and Password fields. If the Secret resource uses the 'credentials' type to connect the collector to an event source, for example, a database management system, the account specified in the secret may be blocked in accordance with the password policy configured in the event source system.
- token—this secret type is used to store tokens for API requests. Tokens are used when connecting to IRP systems, for example. If you select this type of secret, you must fill in the Token field.
- ktl—this secret type is used to store Kaspersky Threat Intelligence Portal account credentials. If you select this type of secret, you must fill in the following fields:
- User and Password (required fields)—user name and password of your Kaspersky Threat Intelligence Portal account.
- PFX file (required)—lets you upload a Kaspersky Threat Intelligence Portal certificate key.
- PFX password (required)—the password for accessing the Kaspersky Threat Intelligence Portal certificate key.
- urls—this secret type is used to store URLs for connecting to SQL databases and proxy servers. In the Description field, you must provide a description of the connection for which you are using the secret of urls type.
You can specify URLs in the following formats: hostname:port, IPv4:port, IPv6:port, :port.
- pfx—this type of secret is used for importing a PFX file containing certificates. If you select this type of secret, you must fill in the following fields:
- PFX file (required)—this is used to upload a PFX file. The file must contain a certificate and key. PFX files may include CA-signed certificates for server certificate verification.
- PFX password (required)—this is used to enter the password for accessing the certificate key.
- kata/edr—this type of secret is used to store the certificate file and private key required when connecting to the Kaspersky Endpoint Detection and Response server. If you select this type of secret, you must upload the following files:
- Certificate file—KUMA server certificate.
The file must be in PEM format. You can upload only one certificate file.
- Private key for encrypting the connection—KUMA server RSA key.
The key must be without a password and with the PRIVATE KEY header. You can upload only one key file.
You can generate certificate and key files by clicking the
 button.
- Certificate file—KUMA server certificate.
- snmpV1—this type of secret is used to store the values of Community access (for example,
publicorprivate) that is required for interaction over the Simple Network Management Protocol. - snmpV3—this type of secret is used for storing data required for interaction over the Simple Network Management Protocol. If you select this type of secret, you must fill in the following fields:
- User—user name indicated without a domain.
- Security Level—security level of the user.
- NoAuthNoPriv—messages are forwarded without authentication and without ensuring confidentiality.
- AuthNoPriv—messages are forwarded with authentication but without ensuring confidentiality.
- AuthPriv—messages are forwarded with authentication and ensured confidentiality.
You may see additional settings depending on the selected level.
- Password—SNMP user authentication password. This field becomes available when the AuthNoPriv or AuthPriv security level is selected.
- Authentication Protocol—the following protocols are available: MD5, SHA, SHA224, SHA256, SHA384, SHA512. This field becomes available when the AuthNoPriv or AuthPriv security level is selected.
- Privacy Protocol—protocol used for encrypting messages. Available protocols: DES, AES. This field becomes available when the AuthPriv security level is selected.
- Privacy password—encryption password that was set when the SNMP user was created. This field becomes available when the AuthPriv security level is selected.
- certificate—this secret type is used for storing certificate files. Files are uploaded to a resource by clicking the Upload certificate file button. X.509 certificate public keys in Base64 are supported.
- fingerprint—this type of secret is used to store the Elastic fingerprint value that can be used when connecting to the Elasticsearch server.
- PublicPKI—this type of secret is used to connect a KUMA collector to ClickHouse. If you select this option, you must specify the secret containing the base64-encoded PEM private key and the public key.
Predefined secrets
The secrets listed in the table below are included in the KUMA distribution kit.
Predefined secrets
Secret name |
Description |
[OOTB] Continent SQL connection |
Stores confidential data and settings for connecting to the APKSh Kontinent database. To use it, you must specify the login name and password of the database. |
[OOTB] KSC MSSQL connection |
Stores confidential data and settings for connecting to the MS SQL database of Open Single Management Platform (KSC). To use it, you must specify the login name and password of the database. |
[OOTB] KSC MySQL Connection |
Stores confidential data and settings for connecting to the MySQL database of Open Single Management Platform (KSC). To use it, you must specify the login name and password of the database. |
[OOTB] Oracle Audit Trail SQL Connection |
Stores confidential data and settings for connecting to the Oracle database. To use it, you must specify the login name and password of the database. |
[OOTB] SecretNet SQL connection |
Stores confidential data and settings for connecting to the MS SQL database of the SecretNet system. To use it, you must specify the login name and password of the database. |
Context tables
A context table is a container for a data array that is used by KUMA correlators for analyzing events in accordance with correlation rules. You can create context tables in the Resources section. The context table data is stored only in the correlator to which it was added using filters or actions in correlation rules.
You can populate context tables automatically using correlation rules of 'simple' and 'operational' types or import a file with data for the context table.
You can add, copy, and delete context tables, as well as edit their settings.
Context tables can be used in the following KUMA services and features:
The same context table can be used in multiple correlators. However, a separate entity of the context table is created for each correlator. Therefore, the contents of the context tables used by different correlators are different even if the context tables have the same name and ID.
Only data based on correlation rules of the correlator are added to the context table.
You can add, edit, delete, import, and export records in the context table of the correlator.
When records are deleted from context tables after their lifetime expires, service events are generated in the correlators. These events only exist in the correlators, and they are not redirected to other destinations. Service events are sent for processing by correlation rules of that correlator which uses the context table. Correlation rules can be configured to track these events so that they can be used to process events and identify threats.
Service event fields for deleting an entry from a context table are described below.
Event field |
Value or comment |
|
Event ID |
|
Time when the expired entry was deleted |
|
|
|
|
|
|
|
Correlator ID |
|
Correlator name |
|
Context table ID |
|
Key of the expired entry |
|
Number of updates for the deleted entry, incremented by one |
|
Name of the context table. |
|
Depending on the type of the entry that dropped out from the context table, the dropped-out context table entry is recorded in the corresponding type of event: for example, S.<context table field> = <context table field value> SA.<context table field> = <array of context table field values>
Context table records of the boolean type have the following format: S.<context table field> = true/false SA.<context table field> = false,true,false |
Viewing the list of context tables
To view the context table list of the correlator:
- In the KUMA Console, select the Resources section.
- In the Services section, click the Active services button.
- In the context menu of the correlator for which you want to view context tables, select Go to context tables.
The Correlator context tables list is displayed.
The table contains the following data:
- Name—name of the context table.
- Size on disk—size of the context table.
- Directory—path to the context table on the KUMA correlator server.
Adding a context table
To add a context table:
- In the KUMA Console, select the Resources section.
- In the Resources section, click Context tables.
- In the Context tables window, click Add.
This opens the Create context table window.
- In the Name field, enter a name for the context table.
- In the Tenant drop-down list, select the tenant that owns the resource.
- In the TTL field, specify time the record added to the context table is stored in it.
When the specified time expires, the record is deleted. The time is specified in seconds. The maximum value is
31536000(1 year).The default value is
0. If the value of the field is 0, the record is stored indefinitely. - In the Description field, provide any additional information.
You can use up to 4,000 Unicode characters.
This field is optional.
- In the Schema section, specify which fields the context table has and the data types of the fields.
Depending on the data type, a field may or may not be a key field. At least one field in the table must be a key field. The names of all fields must be unique.
To add a table row, click Add and fill in the table fields:
- In the Name field, enter the name of the field. The maximum length is 128 characters.
- In the Type drop-down list, select the data type for the field.
Possible data types of context table fields
Field data type
Can be a key field
Comment
Integer
Yes

Floating point number
Yes
String
Yes
Boolean
Yes
Timestamp
Yes
For a field of this type, it is checked that the field value is greater than or equal to zero. No other operations are provided.
IP address
Yes
For a field of this type, it is checked that the field value corresponds to the IPv4, IPv6 format. No other operations are provided.
Integer list
No
Float list
No
List of strings
No
Boolean list
No
Timestamp list
No
For a field of this type, it is checked that each item in the list is greater than or equal to zero. No other operations are provided.
IP list
No
For a field of this type, it is checked that each item of the list corresponds to the IPv4, IPv6 format. No other operations are provided.
- If you want to make a field a key field, select the Key field check box.
A table can have multiple key fields. Key fields are chosen when the context table is created, uniquely identify a table entry and cannot be changed.
If a context table has multiple key fields, each table entry is uniquely identified by multiple fields (composite key).
- Add the required number of context table rows.
After saving the context table, the schema cannot be changed.
- Click the Save button.
The context table is added.
Page top
Viewing context table settings
To view the context table settings:
- In the KUMA Console, select the Resources section.
- In the Resources section, click Context tables.
- In the list in the Context tables window, select the context table whose settings you want to view.
This opens the context table settings window. It displays the following information:
- Name—unique name of the resource.
- Tenant—the name of the tenant that owns the resource.
- TTL—the record added to the context table is stored in it for this duration. This value is specified in seconds.
- Description—any additional information about the resource.
- Schema is an ordered list of fields and their data types, with key fields marked.
Editing context table settings
To edit context table settings:
- In the KUMA Console, select the Resources section.
- In the Resources section, click Context tables.
- In the list in the Context tables window, select the context table whose settings you want to edit.
- Specify the values of the following parameters:
- Name—unique name of the resource.
- TTL—the record added to the context table is stored in it for this duration. This value is specified in seconds.
- Description—any additional information about the resource.
- Schema is an ordered list of fields and their data types, with key fields marked. If the context table is not used in a correlation rule, you can edit the list of fields.
If you want to edit the schema in a context table that is already being used in a correlation rule, follow the steps below.
The Tenant field is not editable.
- Click Save.
To edit the settings of the context table previously used by the correlator:
- Export data from the table.
- Copy and save the path to the file with the data of the table on the disk of the correlator. This path is specified in the Directory column in the Correlator context tables window. You will need this path later to delete the file from the disk of the correlator.
- Delete the context table from the correlator.
- Edit context table settings as necessary.
- Delete the file with data of the table on the disk of the correlator at the path from step 2.
- To apply the changes (delete the table), update the configuration of the correlator: in the Resources → Active services section, in the list of services, select the check box next to the relevant correlator and click Update configuration.
- Add the context table in which you edited the settings to the correlator.
- To apply the changes (add a table), update the configuration of the correlator: in the Resources → Active services section, in the list of services, select the check box next to the relevant correlator and click Update configuration.
- Adapt the fields in the exported table (see step 1) so that they match the fields of the table that you uploaded to the correlator at step 7.
- Import the adapted data to the context table.
The configuration of the context table is updated.
Page top
Duplicating context table settings
To copy a context table:
- In the KUMA Console, select the Resources section.
- In the Resources section, click Context tables.
- Select the check box next to the context table that you want to copy.
- Click Duplicate.
- Specify the necessary settings.
- Click the Save button.
The context table is copied.
Page top
Deleting a context table
You can delete only those context tables that are not used in any of the correlators.
To delete a context table:
- In the KUMA Console, select the Resources section.
- In the Resources section, click Context tables.
- Select the check boxes next to the context tables that you want to delete.
To delete all context tables, select the check box next to the Name column.
At least one check box must be selected.
- Click the Delete button.
- Click OK.
The context tables are deleted.
Page top
Viewing context table records
To view a list of context table records:
- In the KUMA Console, select the Resources section.
- In the Services section, click the Active services button.
- In the context menu of the correlator for which you want to view the context table, select Go to context tables.
This opens the Correlator context tables window.
- In the Name column, select the relevant context table.
The list of records for the selected context table is displayed.
The list contains the following data:
- Key is the composite key of the record. It is comprised by one or more values of key fields, separated by the "|" character. If one of the key field values is absent, the separator character is still displayed.
For example, a record key consists of three fields:
DestinationAddress,DestinationPort, andSourceUserName. If the last two fields do not contain values, the record key is displayed as follows:43.65.76.98| |. - Record repetitions is the total number of times the record was mentioned in events and identical records were downloaded when importing context tables to KUMA.
- Expiration date – date and time when the record must be deleted.
If the TTL field had the value of 0 when the context table was created, the records of this context table are retained for 36,000 days (approximately 100 years).
- Updated is the date and time when the context table was updated.
Searching context table records
To find a record in the context table:
- In the KUMA Console, select the Resources section.
- In the Services section, click the Active services button.
- In the context menu of the correlator in whose context table you want to find a record, select Go to context tables.
This opens the Correlator context tables window.
- In the Name column, select your context table.
This opens a window with the records of the selected context table.
- In the Search field, enter the record key value or several characters from the key.
The list of context table records displays only the records whose key contains the entered characters.
If the your search query matches records with empty key values, the text <Nothing found> is displayed in the widget on the Dashboard. We recommend clarifying the conditions of your search query.
Page top
Adding a context table record
To add a record to the context table:
- In the KUMA Console, select the Resources section.
- In the Services section, click the Active services button.
- In the context menu of the correlator to whose context table you want to add a record, select Go to context tables.
This opens the Correlator context tables window.
- In the Name column, select the relevant context table.
The list of records for the selected context table is displayed.
- Click Add.
The Create record window opens.
- In the Value field, specify the values for fields in the Field column.
KUMA takes field names from the correlation rules with which the context table is associated. These names are not editable. The list of fields cannot be edited.
If you do not specify some of the field values, the missing fields, including key fields, are populated with default values. The key of the record is determined from the full set of fields, and the record is added to the table. If an identical key already exists in the table, an error is displayed.
- Click the Save button.
The record is added.
Page top
Editing a context table record
To edit a record in the context table:
- In the KUMA Console, select the Resources section.
- In the Services section, click the Active services button.
- In the context menu of the correlator for which you want to edit the context table, select Go to context tables.
This opens the Correlator context tables window.
- In the Name column, select the relevant context table.
The list of records for the selected context table is displayed.
- Click on the row of the record that you want to edit.
- Specify your values in the Value column.
- Click the Save button.
The record is overwritten.
Restrictions when editing a record:
- The value of the key field of the record is not available for editing. You can change it by exporting and importing a record.
- Field names in the Field column are not editable.
- The values in the Value column must meet the following requirements:
- greater than or equal to 0 for fields of the Timestamp and Timestamp list types.
- IPv4 or IPv6 format for fields of the IP address and IP list types.
- is true or false for a Boolean field.
Deleting a context table record
To delete records from a context table:
- In the KUMA Console, select the Resources section.
- In the Services section, click the Active services button.
- In the context menu of the correlator from whose context table you want to delete a record, select Go to context tables.
This opens the Correlator context tables window.
- In the Name column, select the relevant context table.
The list of records for the selected context table is displayed.
- Select the check boxes next to the records you want to delete.
To delete all records, select the check box next to the Key column.
At least one check box must be selected.
- Click the Delete button.
- Click OK.
The records will be deleted.
Page top
Importing data into a context table
To import data to a context table:
- In the KUMA Console, select the Resources section.
- In the Services section, click the Active services button.
- In the context menu of the correlator to whose context table you want to import data, select Go to context tables.
This opens the Correlator context tables window.
- Select the check box next to your context table and click Import.
This opens the context table data import window.
- Click Add and select the file that you want to import.
- In the Format drop-down list select the format of the file:
- csv
- tsv
- internal
- Click the Import button.
The data from the file is imported into the context table. Records that previously existed in the context table are preserved.
When importing, KUMA checks the uniqueness of each record's key. If a record already exists, its fields are populated with new values obtained by merging the previous values with the field values of the imported record.
If no record existed in the context table, a new record is created.
Data imported from a file is not checked for invalid characters. If you use this data in widgets, widgets are displayed incorrectly if invalid characters are present in the data.
Page top
Exporting data from a context table
To export data from a context table:
- In the KUMA Console, select the Resources section.
- In the Services section, click the Active services button.
- In the context menu of the correlator whose context table you want to export, select Go to context tables.
This opens the Correlator context tables window.
- Select the check box next to your context table and click Export.
The context table is downloaded to your computer in JSON format. The name of the downloaded file reflects the name of the context table. The order of the fields in the file is not defined.
Page top
Analytics
KUMA provides extensive analytics on the data available to the program from the following sources:
- Events in storage
- Alerts
- Assets
- Accounts imported from Active Directory
- Data from collectors on the number of processed events
- Metrics
You can configure and receive analytics in the Dashboard, Reports, and Source status sections of the KUMA Console. Analytics are built by using only the data from tenants that the user can access.
The date format depends on the localization language selected in the application settings. Possible date format options:
- English localization: YYYY-MM-DD.
- Russian localization: DD.MM.YYYY.
Dashboard
In the Dashboard section, you can monitor the security status of your organization's network.
The dashboard is a set of widgets that display network security data analytics. You can view data only for those tenants to which you have access.
A selection of widgets used in the dashboard is called a layout. You can create layouts manually or use predefined layouts. You can edit widget settings in predefined layouts as necessary. By default, the dashboard displays the Alerts Overview predefined layout.
Only users with the Main administrator, Tenant administrator, Tier 2 analyst, and Tier 1 analyst roles can create, edit, or delete layouts. Users accounts with all roles can view layouts and set default layouts. If a layout is set as default, that layout is displayed for the account every time the user navigates to the Dashboard section. The selected default layout is saved for the current user account.
The information on the dashboard is updated in accordance with the schedule configured in layout settings. If necessary, you can force the update of the data.
For convenient presentation of information on the dashboard, you can enable TV mode. This mode lets you view the dashboard in full-screen mode in FullHD resolution. In TV mode, you can also configure a slide show display for the selected layouts.
Creating a dashboard layout
To create a layout:
- Open the KUMA Console and select the Dashboard section.
- Open the drop-down list in the top right corner of the Dashboard window and select Create layout.
The New layout window opens.
- In the Tenants drop-down list, select the tenants that will own the created layout and whose data will be used to fill the widgets of the layout.
The selection of tenants in this drop-down list does not matter if you want to create a universal layout (see below).
- In the Time period drop-down list, select the time period from which you want to get analytics:
- If you want to specify an exact date, in the calendar on the left, select the start and end date of the period and click Apply.
You can select a date up to and including the current date. The date and time format depends on your browser settings. If the Date from or Date to field has a value and you have not edited the time value manually, when you select a date in the calendar, the Date from field is automatically populated with 00:00:00.000, and the Date to field with 23:59:59.999. If you have manually deleted the value in the Date from or Date to field, when you select a date in the calendar, the field is automatically populated with the current time. After you select a value in one of the fields, the focus switches to the other field. If your Date to is earlier than your Date from, this earlier value is automatically inserted into the Date from field.
- If you want to specify a relative period, select one of the available periods in the Relative period list on the right.
The period is calculated relative to the current time.
- If you want to specify a custom period, edit the value of the Date from and Date to fields.
You can enter an exact date and time in the DD.MM.YYYY HH:mm:ss.SSS format for the Russian localization and YYYY-MM-DD HH:mm:ss.SSS for the English localization or a period relative to the current time as a formula. You can also combine these methods if necessary. If you do not specify milliseconds when entering the exact date, 000 is substituted automatically. If you have edited the time in the Date from or Date to fields, picking a date in the calendar does not change the time component.
In the relative period formulas, you can use the now parameter for the current date and time and the interval parameterization language: + (only in the Date to field), -, / (rounding to the nearest), as well as time units: y (year), M (month), w (week), d (day), h (hour), m (minute), s (second). For example, you can specify the period now-5d to get data for the last five days, or now/w to get data from the beginning of the first day of the current week (00:00:00:000 UTC) to the current time (now).
The Date from field is required, and its value cannot exceed the value of the Date from field, and also cannot be earlier than 1970-01-01 (if specifying an exact date or a relative period). The Date to cannot be earlier than the Date from. If you do not specify a value in the Date from field, now is specified automatically.
By default, the 1 day (now-1d) relative period is selected. The bounds of the period are inclusive: for example, for the Today time range, events are displayed from the beginning (00:00:00:000 UTC) of the current day to the current time (now) inclusive, and for the Yesterday period, events are displayed from the beginning (00:00:00:000 UTC) of the previous day to 00:00:00:000 UTC of the current day.
KUMA stores time values in UTC, but in the user interface time is converted to the time zone of your browser. This is relevant to the relative periods: Today, Yesterday, This week, and This month. For example, if the time zone in your browser is UTC+3, and you select Today as the data display period, data will be displayed for the period from 03:00:00.000 until now, not from 00:00:00.000 until now.
If you want to take your time zone into account when selecting a relative data display period, such as Today, Yesterday, This week, or This month, you need to manually add a time offset in the Date from and Date to fields (if a value other than now is specified) by adding or subtracting the correct number of hours. For example, if your browser's time zone is UTC+3 and you want to display data for Yesterday, you need to change Date from to now-1d/d-3h and Date to to now/d-3h. If you want to display data for the Today period, you only need to change the value in the Date from field to now/d-3h.
If you need results up to 23:59:59:999 UTC of yesterday, you can use an SQL query with a filter by Timestamp or specify an exact date and time.
- If you want to specify an exact date, in the calendar on the left, select the start and end date of the period and click Apply.
- In the Refresh every drop-down list, select how often data should be updated in layout widgets:
- never — never refresh data in widgets of the layout
- 1 minute
- 5 minutes
- 15 minutes
- 1 hour (default)
- 3 hours
- 6 hours
- 12 hours
- 24 hours
- In the Add widget drop-down list, select the required widget and configure its settings. You can add multiple widgets. You can drag widgets around the window and resize them using the
 button that appears when you hover the mouse over a widget.
The following limitations apply to widgets with the Pie chart, Bar chart, Line chart, Counter, and Date Histogram chart types:
- In
SELECTqueries, you can use extended event schema fields of "String", "Number", and "Float" types. - In
WHEREqueries, you can use all types of extended event schema fields ("String", "Number", "Float", "Array of strings", "Array of numbers", and "Array of floats").
For widgets with the Table chart type, in
SELECTqueries, you can use all types of extended event schema fields ("String", "Number", "Float", "Array of strings", "Array of numbers", and "Array of floats").You can do the following with widgets:
- Add widgets.
- Edit widgets.
To edit widget:
- Hover the mouse over the required widget and clicking the icon that appears.
- In the drop-down list select Edit.
The window with widget parameters opens. You can see how the widget will look like by clicking the Preview button.
- Update widget parameters and click the Save button.
- Hover the mouse over the required widget and clicking the
You can edit and delete a widget added to the layout by hovering over the widget, clicking the icon
that appears, and then selecting Edit or Delete. - In
- In the Layout name field, enter a unique name for this layout. Must contain 1 to 128 Unicode characters.
- If necessary, click the icon on the right of the layout name field and select the check boxes next to the additional layout settings:
- Universal—if you select this check box, layout widgets display data from tenants that you select in the Selected tenants section in the menu on the left. This means that the data in the layout widgets will change based on your selected tenants without having to edit the layout settings. For universal layouts, tenants selected in the Tenants drop-down list are not taken into account.
If this check box is cleared, layout widgets display data from the tenants that are selected in the Tenants drop-down list in the layout settings. If any of the tenants selected in the layout are not available to you, their data will not be displayed in the layout widgets.
You cannot use the Active lists and context tables widget in universal layouts.
Universal layouts can only be created and edited by General administrators. Such layouts can be viewed by all users.
- Show CII-related data—if you select this check box, layout widgets will also show data on assets, alerts, and incidents related to critical information infrastructure (CII). In this case, these layouts will be available for viewing only by users whose settings have the Access to CII facilities check box selected.
If this check box is cleared, layout widgets will not display data on CII-related assets, alerts, and incidents, even if the user has access to CII objects.
- Universal—if you select this check box, layout widgets display data from tenants that you select in the Selected tenants section in the menu on the left. This means that the data in the layout widgets will change based on your selected tenants without having to edit the layout settings. For universal layouts, tenants selected in the Tenants drop-down list are not taken into account.
- Click Save.
The new layout is created and is displayed in the Dashboard section of the KUMA Console.
Page top
Selecting a dashboard layout
To select a dashboard layout:
- Expand the list in the upper right corner of the Dashboard window.
- Select the relevant layout.
The selected layout is displayed in the Dashboard section of the KUMA Console.
Page top
Selecting a dashboard layout as the default
To set a dashboard layout as the default:
- In the KUMA Console, select the Dashboard section.
- Expand the list in the upper right corner of the Dashboard window.
- Hover the mouse cursor over the relevant layout.
- Click the
 icon.
icon.
The selected layout is displayed on the dashboard by default.
Page top
Editing a dashboard layout
To edit a dashboard layout:
- In the KUMA Console, select the Dashboard section.
- Expand the list in the upper right corner of the window.
- Hover the mouse cursor over the relevant layout.
- Click the icon.
The Customizing layout window opens.
- Make the necessary changes. The settings that are available for editing are the same as the settings available when creating a layout.
- Click the Save button.
The dashboard layout is edited and displayed in the Dashboard section of the KUMA Console.
If the layout is deleted or assigned to a different tenant while are making changes to it, an error is displayed when you click Save. The layout is not saved. Refresh the KUMA Console page to see the list of available layouts in the drop-down list.
Page top
Deleting a dashboard layout
To delete layout:
- In the KUMA Console, select the Dashboard section.
- Expand the list in the upper right corner of the window.
- Hover the mouse cursor over the relevant layout.
- Click the
 icon and confirm this action.
The layout is deleted.
Page top
Enabling and disabling TV mode
It is recommended to create a separate user with the minimum required set of right to display analytics in TV mode.
To enable TV mode:
- In the KUMA Console, select the Dashboard section.
- Click the
 button in the upper-right corner.
The Settings window opens.
- Move the TV mode toggle switch to the Enabled position.
- To configure the slideshow display of the layouts, do the following:
- Move the Slideshow toggle switch to the Enabled position.
- In the Timeout field, indicate how many seconds to wait before switching layouts.
- In the Queue drop-down list, select the layouts to view. If no layout is selected, the slideshow mode displays all layouts available to the user one after another.
- If necessary, change the order in which the layouts are displayed using the button to drag and drop them.
- Click the Save button.
TV mode will be enabled. To return to working with the KUMA Console, disable TV mode.
To disable TV mode:
- Open the KUMA Console and select the Dashboard section.
- Click the button in the upper-right corner.
The Settings window opens.
- Move the TV mode toggle switch to the Disabled position.
- Click the Save button.
TV mode will be disabled. The left part of the screen shows a pane containing sections of the KUMA Console.
When you make changes to the layouts selected for the slideshow, those changes will automatically be applied to the active slideshow sessions.
Page top
Predefined dashboard layouts
KUMA comes with a set of predefined layouts: The default refresh period for predefined layouts is Never. You can edit these layouts as needed.
Predefined layouts
Layout name |
Description of widgets in the layout |
|---|---|
Alerts Overview |
|
Incidents Overview |
|
Network Overview |
|
[OOTB] KATA & EDR |
|
[OOTB] KSC |
|
[OOTB] KSMG |
|
[OOTB] KWTS |
|
Reports
You can configure KUMA to regularly generate reports about KUMA processes.
Reports are generated using report templates that are created and stored on the Templates tab of the Reports section.
Generated reports are stored on the Generated reports tab of the Reports section.
To save the generated reports in HTML and PDF formats, install the required packages on the device with the KUMA Core.
When deploying KUMA in a high availability version, the time zone of the Application Core server and the time in the user's browser may differ. This difference is manifested by the discrepancy between the time in reports generated by schedule and the data that the user can export from widgets. To avoid this discrepancy, it is recommended to configure the report generation schedule to take into account the difference between the users' time zone and UTC.
Report template
Report templates are used to specify the analytical data to include in the report, and to configure how often reports must be generated. Users with the General administrator, Tenant administrator, Tier 2 analyst, and Tier 1 analyst roles can create, edit, or delete report templates. Reports that were generated using report templates are displayed in the Generated reports tab.
Report templates are available in the Templates tab of the Reports section, where the table of existing templates is displayed. The table has the following columns:
You can configure a set of table columns and their order, as well as change data sorting:
- You can enable or disable the display of columns in the menu that can be opened by clicking the icon .
- You can change the order of columns by dragging the column headers.
- If a table column header is green, you can click it to sort the table based on that column's data.
- Name—the name of the report template.
You can sort the table by this column by clicking the title and selecting Ascending or Descending.
You can also search report templates by using the Search field that opens when you click the Name column title.
Regular expressions are used when searching for report templates.
- Schedule—the rate at which reports must be generated using the template. If the report schedule was not configured, the
disabledvalue is displayed. - Created by—the name of the user who created the report template.
- Updated—the date when the report template was last updated.
You can sort the table by this column by clicking the title and selecting Ascending or Descending.
- Last report—the date and time when the last report was generated based on the report template.
- Send by email—the check mark is displayed in this column for the report templates that notify users about generated reports via email notifications.
- Tenant—the name of the tenant that owns the report template.
You can click the name of the report template to open the drop-down list with available commands:
- Run report—use this option to generate report immediately. The generated reports are displayed on the Generated reports tab.
- Edit schedule—use this command to configure the schedule for generating reports and to define users that must receive email notifications about generated reports.
- Edit report template—use this command to configure widgets and the time period for extracting analytics.
- Duplicate report template—use this command to create a copy of the existing report template.
- Delete report template—use this command to delete the report template.
Creating report template
To create report template:
- Open the KUMA Console and select Reports → Templates.
- Click the New template button.
The New report template window opens.
- In the Tenants drop-down list, select one or more tenants that will own the layout being created.
- In the Time period drop-down list, select the time period from which you want to get analytics:
- If you want to specify an exact date, in the calendar on the left, select the start and end date of the period and click Apply.
You can select a date up to and including the current date. The date and time format depends on your browser settings. If the Date from or Date to field has a value and you have not edited the time value manually, when you select a date in the calendar, the Date from field is automatically populated with 00:00:00.000, and the Date to field with 23:59:59.999. If you have manually deleted the value in the Date from or Date to field, when you select a date in the calendar, the field is automatically populated with the current time. After you select a value in one of the fields, the focus switches to the other field. If your Date to is earlier than your Date from, this earlier value is automatically inserted into the Date from field.
- If you want to specify a relative period, select one of the available periods in the Relative period list on the right.
The period is calculated relative to the current time.
- If you want to specify a custom period, edit the value of the Date from and Date to fields.
You can enter an exact date and time in the DD.MM.YYYY HH:mm:ss.SSS format for the Russian localization and YYYY-MM-DD HH:mm:ss.SSS for the English localization or a period relative to the current time as a formula. You can also combine these methods if necessary. If you do not specify milliseconds when entering the exact date, 000 is substituted automatically. If you have edited the time in the Date from or Date to fields, picking a date in the calendar does not change the time component.
In the relative period formulas, you can use the now parameter for the current date and time and the interval parameterization language: + (only in the Date to field), -, / (rounding to the nearest), as well as time units: y (year), M (month), w (week), d (day), h (hour), m (minute), s (second). For example, you can specify the period now-5d to get data for the last five days, or now/w to get data from the beginning of the first day of the current week (00:00:00:000 UTC) to the current time (now).
The Date from field is required, and its value cannot exceed the value of the Date from field, and also cannot be earlier than 1970-01-01 (if specifying an exact date or a relative period). The Date to cannot be earlier than the Date from. If you do not specify a value in the Date from field, now is specified automatically.
By default, the 1 day (now-1d) relative period is selected. The bounds of the period are inclusive: for example, for the Today time range, events are displayed from the beginning (00:00:00:000) of the current day to the current time (now) inclusive, and for the Yesterday period, events are displayed from the beginning (00:00:00:000) of the previous day to 00:00:00:000 of the current day.
KUMA stores time values in UTC, but in the user interface time is converted to the time zone of your browser. This is relevant to the relative periods: Today, Yesterday, This week, and This month. For example, if the time zone in your browser is UTC+3, and you select Today as the data display period, data will be displayed for the period from 03:00:00.000 until now, not from 00:00:00.000 until now.
If you want to take your time zone into account when selecting a relative data display period, such as Today, Yesterday, This week, or This month, you need to manually add a time offset in the Date from and Date to fields (if a value other than now is specified) by adding or subtracting the correct number of hours. For example, if your browser's time zone is UTC+3 and you want to display data for Yesterday, you need to change Date from to now-1d/d-3h and Date to to now/d-3h. If you want to display data for the Today period, you only need to change the value in the Date from field to now/d-3h.
If you need results up to 23:59:59:999 UTC of yesterday, you can use an SQL query with a filter by Timestamp or specify an exact date and time.
- If you want to specify an exact date, in the calendar on the left, select the start and end date of the period and click Apply.
- In the Retention field, specify how long you want to store reports that are generated according to this template.
- In the Template name field, enter a unique name for the report template. Must contain 1 to 128 Unicode characters.
- In the Add widget drop-down list, select the required widget and configure its settings. You can add multiple widgets. You can drag widgets around the window and resize them using the button that appears when you hover the mouse over a widget.
The following limitations apply to widgets with the Pie chart, Bar chart, Line chart, Counter, and Date Histogram chart types:
- In
SELECTqueries, you can use extended event schema fields of "String", "Number", and "Float" types. - In
WHEREqueries, you can use all types of extended event schema fields ("String", "Number", "Float", "Array of strings", "Array of numbers", and "Array of floats").
For widgets with the Table chart type, in
SELECTqueries, you can use all types of extended event schema fields ("String", "Number", "Float", "Array of strings", "Array of numbers", and "Array of floats").You can do the following with widgets:
- Add widgets.
- Edit widgets.
To edit widget:
- Hover the mouse over the required widget and clicking the icon that appears.
- In the drop-down list select Edit.
The window with widget parameters opens. You can see how the widget will look like by clicking the Preview button.
- Update widget parameters and click the Save button.
- Hover the mouse over the required widget and clicking the
You can edit and delete a widget added to the layout by hovering over the widget, clicking the icon
that appears, and then selecting Edit or Delete. - In
- You can change logo in the report template by clicking the Upload logo button.
When you click the Upload logo button, the Upload window opens and lets you choose the image file for the logo. The image must be a .jpg, .png, or .gif file no larger than 3 MB.
The added logo is displayed in the report instead of KUMA logo.
- If necessary, select the Show CII-related data check box to display data on assets, alerts, and incidents related to critical information infrastructure (CII) in the layout widgets. In this case, these layouts will be available for viewing only by users whose settings have the Access to CII facilities check box selected.
If this check box is cleared, layout widgets will not display data on CII-related assets, alerts, and incidents, even if the user has access to CII objects.
- Click Save.
The new report template is created and is displayed on the Reports → Templates tab of the KUMA Console. You can run this report manually. If you want to have the reports generated automatically, you must configure the schedule for that.
Page top
Configuring report schedule
To configure the report schedule:
- Open the KUMA Console and select Reports → Templates.
- In the report templates table, click the name of an existing report template and select Edit schedule in the drop-down list.
The Report settings window opens.
- If you want the report to be generated regularly:
- Turn on the Schedule toggle switch.
In the Recur every group of settings, define how often the report must be generated.
You can specify the frequency of generating reports by days, weeks, months, or years. Depending on the selected period, you should specify the time, day of the week, day of the month or the date of the report generation.
- In the Time field, enter the time when the report must be generated. You can enter the value manually or using the clock icon.
- Turn on the Schedule toggle switch.
- To select the report format and specify the report recipients, configure the following settings:
- In the Send to group of settings, click Add.
- In the Add emails window that opens, in the User group section, click Add group.
- In the field that appears, specify the email address and press Enter or click outside the entry field—the email address will be added. You can add more than one address. Reports are sent to the specified addresses every time you generate a report manually or KUMA generates a report automatically on schedule.
You should configure an SMTP connection so that generated reports can be forwarded by email.
If the recipients who received the report by email are KUMA users, they can download or view the report by clicking the links in the email. If the recipients are not KUMA users, they can follow the links but cannot log in to KUMA, so only attachments are available to them.
We recommend viewing HTML reports by clicking links in the web interface, because at some screen resolutions, the HTML report from the attachment may not be displayed correctly.
If you send an email without attachments, the recipients will have access to reports only by links and only with authorization in KUMA, without restrictions on roles or tenants.
- In the drop-down list, select the report format to send. Available formats: PDF, HTML, , Excel.
- Click Save.
Report schedule is configured.
Page top
Editing report template
To edit report template:
- Open the KUMA Console and select Reports → Templates.
- In the report templates table click the name of the report template and select Edit report template in the drop-down list.
The Edit report template window opens.
You can also open this window on the Reports → Generated reports tab by clicking the name of a generated report and selecting in the drop-down list Edit report template.
- Make the necessary changes:
- Change the list of tenants that own the report template.
- Update the time period from which you require analytics.
- Add widgets
- Change widgets positions by dragging them.
- Resize widgets using the button that appears when you hover the mouse over a widget.
- Edit widgets
To edit widget:
- Hover the mouse over the required widget and clicking the icon that appears.
- In the drop-down list select Edit.
The window with widget parameters opens. You can see how the widget will look like by clicking the Preview button.
- Update widget parameters and click the Save button.
- Hover the mouse over the required widget and clicking the
- Delete widgets by hovering the mouse over them, clicking the icon that appears, and selecting Delete.
- In the field to the right from the Add widget drop-down list enter a new name of the report template. Must contain 1 to 128 Unicode characters.
- Change the report logo by uploading it using the Upload logo button. If the template already contains a logo, you must first delete it.
- Change how long reports generated using this template must be stored.
- If necessary, select or clear the Show CII-related data check box.
- Click Save.
The report template is updated and is displayed on the Reports → Templates tab of the KUMA Console.
Page top
Copying report template
To create a copy of a report template:
- Open the KUMA Console and select Reports → Templates.
- In the report templates table, click the name of an existing report template, and select Duplicate report template in the drop-down list.
The New report template window opens. The name of the widget is changed to
<Report template> - copy. - Make the necessary changes:
- Change the list of tenants that own the report template.
- Update the time period from which you require analytics.
- Add widgets
- Change widgets positions by dragging them.
- Resize widgets using the button that appears when you hover the mouse over a widget.
- Edit widgets
To edit widget:
- Hover the mouse over the required widget and clicking the icon that appears.
- In the drop-down list select Edit.
The window with widget parameters opens. You can see how the widget will look like by clicking the Preview button.
- Update widget parameters and click the Save button.
- Hover the mouse over the required widget and clicking the
- Delete widgets by hovering the mouse over them, clicking the icon that appears, and selecting Delete.
- In the field to the right from the Add widget drop-down list enter a new name of the report template. Must contain 1 to 128 Unicode characters.
- Change the report logo by uploading it using the Upload logo button. If the template already contains a logo, you must first delete it.
- Click Save.
The report template is updated and is displayed on the Reports → Templates tab of the KUMA Console.
Page top
Deleting report template
To delete report template:
- Open the KUMA Console and select Reports → Templates.
- In the report templates table, click the name of the report template, and select Delete report template in the drop-down list.
A confirmation window opens.
- If you want to delete only the report template, click the Delete button.
- If you want to delete a report template and all the reports that were generated using that template, click the Delete with reports button.
The report template is deleted.
Page top
Generated reports
All reports are generated using report templates. Generated reports are available on the Generated reports tab of the Reports section and are displayed in the table with the following columns:
You can configure a set of table columns and their order, as well as change data sorting:
- You can enable or disable the display of columns in the menu that can be opened by clicking the icon .
- You can change the order of columns by dragging the column headers.
- If a table column header is green, you can click it to sort the table based on that column's data.
- Name—the name of the report template.
You can sort the table by this column by clicking the title and selecting Ascending or Descending.
- Time period—the time period for which the report analytics were extracted.
- Last report—date and time when the report was generated.
You can sort the table by this column by clicking the title and selecting Ascending or Descending.
- Tenant—name of the tenant that owns the report.
- User—name of the user who generated the report manually. If the report was generated by schedule, the value is blank. If the report was generated in KUMA lower than 2.1, the value is blank.
You can click the name of a report to open the drop-down list with available commands:
- Open report—use this command to open the report data window.
- Save as—use this command to save the generated report in the desired format. Available formats: HTML, PDF, CSV, split CSV, Excel. By default, 250 rows are displayed in all formats. At most 500 values can be displayed in tables in PDF and HTML formats. If you want to output more than 500 rows in a report, set your value for the LIMIT parameter in the SQL query and save the report in CSV format.
- Run report—use this option to generate report immediately. Refresh the browser window to see the newly generated report in the table.
- Edit report template—use this command to configure widgets and the time period for extracting analytics.
- Delete report—use this command to delete the report.
Viewing reports
To open report:
- Open the KUMA Console and select Reports → Generated reports.
- In the report table, click the name of the generated report, and select Open report in the drop-down list.
The new browser window opens with the widgets displaying report analytics. If a widget displays data on events, alerts, incidents, active lists, or context tables, you can click its header to open the corresponding section of the KUMA Console with an active filter and/or search query that is used to display data from the widget. Widgets are subject to default restrictions.
To download the data displayed on each widget in CSV format with UTF-8 encoding, press the CSV button. The downloaded file name has the format <widget name>_<download date (YYYYMMDD)>_<download time (HHMMSS)>.CSV.
To view the full data, download the report in the CSV format with the specified settings from the request.
- You can save the report in the desired format by using the Save as button.
Generating reports
You can generate report manually or configure a schedule to have it generated automatically.
To generate report manually:
- Open the KUMA Console and select Reports → Templates.
- In the report templates table, click a report template name and select Run report in the drop-down list.
You can also generate report from the Reports → Generated reports tab by clicking the name of an existing report and in the drop-down list selecting Run report.
The report is generated and is displayed on the Reports → Generated reports tab.
To generate reports automatically, configure the report schedule.
Page top
Saving reports
To save the report in the desired format:
- Open the KUMA Console and select Reports → Generated reports.
- In the report table, click the name of the generated report, and in the drop-down list select Save as. Then select the desired format: HTML, PDF, CSV, split CSV, Excel.
The report is saved to the download folder configured in your browser.
You can also save the report in the desired format when you view it.
Page top
Deleting reports
To delete report:
- Open the KUMA Console and select Reports → Generated reports.
- In the report table, click the name of the generated report, and in the drop-down list select Delete report.
A confirmation window opens.
- Click OK.
Widgets
Widgets let you monitor the operation of the application. Widgets are organized into widget groups, each one related to the analytics type they provide. The following widget groups and widgets are available in KUMA:
- Events—widget for creating analytics based on events.
- Active lists—widget for creating analytics based on active lists of correlators.
- Alerts—group for alert analytics.
The group includes the following widgets:
- Active alerts—number of alerts that have not been closed.
- Active alerts by tenant—number of unclosed alerts for each tenant.
- Alerts by tenant—number of alerts of all statuses for each tenant.
- Unassigned alerts—number of alerts that have the New status.
- Alerts by assignee—number of alerts with the Assigned status, grouped by account name.
- Alerts by status—number of alerts that have the New, Opened, Assigned, or Escalated status, grouped by status.
- Alerts by severity—number of unclosed alerts grouped by their severity.
- Alerts by rule—number of unclosed alerts grouped by correlation rule.
- Latest alerts—table with information about the last 10 unclosed alerts belonging to the tenants selected in the layout.
- Alerts distribution—number of alerts created during the period configured for the widget.
- Assets—group for analytics for assets from processed events. This group includes the following widgets:
- Affected assets—table with information about the level of importance of assets and the number of unclosed alerts they are associated with.
- Affected asset categories—categories of assets linked to unclosed alerts.
- Number of assets—number of assets that were added to KUMA.
- Assets in incidents by tenant—number of assets associated with unclosed incidents. The grouping is by tenant.
- Assets in alerts by tenant—number of assets associated with unclosed alerts, grouped by tenant.
- Incidents—group for incident analytics.
The group includes the following widgets:
- Active incidents—number of incidents that have not been closed.
- Unassigned incidents—number of incidents that have the Opened status.
- Incidents distribution—number of incidents created during the period configured for the widget.
- Incidents by assignee—number of incidents with the Assigned status, grouped by user account name.
- Incidents by status—number of incidents grouped by status.
- Incidents by severity—number of unclosed incidents grouped by their severity.
- Active incidents by tenant—number of unclosed incidents grouped by tenant available to the user account.
- All incidents—number of incidents of all statuses.
- All incidents by tenant—number of incidents of all statuses, grouped by tenant.
- Affected assets in incidents—number of assets associated with unclosed incidents.
- Affected assets categories in incidents—asset categories associated with unclosed incidents.
- Affected users in Incidents—users associated with incidents.
- Latest incidents—table with information about the last 10 unclosed incidents belonging to the tenants selected in the layout.
- Event sources—group for event source analytics. The group includes the following widgets:
- Top event sources by alerts number—number of unclosed alerts grouped by event source.
- Top event sources by convention rate—number of events associated with unclosed alerts. The grouping is by event source.
In some cases, the number of alerts generated by sources may be inaccurate. To obtain accurate statistics, it is recommended to specify the Device Product event field as unique in the correlation rule, and enable storage of all base events in a correlation event. However, correlation rules with these settings consume more resources.
- Users—group for analytics related to users from processed events. The group includes the following widgets:
- Affected users in alerts—number of accounts related to unclosed alerts.
- Number of AD users—number of Active Directory accounts received via LDAP during the period configured for the widget.
In the events table, in the event details area, in the alert window, and in the widgets, the names of assets, accounts, and services are displayed instead of the IDs as the values of the SourceAssetID, DestinationAssetID, DeviceAssetID, SourceAccountID, DestinationAccountID, and ServiceID fields. When exporting events to a file, the IDs are saved, but columns with names are added to the file. The IDs are also displayed when you point the mouse over the names of assets, accounts, or services.
Searching for fields with IDs is only possible using IDs.
Basics of managing widgets
The principle of data display in the widget depends on the type of the graph. The following graph types are available in KUMA:
- Pie chart (
 ).
). - Counter (
 ).
). - Table (
 ).
). - Bar chart (
 ).
). - Date Histogram (
 ).
). - Line chart.
- Stacked bar chart.
Basics of general widget management
The name of the widget is displayed in the upper left corner of the widgets. By clicking the link with the name of the widget about events, alerts, incidents, or active lists, you can go to the corresponding section of the KUMA Console.
A list of tenants for which data is displayed is located under the widget name.
In the upper right corner of the widget, the period for which data is displayed on the widget is indicated (for example, 30 days  ). Keep in mind that the data displayed in the dashboard may lag behind real time because of caching. You can view the date and time of the last update by hovering over the period icon.
If the Show data for previous period setting is enabled for the widget, and the widget is displaying data for a relative period, the tooltip also displays the previous period. The previous period is calculated relative to the current period as start and end values of the current period minus the duration of the current period. For example, if data is updated daily and displayed for a month, but only the first 10 days of the month have passed, the previous period is taken to be the last 10 days of the previous month.
You can change the data display period for the widget by clicking the period icon and selecting an exact date or a relative period in the window that is displayed. If you want the widget to display data for the period selected for the layout, click the Reset button. Changing the displayed period on the layout also changes the period displayed in the widget.
The time in the widget is displayed in the local time zone set in the browser.
The CSV button is located to the left of the period icon. You can download the data displayed on the widget in CSV format (UTF-8 encoding). The downloaded file name has the format <widget name>_<download date (YYYYMMDD)>_<download time (HHMMSS)>.CSV.
The widget displays data for the period selected in widget or layout settings only for the tenants that are selected in widget or layout settings.
Basics of managing "Pie chart" graphs
A pie chart is displayed under the list of tenants. You can left-click the selected segment of the diagram to go to the relevant section of the KUMA Console. The data in that section is sorted in accordance with the filters and/or search query specified in the widget.
Under the period icon, you can see the number of events, active lists, assets, alerts, or incidents grouped by the selected criteria for the data display period.
Examples:
|
Basics of managing "Counter" graphs
Graphs of this type display the sum total of selected data.
Example: The Number of assets widget displays the total number of assets added to KUMA. |
Basics of managing "Table" graphs
Graphs of this type display data in a table format.
Example: In the Events widget, for which the SQL query |
Basics of managing "Bar chart" graphs
A bar chart is displayed below the list of tenants. You can left-click the selected diagram section to go to the Events section of the KUMA Console. The data in that section is sorted in accordance with the filters and/or search query specified in the widget. To the right of the chart, the same data is represented as a table.
Example: In the a Netflow top internal IPs widget for which the SQL query |
Basics of managing "Date Histogram" graphs
A date histogram is displayed below the list of tenants. You can left-click the selected section of the chart to go to the Events section of the KUMA Console with the relevant data. The data in that section is sorted in accordance with the filters and/or search query specified in the widget. To the right of the chart, the same data is represented as a table.
Example: In the Events widget, for which the SQL query |
Basics of managing "Line chart" graphs
A line chart is displayed below the list of tenants. You can left-click the selected section of the chart to go to the Events section of the KUMA Console with the relevant data. The data in that section is sorted in accordance with the filters and/or search query specified in the widget. To the right of the chart, the same data is represented as a table.
Example: In the Events widget, for which the SQL query |
Basics of managing "Stacked bar chart" graphs
A stacked bar chart with a legend is displayed below the list of tenants. The legend displays the names of categories by which the bars are sliced. To the left of each category is a check box that lets you hide or show the category. The number of bars in the chart corresponds to the number of values in the selected grouping. The bars have captions. The color of the corresponding category in the bar is assigned automatically. When you hover over the zones of the bars, a tooltip is displayed with the value and a description of the value. You can left-click the selected diagram section to go to the Events section of the KUMA Console.
The meaning of bar height depends on the Format setting:
- If the Absolute values format is configured, the height of the bars corresponds to the sum of the values of the measured figure.
- If the Relative values, % format is configured, all bars have the same height of 100%, and the relative heights of colored zones on the bars correspond to the ratios of the values.
If, when creating a custom widget based on the stacked bar chart, you selected the Show data for previous period option, and the standard value, category, metric aliases are used in the query, the chart displays previous-period data as separate bars. However, if instead of the standard metric, the query uses a custom metric calculation with non-standard aliases, the Show data for previous period is not taken into account when displaying the chart (see example queries below).
Examples: When creating a custom widget of the Stacked bar chart type based on an SQL query of an Events widget, the following rules apply:
However, you can manage the count by using standard aggregation functions ( Example 1: For the Events widget, the following SQL query is specified with standard aliases, and the Show data for previous period option was selected when creating the widget:
The X-axis stands for tenants (the field specified as the Next to each bar, an additional bar is displayed with historical data, if such data was received in the query response. Example 2: For the Events widget, the following SQL query is specified with custom metrics specified as the
The X-axis stands for tenants (the field specified as The additional bar with historical data is not displayed for a query with custom metrics, even if the Show data for previous period option was selected when creating the widget. Example 3: For the Events widget, the following SQL query is specified with standard aliases:
In contrast to the similar query in example 1, in this case, the X-axis stands for the types of events (the field specified as the Example 4: For the Events widget, the following SQL query is specified with standard aliases:
The chart displays the days of the month on the X axis (the field specified as the To create a similar chart with bars arranged by date and/or time, use a query with grouping and sorting by the following fields of the
We recommend using the Date Histogram to work with data that is arranged by date and/or time. |
Special considerations for displaying data in widgets
Limitations for the displayed data
For improved readability, KUMA has limitations on the data displayed in widgets depending on its type:
- Pie chart displays a maximum of 20 slices.
- Bar chart displays a maximum of 40 bars.
- Table displays a maximum of 500 entries.
- Date histogram displays a maximum of 365 days.
Data that exceeds the specified limitations is displayed in the widget in the Other category.
You can download the full data used for building analytics in the widget in CSV format.
Summing up the data
The format of displaying the total sum of data on date histogram, bar chart and pie chart depends on the locale:
- English locale: decades (every three digits) are separated by commas, the decimal part is separated by a period.
- Russian locale: decades (every three digits) are separated by spaces, the decimal part is separated by a comma.
Creating a widget
You can create a widget in a dashboard layout while creating or editing the layout.
To create a widget:
- Create a layout or switch to editing mode for the selected layout.
- Click Add widget.
- Select a widget type from the drop-down list.
This opens the widget settings window.
- Edit the widget settings.
- If you want to see how the data will be displayed in the widget, click Preview.
- Click Add.
The widget appears in the dashboard layout.
Page top
Editing a widget
To edit widget:
- In the KUMA Console, select the Dashboard section.
- Expand the list in the upper right corner of the window.
- Hover the mouse cursor over the relevant layout.
- Click the button.
The Customizing layout window opens.
- In the widget you want to edit, click .
- Select Edit.
This opens the widget settings window.
- Edit the widget settings.
- Click Save in the widget settings window.
- Click Save in the Customizing layout window.
The widget is edited.
Page top
Deleting a widget
To delete a widget:
- In the KUMA Console, select the Dashboard section.
- Expand the list in the upper right corner of the window.
- Hover the mouse cursor over the relevant layout.
- Click the button.
The Customizing layout window opens.
- In the widget you want to delete, click .
- Select Delete.
- This opens a confirmation window; in that window, click OK.
- Click the Save button.
The widget is deleted.
Page top
"Events" widget
You can use the Events widget to get analytics based on SQL queries.
When creating this widget, you must specify the settings described in the tables below.
Tab 
The following table lists the settings on the tab.
Description of parameters
Setting |
Description |
|---|---|
Graph |
Graph type. The following graph types are available:
|
Format |
Data display format: Absolute values or Relative values, %. The setting is available for a Stacked bar chart. If you select the Absolute values format, the heights of the bars correspond to the sum of the values of the measured indicator. If you select the Relative values, % format, all bars have the same height of 100%, and the relative heights of colored zones on the bars correspond to the ratios of indicator values. By default, Absolute values is selected. |
Tenant |
The tenant for which data is displayed in the widget. You can select multiple tenants. By default, data is displayed for tenants selected in layout settings. |
Time period |
Period for which data is displayed in the widget. The default is As layout, meaning that data is displayed for the period selected for the layout. You can also specify a period for the widget in one of the following ways:
For details, see the Configuring a period subsection below. |
Show data for previous period |
Enable the display of data for two periods at the same time: for the current period and for the previous period. When using a Stacked bar chart, the Show data for previous period setting is taken into account if the query contains standard aliases: |
Storage |
Storage that is searched for events. The list displays the available spaces. You can select only one storage, but you can select one or more spaces. The values in the Storage field are independent of the selected tenants in the Tenant field. The field displays storages and spaces, like in the Events section. If the user does not have access rights to one or more spaces of the storage, the widget cannot display information; the user cannot edit the widget, but can duplicate the widget using the Duplicate button. Duplication does not depend on access rights to spaces. If a template is duplicated in widgets that have spaces specified that are not accessible to the user, the value in the Storage field is reset. Such widgets display an error: Access denied (Operation returns no results because of allowed and selected event spaces). To save the template, you need to specify spaces in widgets. In widgets that have spaces that are accessible to the user, the value of the Storage field is not reset and is saved when the template is duplicated. If the user's email address is included in the list of recipients of the scheduled report, the user gets the full version of the report, regardless of which spaces are accessible. |
SQL query field ( |
Query for filtering and searching for events manually. You can create a query in Builder by clicking For detailed information on creating an SQL query in the query constructor, see below. The following limitations apply:
|
 )
)How to create a query in Builder
To create a query in Builder:
- Specify the values of the following parameters:
- SELECT—event fields that should be returned. The number of available fields depends on the selected graph type.
- In the drop-down list on the left, select the event fields for which you want to display data in the widget.
- The middle field displays what the selected field is used for in the widget: metric or value.
If you selected the Table graph type, in the middle fields, you must specify column names using ANSII-ASCII characters.
- In the drop-down list on the right, you can select an operation to be performed on the data:
- count—event count. This operation is available only for the ID event field. Used by default for line charts, pie charts, bar charts, and counters. This is the only option for date histogram.
- max is the maximum value of the event field from the event selection.
- min is the minimum value of the event field from the event selection.
- avg is the average value of the event field from the event selection.
- sum is the sum of event field values from the event selection.
- SOURCE is the type of the data source. Only the events value is available for selection.
- WHERE—conditions for filtering events.
- In the drop-down list on the left, select the event field that you want to use for filtering.
- Select the necessary operator from the middle drop-down list. The available operators depend on the type of value of the selected event field.
- In the drop-down list on the right, enter the value of the condition. Depending on the selected type of field, you may have to manually enter the value, select it from the drop-down list, or select it on the calendar.
You can add search conditions by clicking Add condition or remove search conditions by clicking
.You can also add groups of conditions by clicking Add group. By default, groups of conditions are added with the AND operator, but you can change the it if necessary. Available values: AND, OR, NOT. Group conditions are deleted using the Delete group button.
- GROUP BY—event fields or aliases to be used for grouping the returned data. This parameter is not available for Counter graph type.
- ORDER BY—columns used as the basis for sorting the returned data. This parameter is not available for the Date Histogram and Counter graph types.
- In the drop-down list to the left, select the value that will be used for sorting.
- Select the sort order from the drop-down list on the right: ASC for ascending, DESC for descending.
- For Table type graphs, you can add sorting conditions by clicking Add column.
- LIMIT is the maximum number of data points for the widget. This parameter is not available for the Date Histogram and Counter graph types.
- SELECT—event fields that should be returned. The number of available fields depends on the selected graph type.
- Click Apply.
Example of search conditions in the query builder
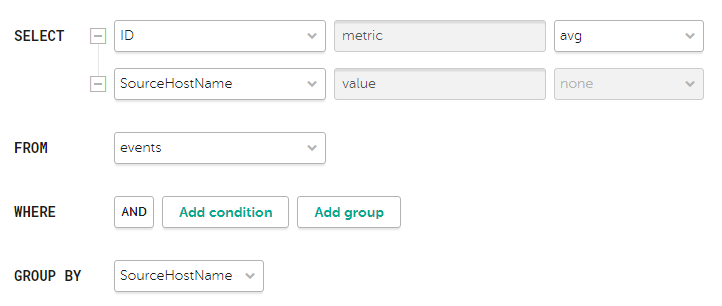
Search condition parameters for the widget showing average bytes received per host
Tab 
The following table lists the settings on the tab.
The tab is displayed if on the tab in the Graph field you have selected one of the following values: Bar chart, Line chart, Date Histogram.
Description of parameters
Setting |
Description |
|---|---|
Y-min and Y-max |
Scale of the Y axis. Negative values can be displayed on chart axes. This is due to the scaling of charts on the widget and can be fixed by setting zero as the minimum chart values instead of Auto. |
X-min and X-max |
Scale of the X axis. Negative values can be displayed on chart axes. This is due to the scaling of charts on the widget and can be fixed by setting zero as the minimum chart values instead of Auto. |
Line-width |
Width of the line on the graph. This field is displayed for the "Line chart" graph type. |
Point size |
Point size on the graph. This field is displayed for the "Line chart" graph type. |
Tab 
The following table lists the settings on the tab.
Description of parameters
Setting |
Description |
|---|---|
Name |
Name of the widget. |
Description |
Description of the widget. |
Color |
The color used for displaying the information:
This setting is available for graphs such as Bar chart, Counter, Line chart, Date Histogram. |
Horizontal |
Makes the histogram horizontal instead of vertical. When this option is enabled, when a widget displays a large amount of data, horizontal scrolling is not available and all available information is fit into the fixed size of the widget. If there is a lot of data to display, it is recommended to increase the widget size. |
Show total |
Shows sums total of the values. |
Show legend |
Displays a legend for the analytics. The toggle switch is turned on by default. |
Show nulls in legend |
Displays parameters with a null value in the legend for analytics. The toggle switch is turned off by default. |
Decimals |
Number of decimals to which the displayed value must be rounded off. |
Period segments length |
Duration of the segments into which you want to divide the period. Available for graphs of the Date Histogram type. |
Scale |
Scale for displaying data. Available for a Stacked bar chart. The following values are possible:
The default is Linear. |
"Active lists" widget
You can use the Active lists widget to get analytics based on SQL queries.
When creating this widget, you must specify the settings described in the tables below.
Tab
The following table lists the settings that must be specified on the tab.
Description of parameters
Setting |
Description |
|---|---|
Graph |
Graph type. The following graph types are available:
|
Tenant |
The tenant for which data is displayed in the widget. You can select multiple tenants. By default, data is displayed for tenants selected in layout settings. |
Correlator |
The name of the correlator that contains the active list for which you want to receive data. |
Active list |
The name of the active list for which you want to receive data. The same active list can be used by different correlators. However, a separate entity of the active list is created for each correlator. Therefore, the contents of the active lists used by different correlators differ even if the active lists have the same names and IDs. |
SQL query field |
This field lets you manually enter a query for filtering and searching active list data. The query structure is similar to that used in event search. When creating a query based on active lists, you must consider the following:
Special considerations apply when using aliases in SQL functions and SELECT, you can use double quotes and backticks: ", `. If you selected Counter as the graph type, aliases can contain Latin and Cyrillic characters, as well as spaces. When using spaces or Cyrillic, the alias must be enclosed in quotation marks: "An alias with a space", `Another alias`. When displaying data for the previous period, sorting by the count(ID) parameter may not work correctly. It is recommended to sort by the metric parameter. For example, SELECT count(ID) AS "metric", Name AS "value" FROM `events` GROUP BY Name ORDER BY metric ASC LIMIT 250. |
You can get the names of the tenants in the widget instead of their IDs.
Sample SQL queries for receiving analytics based on active lists:
|
Tab
The following table lists the settings that must be specified on the tab.
This tab is displayed if on the tab, in the Graph field, you have selected Bar chart.
Description of parameters
Settings |
Description |
|---|---|
Y-min and Y-max |
Scale of the Y axis. Negative values can be displayed on chart axes. This is due to the scaling of charts on the widget and can be fixed by setting zero as the minimum chart values instead of Auto. |
X-min and X-max |
Scale of the X axis. Negative values can be displayed on chart axes. This is due to the scaling of charts on the widget and can be fixed by setting zero as the minimum chart values instead of Auto. |
Tab
The following table lists the settings that must be specified on the tab.
Description of parameters
Setting |
Description |
|---|---|
Name |
Name of the widget. |
Description |
Description of the widget. |
Color |
The color used for displaying the information:
|
Horizontal |
Makes the histogram horizontal instead of vertical. When this setting is enabled, all available information is fitted into the configured widget size. If the amount of data is great, you can increase the size of the widget to display it optimally. |
Show total |
Shows sums total of the values. |
Show legend |
Displays a legend for the analytics. The toggle switch is turned on by default. |
Show nulls in legend |
Displays parameters with a null value in the legend for analytics. The toggle switch is turned off by default. |
"Context tables" widget
You can use the Context tables widget to get analytics based on SQL queries.
When creating this widget, you must specify the settings described in the tables below.
Tab
The following table lists the settings that must be specified on the tab.
Description of parameters
Setting |
Description |
|---|---|
Graph |
Graph type. The following graph types are available:
|
Tenant |
The tenant for which data is displayed in the widget. You can select multiple tenants. By default, data is displayed for tenants selected in layout settings. |
Correlator |
Name of the correlator that contains the context table for which you want to receive information. |
Context table |
Name of the context table for which you want to receive information. The same context table can be used in multiple correlators. However, a separate entity of the context table is created for each correlator. Therefore, the contents of the context tables used by different correlators are different even if the context tables have the same name and ID. |
SQL query field |
This field lets you manually enter a query for filtering and searching context table data. By default, for each widget type, the field contains a query that obtains the context table schema and the key by key fields. The query structure is similar to that used in event search. When creating a query based on context tables, you must consider the following:
Special considerations when using aliases in SQL functions and |
You can get the names of the tenants in the widget instead of their IDs.
Sample SQL queries for receiving analytics based on active lists:
|
Tab
The following table lists the settings that must be specified on the tab.
This tab is displayed if on the tab, in the Graph field, you have selected Bar chart.
Description of parameters
Setting |
Description |
|---|---|
Y-min and Y-max |
Scale of the Y axis. Negative values can be displayed on chart axes. This is due to the scaling of charts on the widget and can be fixed by setting zero as the minimum chart values instead of Auto. |
X-min and X-max |
Scale of the X axis. Negative values can be displayed on chart axes. This is due to the scaling of charts on the widget and can be fixed by setting zero as the minimum chart values instead of Auto. |
Tab
The following table lists the settings that must be specified on the tab.
Description of parameters
Settings |
Description |
|---|---|
Name |
Name of the widget. |
Description |
Description of the widget. |
Color |
The color used for displaying the information:
|
Horizontal |
Makes the histogram horizontal instead of vertical. When this setting is enabled, all available information is fitted into the configured widget size. If the amount of data is great, you can increase the size of the widget to display it optimally. |
Show total |
Shows sums total of the values. |
Show legend |
Displays a legend for the analytics. The toggle switch is turned on by default. |
Show nulls in legend |
Displays parameters with a null value in the legend for analytics. The toggle switch is turned off by default. |
"Assets" customized widget
You can use the Assets → Customized widget to get advanced asset analytics from processed events using the query builder. In the query, you must specify the asset field and the corresponding condition or set of conditions by which you want the assets to be counted (Y-axis). You can also specify one or more additional conditions (categories) to be used for comparing the number of assets for each field.
When creating the custom widget for assets, you must specify the settings described in the tables below.
Tab
The following table describes the settings on the tab.
Description of parameters
Setting |
Description |
|---|---|
Graph |
Graph type. The following graph types are available:
|
Format |
This setting is available for charts of the Stacked bar chart type. Data display format: Absolute values or Relative values, %. If you select the Absolute values format, the heights of the bars correspond to the sum of the values of the measured indicator. If you select the Relative values, % format, all bars have the same height of 100%, and the relative heights of colored zones on the bars correspond to the ratios of indicator values. By default, Absolute values is selected. |
Tenant |
The tenant for which data is displayed in the widget. You can select multiple tenants. By default, data is displayed for tenants selected in layout settings. |
Asset category |
The asset category for which the widget is displaying data. |
Search in uncategorized assets |
This setting lets you display assets that do not have a category. This check box is cleared by default. |
Select axes group of settings |
|
Y-axis |
Required setting. Asset field and the condition or set of conditions specified for this field, that define how assets are to be counted. |
Y-axis category |
Category for the selected field. Not used for a graph of the Counter type. This setting is optional for Y-axis fields whose values are enumerations (can be selected from a finite list of values). For all other fields, this parameter is required. |
Group by tenant |
This setting is available for charts of the Stacked bar chart type. Enables additional grouping of assets by tenant. If the check box is selected, assets on the chart are broken up along the X-axis into bars corresponding to individual tenants. If the check box is cleared, all assets are displayed on the same bar. This check box is cleared by default. |
Tab
The following table describes the settings on the tab.
Description of parameters
Setting |
Description |
|---|---|
Name |
Name of the widget. |
Description |
Description of the widget. |
Show total |
This setting is available for charts of the Pie chart type. Enables the display of totals in the chart, in addition to the selected categories. If this check box is enabled, the sum of the values of all specified categories is displayed in the center of the pie chart and in the legend in a separate Total column. The toggle switch is turned off by default. |
Color |
This setting is available for charts of the Counter type. The color used for displaying the information:
|
Horizontal |
Makes the histogram horizontal instead of vertical. When this option is enabled, when a widget displays a large amount of data, horizontal scrolling is not available and all available information is fit into the fixed size of the widget. If there is a lot of data to display, it is recommended to increase the widget size. |
Show legend |
Displays a legend for the analytics. The toggle switch is turned on by default. |
Show nulls in legend |
Displays parameters with a null value in the legend for analytics. The toggle switch is turned off by default. |
Decimals |
Number of decimals to which the displayed value must be rounded off. |
Scale |
Available for a Stacked bar chart. Scale for displaying data. The following values are possible:
The default is Linear. |
Other widgets
This section describes the settings of all widgets except the Events and Active lists widgets.
The set of parameters available for a widget depends on the type of graph that is displayed on the widget. The following graph types are available in KUMA:
- Pie chart ().
- Counter ().
- Table ().
- Bar chart ().
- Date Histogram ().
- Line chart.
- Stacked bar chart.
Settings for pie charts
The following table below lists the settings of a Pie chart.
Description of parameters
Setting |
Description |
|---|---|
Name |
Name of the widget. |
Description |
Description of the widget. |
Tenant |
The tenant for which data is displayed in the widget. You can select multiple tenants. By default, data is displayed for tenants selected in layout settings. |
Time period |
Period for which data is displayed in the widget. The default is As layout, meaning that data is displayed for the period selected for the layout. You can also specify a period for the widget in one of the following ways:
For details, see the Configuring a period subsection below. |
Show total |
Shows sums total of the values. |
Show legend |
Displays a legend for the analytics. The toggle switch is turned on by default. |
Show nulls in legend |
Displays parameters with a null value in the legend for analytics. The toggle switch is turned off by default. |
Decimals |
Number of decimals to which the displayed value must be rounded off. |
Settings for counters
The following table below lists the settings of a Counter.
Description of parameters
Setting |
Description |
|---|---|
Name |
Name of the widget. |
Description |
Description of the widget. |
Tenant |
The tenant for which data is displayed in the widget. You can select multiple tenants. By default, data is displayed for tenants selected in layout settings. |
Time period |
Period for which data is displayed in the widget. The default is As layout, meaning that data is displayed for the period selected for the layout. You can also specify a period for the widget in one of the following ways:
For details, see the Configuring a period subsection below. |
Settings for tables
The following table below lists the settings of a Table.
Description of parameters
Setting |
Description |
|---|---|
Name |
Name of the widget. |
Description |
Description of the widget. |
Tenant |
The tenant for which data is displayed in the widget. You can select multiple tenants. By default, data is displayed for tenants selected in layout settings. |
Time period |
Period for which data is displayed in the widget. The default is As layout, meaning that data is displayed for the period selected for the layout. You can also specify a period for the widget in one of the following ways:
For details, see the Configuring a period subsection below. |
Show data for previous period |
Enabling the display of data for the current and previous periods simultaneously. |
Color |
The color used for displaying the information:
|
Decimals |
Number of decimals to which the displayed value must be rounded off. |
Settings for Bar charts, Stacked bar charts, and Date Histograms
The table below lists the settings for the Bar chart and Date Histogram type graphs located on the tab.
Description of parameters
Setting |
Description |
|---|---|
Y-min and Y-max |
Scale of the Y axis. Negative values can be displayed on chart axes. This is due to the scaling of charts on the widget and can be fixed by setting zero as the minimum chart values instead of Auto. |
X-min and X-max |
Scale of the X axis. Negative values can be displayed on chart axes. This is due to the scaling of charts on the widget and can be fixed by setting zero as the minimum chart values instead of Auto. |
Decimals |
Number of decimals to which the displayed value must be rounded off. |
The table below lists the settings for the Bar chart, Stacked bar chart, and Date Histogram type graphs located on the tab.
Description of parameters
Setting |
Description |
|---|---|
Name |
Name of the widget. |
Description |
Description of the widget. |
Tenant |
The tenant for which data is displayed in the widget. You can select multiple tenants. By default, data is displayed for tenants selected in layout settings. |
Time period |
Period for which data is displayed in the widget. The default is As layout, meaning that data is displayed for the period selected for the layout. You can also specify a period for the widget in one of the following ways:
For details, see the Configuring a period subsection below. |
Show data for previous period |
Enables the display of data simultaneously for the current and previous periods. |
Color |
The color used for displaying the information:
|
Horizontal |
Makes the histogram horizontal instead of vertical. When this setting is enabled, all available information is fitted into the configured widget size. If the amount of data is great, you can enlarge the widget to better fit the data. |
Show total |
Shows sums total of the values. |
Show legend |
Displays a legend for the analytics. The toggle switch is turned on by default. |
Show nulls in legend |
Displays parameters with a null value in the legend for analytics. The toggle switch is turned off by default. |
Period segments length |
Duration of the segments into which you want to divide the period. Available for graphs of the Date Histogram type. |
Configuring a period
For graphs such as Pie chart, Counter, Table, Bar chart, Stacked bar chart, Date Histogram, you can configure the period for displaying data in the widget using the Period setting. By default, the data display period of the widget is the same as the data display period of the dashboard.
To configure the data display period, do one of the following:
- If necessary, change the date and time in the Time period setting in one of the following ways:
- If you want to specify an exact date, in the calendar on the left, select the start and end date of the period and click Apply.
You can select a date up to and including the current date. The date and time format depends on your browser settings. If the Date from or Date to field has a value and you have not edited the time value manually, when you select a date in the calendar, the Date from field is automatically populated with 00:00:00.000, and the Date to field with 23:59:59.999. If you have manually deleted the value in the Date from or Date to field, when you select a date in the calendar, the field is automatically populated with the current time. After you select a value in one of the fields, the focus switches to the other field. If your Date to is earlier than your Date from, this earlier value is automatically inserted into the Date from field.
- If you want to specify a relative period, select one of the available periods in the Relative period list on the right.
The period is calculated relative to the current time.
- If you want to specify a custom period, edit the value of the Date from and Date to fields.
You can enter an exact date and time in the DD.MM.YYYY HH:mm:ss.SSS format for the Russian localization and YYYY-MM-DD HH:mm:ss.SSS for the English localization or a period relative to the current time as a formula. You can also combine these methods if necessary. If you do not specify milliseconds when entering the exact date, 000 is substituted automatically. If you have edited the time in the Date from or Date to fields, picking a date in the calendar does not change the time component.
In the relative period formulas, you can use the now parameter for the current date and time and the interval parameterization language: + (only in the Date to field), -, / (rounding to the nearest), as well as time units: y (year), M (month), w (week), d (day), h (hour), m (minute), s (second). For example, you can specify the period now-5d to get data for the last five days, or now/w to get data from the beginning of the first day of the current week (00:00:00:000 UTC) to the current time (now).
The Date from field is required, and its value cannot exceed the value of the Date from field, and also cannot be earlier than 1970-01-01 (if specifying an exact date or a relative period). The Date to cannot be earlier than the Date from. If you do not specify a value in the Date from field, now is specified automatically.
KUMA stores time values in UTC, but in the user interface time is converted to the time zone of your browser. This is relevant to the relative periods: Today, Yesterday, This week, and This month. For example, if the time zone in your browser is UTC+3, and you select Today as the data display period, data will be displayed for the period from 03:00:00.000 until now, not from 00:00:00.000 until now.
If you want to take your time zone into account when selecting a relative data display period, such as Today, Yesterday, This week, or This month, you need to manually add a time offset in the Date from and Date to fields (if a value other than now is specified) by adding or subtracting the correct number of hours. For example, if your browser's time zone is UTC+3 and you want to display data for Yesterday, you need to change Date from to now-1d/d-3h and Date to to now/d-3h. If you want to display data for the Today period, you only need to change the value in the Date from field to now/d-3h.
If you need results up to 23:59:59:999 UTC of yesterday, you can use an SQL query with a filter by Timestamp or specify an exact date and time.
The bounds of the period are inclusive: for example, for the Today time range, events are displayed from the beginning (00:00:00:000 UTC) of the current day to the current time (now) inclusive, and for the Yesterday period, events are displayed from the beginning (00:00:00:000 UTC) of the previous day to 00:00:00:000 UTC of the current day. You can view the date and time of the last data update and the exact period for which the data is displayed by hovering over the period icon in the widget.
If the Show data for previous period setting is enabled for the widget, and the widget is displaying data for a relative period, the tooltip also displays the previous period. The previous period is calculated relative to the current period as start and end values of the current period minus the duration of the current period. For example, if data is updated daily and displayed for a month, but only the first 10 days of the month have passed, the previous period is taken to be the last 10 days of the previous month.
- If you want to specify an exact date, in the calendar on the left, select the start and end date of the period and click Apply.
- If you want the widget to display data for the period selected for the layout, click the Reset button. Changing the displayed period on the layout also changes the period displayed in the widget.
Displaying tenant names in "Active list" type widgets
If you want the names of tenants to be displayed in 'Active list' type widgets instead of tenant IDs, in correlation rules of the correlator, configure the function for populating the active list with information about the corresponding tenant.
The configuration process proceeds in stages:
- Export the list of tenants.
- Create a dictionary of the Table type.
- Import the list of tenants obtained at step 1 into the dictionary created at step 2 of these instructions.
- Add a local variable with the dict function for mapping the tenant name to tenant ID to the correlation rule.
Example:
- Variable:
TenantName - Value:
dict ('<Name of the previously created dictionary with tenants>', TenantID)
- Variable:
- Add a Set action to the correlation rule, which writes the value of the previously created variable to the active list in the <key>-<value> format. As the key, specify the field of the active list (for example,
Tenant), and in the value field, specify the variable (for example,$TenantName).
When this rule triggers, the name of the tenant mapped by the dict function to the ID in the tenant dictionary is placed in the active list. When creating widgets based on active lists, the widget displays the name of the tenant instead of the tenant ID.
Page top
Working with Open Single Management Platform
Open Single Management Platform (hereinafter referred to as OSMP) is an open technology platform that allows you to integrate Kaspersky applications and third-party applications into a single security system, and provide cross-application scenarios. Kaspersky Next XDR Expert is based on OSMP. To manage Kaspersky Next XDR Expert, the OSMP web interface (hereinafter referred to as OSMP Console) is used.
Using OSMP Console, you can do the following:
- Manage the status of the organization's security system.
- View information about the security of your organization's network.
- Configure the detection, hunting, and response of threats.
- Manage policies created for assets on your network.
- Manage tasks for applications installed on your network devices.
- Manage users and roles.
- Configure the migration of data to Kaspersky Next XDR Expert.
- Install Kaspersky applications on devices on your network and manage installed applications.
- Poll the network to discover client devices, and distribute the devices to administration groups manually or automatically.
- Manage Kaspersky Next XDR Expert integrations with other applications.
OSMP Console is a multi-language web interface. You can change the interface language at any time, without reopening the application.
Basic concepts
This section explains basic concepts related to Open Single Management Platform.
Administration Server
Open Single Management Platform components enable remote management of Kaspersky applications installed on client devices.
Devices with the Administration Server component installed will be referred to as Administration Servers (also referred to as Servers). Administration Servers must be protected, including physical protection, against any unauthorized access.
Administration Server is installed on a device as a service with the following set of attributes:
- With the name
kladminserver_srv - Set to start automatically when the operating system starts
- With the
kscaccount or the user account selected during the installation of Administration Server
Refer to the following topic for the full list of installation settings: Installing Open Single Management Platform.
Administration Server performs the following functions:
- Storage of the administration groups' structure
- Storage of information about the configuration of client devices
- Organization of repositories for application distribution packages
- Remote installation of applications to client devices and removal of applications
- Updating application databases and software modules of Kaspersky applications
- Management of policies and tasks on client devices
- Storage of information about events that have occurred on client devices
- Generation of reports on the operation of Kaspersky applications
- Deployment of license keys to client devices and storing information about the license keys
- Forwarding notifications about the progress of tasks (such as detection of viruses on a client device)
Naming Administration Servers in the application interface
In the interface of the OSMP Console, Administration Servers can have the following names:
- Name of the Administration Server device, for example: "device_name" or "Administration Server: device_name".
- IP address of the Administration Server device, for example: "IP_address" or "Administration Server: IP_address".
- Secondary Administration Servers and virtual Administration Servers have custom names that you specify when you connect a virtual or a secondary Administration Server to the primary Administration Server.
- If you use OSMP Console installed on a Linux device, the application displays the names of the Administration Servers that you specified as trusted in the response file.
You can connect to Administration Server by using OSMP Console.
Page top
Hierarchy of Administration Servers
Administration Servers can be arranged in a hierarchy. Each Administration Server can have several secondary Administration Servers (referred to as secondary Servers) on different nesting levels of the hierarchy. The root Administration Server can only act as a primary Server. The nesting level for secondary Servers is unrestricted. The administration groups of the primary Administration Server will then include the client devices of all secondary Administration Servers. Thus, isolated and independent sections of networks can be managed by different Administration Servers which are in turn managed by the primary Server.
In a hierarchy, a Linux-based Administration Server can work both as a primary Server and as a secondary Server. The primary Linux-based Server can manage both Linux-based and Windows-based secondary Servers. A primary Windows-based Server can manage a secondary Linux-based Server.
Virtual Administration Servers are a particular case of secondary Administration Servers.
The hierarchy of Administration Servers can be used to do the following:
- Decrease the load on Administration Server (compared to a single installed Administration Server for an entire network).
- Decrease intranet traffic and simplify work with remote offices. You do not have to establish connections between the primary Administration Server and all networked devices, which may be located, for example, in different regions. It is sufficient to install a secondary Administration Server in each network segment, distribute devices among administration groups of secondary Servers, and establish connections between the secondary Servers and the primary Server over fast communication channels.
- Distribute responsibilities among the anti-virus security administrators. All capabilities for centralized management and monitoring of the anti-virus security status in corporate networks remain available.
- Use Open Single Management Platform by service providers. The service provider only needs to install Open Single Management Platform and OSMP Console. To manage a large number of client devices of various organizations, a service provider can add secondary Administration Servers (including virtual Servers) to the hierarchy of Administration Servers.
Each device included in the hierarchy of administration groups can be connected to one Administration Server only. You must independently monitor the connection of devices to Administration Servers. Use the feature for device search in administration groups of different Servers based on network attributes.
Page top
Virtual Administration Server
Virtual Administration Server (also referred to as virtual Server) is a component of Open Single Management Platform intended for managing anti-virus protection of the network of a client organization.
Virtual Administration Server is a particular case of a secondary Administration Server and has the following restrictions as compared with a physical Administration Server:
- Virtual Administration Server can be created only on a primary Administration Server.
- Virtual Administration Server uses the primary Administration Server database in its operation. Data backup and restoration tasks, as well as update scan and download tasks, are not supported on a virtual Administration Server.
- Virtual Server does not support creation of secondary Administration Servers (including virtual Servers).
In addition, virtual Administration Server has the following restrictions:
- In the virtual Administration Server properties window, the number of sections is limited.
- To install Kaspersky applications remotely on client devices managed by the virtual Administration Server, you must make sure that Network Agent is installed on one of the client devices, in order to ensure communication with the virtual Administration Server. Upon first connection to the virtual Administration Server, the device is automatically assigned as a distribution point, thus functioning as a connection gateway between the client devices and the virtual Administration Server.
- A virtual Server can poll the network only through distribution points.
- To restart a malfunctioning virtual Server, Open Single Management Platform restarts the primary Administration Server and all virtual Administration Servers.
- Users created on a virtual Server cannot be assigned a role on the Administration Server.
The administrator of a virtual Administration Server has all privileges on this particular virtual Server.
Page top
Web Server
Open Single Management Platform Web Server (hereinafter also referred to as Web Server) is a component of Open Single Management Platform that is installed together with Administration Server. Web Server is designed for transmission, over a network, of stand-alone installation packages.
When you create a stand-alone installation package, it is automatically published on Web Server. The link for downloading the stand-alone package is displayed in the list of created stand-alone installation packages. If necessary, you can cancel publication of the stand-alone package or you can publish it on Web Server again. You can send the link to the user in any convenient way, such as by email. By using this link, the user can download the installation package to a local device.
Page top
Network Agent
Interaction between Administration Server and devices is performed by the Network Agent component of Open Single Management Platform. Network Agent must be installed on all devices on which Open Single Management Platform is used to manage Kaspersky applications.
Network Agent is installed on a device as a service, with the following set of attributes:
- With the name "Kaspersky Security Center Network Agent"
- Set to start automatically when the operating system starts
- Using the LocalSystem account
A device that has Network Agent installed is called a managed device or device. You can download the installation package for Network Agent from the following sources:
- Administration Server storage (you must have Administration Server installed)
- Kaspersky web servers
By default, Network Agent is installed in the following locations:
- For Linux:
- 32-bit systems: /opt/kaspersky/klnagent/
- 64-bit systems: /opt/kaspersky/klnagent64/
- For Windows:
- 32-bit systems: C:\Program Files\Kaspersky Lab\NetworkAgent
- 64-bit systems: C:\Program Files (x86)\Kaspersky Lab\NetworkAgent
For Windows devices, you can specify a different folder for the installation of Network Agent in the settings of the installation package. However, for Linux devices, Network Agent can only be installed in the default directory.
The Network Agent installation folder also contains utilities for managing and diagnosing the operation of Network Agent, such as the klmover and klnagchk utilities.
When you install Administration Server, the server version of Network Agent is automatically installed together with Administration Server. Nevertheless, to manage the Administration Server device as any other managed device, install Network Agent for Linux on the Administration Server device. In this case, Network Agent for Linux is installed and works independently from the server version of Network Agent that you installed together with Administration Server.
The names of the process that Network Agent starts are as follows:
- klnagent64.service (for a 64-bit operating system)
- klnagent.service (for a 32-bit operating system)
Network Agent synchronizes the managed device with the Administration Server. We recommend that you set the synchronization interval (also referred to as the heartbeat) to 15 minutes per 10,000 managed devices.
Page top
Administration groups
An administration group (hereinafter also referred to as group) is a logical set of managed devices combined on the basis of a specific trait for the purpose of managing the grouped devices as a single unit within Open Single Management Platform.
All managed devices within an administration group are configured to do the following:
- Use the same application settings (which you can specify in group policies).
- Use a common operating mode for all applications through the creation of group tasks with specified settings. Examples of group tasks include creating and installing a common installation package, updating the application databases and modules, scanning the device on demand, and enabling real-time protection.
A managed device can belong to only one administration group.
You can create hierarchies that have any degree of nesting for Administration Servers and groups. A single hierarchy level can include secondary and virtual Administration Servers, groups, and managed devices. You can move devices from one group to another without physically moving them. For example, if a worker's position in the enterprise changes from that of accountant to developer, you can move this worker's device from the Accountants administration group to the Developers administration group. Thereafter, the device will automatically receive the application settings required for developers.
Page top
Managed device
A managed device is a device running Linux, Windows, or macOS and which has Network Agent installed. You can manage such devices by creating tasks and policies for applications installed on these devices. You can also receive reports from managed devices.
You can make a managed device function as a distribution point and as a connection gateway.
A device can be managed by only one Administration Server. The number of devices that can be managed by one Administration Server depends on configuration of the device that hosts the Administration Server and on DBMS restrictions.
Unassigned device
An unassigned device is a device on the network that has not been included in any administration group. You can perform some actions on unassigned devices, for example, move them to administration groups or install applications on them.
When a new device is discovered on your network, this device goes to the Unassigned devices administration group. You can configure rules for devices to be moved automatically to other administration groups after the devices are discovered.
Page top
Administrator's workstation
Devices on which OSMP Console Server is installed are referred to as administrator's workstations. Administrators can use these devices for centralized remote management of Kaspersky applications installed on client devices.
There are no restrictions on the number of administrator's workstations. From any administrator's workstation, you can manage administration groups of several Administration Servers on the network at once. You can connect an administrator's workstation to an Administration Server (physical or virtual) of any level of the hierarchy.
You can include an administrator's workstation in an administration group as a client device.
Within the administration groups of any Administration Server, the same device can function as an Administration Server client, an Administration Server, or an administrator's workstation.
Page top
Management web plug-in
A special component—the management web plug-in—is used for remote administration of Kaspersky software by means of OSMP Console. Hereinafter, a management web plug-in is also referred to as a management plug-in. A management plug-in is an interface between OSMP Console and a specific Kaspersky application. With a management plug-in, you can configure tasks and policies for the application.
The management plug-in provides the following:
- Interface for creating and editing application tasks and settings
- Interface for creating and editing policies and policy profiles for remote and centralized configuration of Kaspersky applications and devices
- Transmission of events generated by the application
- OSMP Console functions for displaying operational data and events of the application, and statistics relayed from client devices
Policies
A policy is a set of Kaspersky application settings that are applied to an administration group and its subgroups. You can install several Kaspersky applications on the devices of an administration group. Kaspersky Security Center provides a single policy for each Kaspersky application in an administration group. A policy has one of the following statuses:
The status of the policy
Status |
Description |
|---|---|
Active |
The current policy that is applied to the device. Only one policy may be active for a Kaspersky application in each administration group. Devices apply the settings values of an active policy for a Kaspersky application. |
Inactive |
A policy that is not currently applied to a device. |
Out-of-office |
If this option is selected, the policy becomes active when the device leaves the corporate network. |
Policies function according to the following rules:
- Multiple policies with different values can be configured for a single application.
- Only one policy can be active for the current application.
- A policy can have child policies.
Generally, you can use policies as preparations for emergency situations, such as a virus attack. For example, if there is an attack via flash drives, you can activate a policy that blocks access to flash drives. In this case, the current active policy automatically becomes inactive.
In order to prevent maintaining multiple policies, for example, when different occasions assume changing of several settings only, you may use policy profiles.
A policy profile is a named subset of policy settings values that replaces the settings values of a policy. A policy profile affects the effective settings formation on a managed device. Effective settings are a set of policy settings, policy profile settings, and local application settings that are currently applied for the device.
Policy profiles function according to the following rules:
- A policy profile takes effect when a specific activation condition occurs.
- Policy profiles contain values of settings that differ from the policy settings.
- Activation of a policy profile changes the effective settings of the managed device.
- A policy can include a maximum of 100 policy profiles.
Policy profiles
Sometimes it may be necessary to create several instances of a single policy for different administration groups; you might also want to modify the settings of those policies centrally. These instances might differ by only one or two settings. For example, all the accountants in an enterprise work under the same policy—but senior accountants are allowed to use flash drives, while junior accountants are not. In this case, applying policies to devices only through the hierarchy of administration groups can be inconvenient.
To help you avoid creating several instances of a single policy, Open Single Management Platform enables you to create policy profiles. Policy profiles are necessary if you want devices within a single administration group to run under different policy settings.
A policy profile is a named subset of policy settings. This subset is distributed on target devices together with the policy, supplementing it under a specific condition called the profile activation condition. Profiles only contain settings that differ from the "basic" policy, which is active on the managed device. Activation of a profile modifies the settings of the "basic" policy that were initially active on the device. The modified settings take values that have been specified in the profile.
Tasks
Open Single Management Platform manages Kaspersky security applications installed on devices by creating and running tasks. Tasks are required for installing, launching, and stopping applications, scanning files, updating databases and software modules, and performing other actions on applications.
Tasks for a specific application can be created only if the management plug-in for that application is installed.
Tasks can be performed on the Administration Server and on devices.
The following tasks are performed on the Administration Server:
- Automatic distribution of reports
- Downloading of updates to the repository of the Administration Server
- Backup of Administration Server data
- Maintenance of the database
The following types of tasks are performed on devices:
- Local tasks—Tasks that are performed on a specific device
Local tasks can be modified either by the administrator, by using OSMP Console, or by the user of a remote device (for example, through the security application interface). If a local task has been modified simultaneously by the administrator and the user of a managed device, the changes made by the administrator will take effect because they have a higher priority.
- Group tasks—Tasks that are performed on all devices of a specific group
Unless otherwise specified in the task properties, a group task also affects all subgroups of the selected group. A group task also affects (optionally) devices that have been connected to secondary and virtual Administration Servers deployed in the group or any of its subgroups.
- Global tasks—Tasks that are performed on a set of devices, regardless of whether they are included in any group
For each application, you can create any number of group tasks, global tasks, or local tasks.
You can make changes to the settings of tasks, view the progress of tasks, and copy, export, import, and delete tasks.
A task is started on a device only if the application for which the task was created is running.
Results of tasks are saved in the Syslog event log and the Open Single Management Platform event log, both centrally on the Administration Server and locally on each device.
Do not include private data in task settings. For example, avoid specifying the domain administrator password.
Page top
Task scope
The scope of a task is the set of devices on which the task is performed. The types of scope are as follows:
- For a local task, the scope is the device itself.
- For an Administration Server task, the scope is the Administration Server.
- For a group task, the scope is the list of devices included in the group.
When creating a global task, you can use the following methods to specify its scope:
- Specifying certain devices manually.
You can use an IP address (or IP range) or DNS name as the device address.
- Importing a list of devices from a .txt file with the device addresses to be added (each address must be placed on an individual line).
If you import a list of devices from a file or create a list manually, and if devices are identified by their names, the list can only contain devices for which information has already been entered into the Administration Server database. Moreover, the information must have been entered when those devices were connected or during device discovery.
- Specifying a device selection.
Over time, the scope of a task changes as the set of devices included in the selection change. A selection of devices can be made on the basis of device attributes, including software installed on a device, and on the basis of tags assigned to devices. Device selection is the most flexible way to specify the scope of a task.
Tasks for device selections are always run on a schedule by the Administration Server. These tasks cannot be run on devices that lack connection to the Administration Server. Tasks whose scope is specified by using other methods are run directly on devices and therefore do not depend on the device connection to the Administration Server.
Tasks for device selections are not run on the local time of a device; instead, they are run on the local time of the Administration Server. Tasks whose scope is specified by using other methods are run on the local time of a device.
How local application settings relate to policies
You can use policies to set identical values of the application settings for all devices in a group.
The values of the settings that a policy specifies can be redefined for individual devices in a group by using local application settings. You can set only the values of settings that the policy allows to be modified, that is, the unlocked settings.
The value of a setting that the application uses on a client device is defined by the lock position ( ) for that setting in the policy:
- If a setting modification is locked, the same value (defined in the policy) is used on all client devices.
- If a setting modification is unlocked, the application uses a local setting value on each client device instead of the value specified in the policy. The setting can then be changed in the local application settings.
This means that, when a task is run on a client device, the application applies settings that have been defined in two different ways:
- By task settings and local application settings, if the setting is not locked against changes in the policy.
- By the group policy, if the setting is locked against changes.
Local application settings are changed after the policy is first applied in accordance with the policy settings.
Distribution point
Distribution point (previously known as update agent) is a device with Network Agent installed that is used for update distribution, remote installation of applications, and retrieval of information about networked devices.
The features and use cases of Network Agent installed on a device used as a distribution point vary depending on the operating system.
A distribution point can perform the following functions:
- Distribute updates and installation packages received from the Administration Server to client devices within the group (including distribution through multicasting using UDP). Updates can be received either from the Administration Server or from Kaspersky update servers. In the latter case, an update task must be created for the distribution point.
Distribution points accelerate update distribution and free up Administration Server resources.
- Distribute policies and group tasks through multicasting using UDP.
- Act as a gateway for connection to the Administration Server for devices in an administration group.
If a direct connection between managed devices within the group and the Administration Server cannot be established, you can use the distribution point as a connection gateway to the Administration Server for this group. In this case, managed devices connect to the connection gateway, which in turn connects to the Administration Server.
The presence of a distribution point that functions as connection gateway does not block the option of a direct connection between managed devices and the Administration Server. If the connection gateway is not available, but direct connection with the Administration Server is technically possible, managed devices are connected to the Administration Server directly.
- Poll the network to detect new devices and update information about existing ones. A distribution point can apply the same device discovery methods as the Administration Server.
- Perform remote installation of applications by Kaspersky and other software vendors, including installation on client devices without Network Agent.
This feature allows you to remotely transfer Network Agent installation packages to client devices located on networks to which the Administration Server has no direct access.
- Act as a proxy server participating in Kaspersky Security Network (KSN).
You can enable KSN proxy server on distribution point side to make the device act as a KSN proxy server. In this case, the KSN proxy service is run on the device.
Files are transmitted from the Administration Server to a distribution point over HTTP or, if SSL connection is enabled, over HTTPS. Using HTTP or HTTPS results in a higher level of performance, compared to SOAP, through cutting traffic.
Devices with Network Agent installed can be assigned distribution points either manually (by the administrator), or automatically (by the Administration Server). The full list of distribution points for specified administration groups is displayed in the report about the list of distribution points.
The scope of a distribution point is the administration group to which it has been assigned by the administrator, as well as its subgroups of all levels of embedding. If multiple distribution points have been assigned in the hierarchy of administration groups, Network Agent on the managed device connects to the nearest distribution point in the hierarchy.
If distribution points are assigned automatically by the Administration Server, it assigns them by broadcast domains, not by administration groups. This occurs when all broadcast domains are known. Network Agent exchanges messages with other Network Agents in the same subnet and then sends Administration Server information about itself and other Network Agents. Administration Server can use that information to group Network Agents by broadcast domains. Broadcast domains are known to Administration Server after more than 70% Network Agents in administration groups are polled. Administration Server polls broadcast domains every two hours. After distribution points are assigned by broadcast domains, they cannot be re-assigned by administration groups.
If the administrator manually assigns distribution points, they can be assigned to administration groups or network locations.
Network Agents with an active connection profile do not participate in broadcast domain detection.
Open Single Management Platform assigns each Network Agent a unique IP multicast address that differs from every other address. This allows you to avoid network overload that might occur due to IP overlaps. IP multicast addresses that were assigned in previous versions of the application will not be changed.
If two or more distribution points are assigned to a single network area or to a single administration group, one of them becomes the active distribution point, and the rest become standby distribution points. The active distribution point downloads updates and installation packages directly from the Administration Server, while standby distribution points receive updates from the active distribution point only. In this case, files are downloaded once from the Administration Server and then are distributed among distribution points. If the active distribution point becomes unavailable for any reason, one of the standby distribution points becomes active. The Administration Server automatically assigns a distribution point to act as standby.
The distribution point status (Active/Standby) is displayed with a check box in the klnagchk report.
A distribution point requires at least 4 GB of free disk space. If the free disk space of the distribution point is less than 2 GB, Open Single Management Platform creates a security issue with the Warning importance level. The security issue will be published in the device properties, in the Security issues section.
Running remote installation tasks on a device assigned as a distribution point requires additional free disk space. The volume of free disk space must exceed the total size of all installation packages to be installed.
Running any updating (patching) tasks and vulnerability fix tasks on a device assigned as a distribution point requires additional free disk space. The volume of free disk space must be at least twice the total size of all patches to be installed.
Devices functioning as distribution points must be protected, including physical protection, against any unauthorized access.
Page top
Connection gateway
A connection gateway is a Network Agent acting in a special mode. A connection gateway accepts connections from other Network Agents and tunnels them to the Administration Server through its own connection with the Server. Unlike an ordinary Network Agent, a connection gateway waits for connections from the Administration Server rather than establishes connections to the Administration Server.
A connection gateway can receive connections from up to 10,000 devices.
You have two options for using connection gateways:
- We recommend that you install a connection gateway in a demilitarized zone (DMZ). For other Network Agents installed on out-of-office devices, you need to specially configure a connection to Administration Server through the connection gateway.
A connection gateway does not in any way modify or process data that is transmitted from Network Agents to Administration Server. Moreover, it does not write this data into any buffer and therefore cannot accept data from a Network Agent and later forward it to Administration Server. If Network Agent attempts to connect to Administration Server through the connection gateway, but the connection gateway cannot connect to Administration Server, Network Agent perceives this as if Administration Server is inaccessible. All data remains on Network Agent (not on the connection gateway).
A connection gateway cannot connect to Administration Server through another connection gateway. It means that Network Agent cannot simultaneously be a connection gateway and use a connection gateway to connect to Administration Server.
All connection gateways are included in the list of distribution points in the Administration Server properties.
- You can also use connection gateways within the network. For example, automatically assigned distribution points also become connection gateways in their own scope. However, within an internal network, connection gateways do not provide considerable benefit. They reduce the number of network connections received by Administration Server, but do not reduce the volume of incoming data. Even without connection gateways, all devices could still connect to Administration Server.
Configuring Administration Server
This section describes the configuration process and properties of Kaspersky Security Center Administration Server.
Configuring the connection of OSMP Console to Administration Server
You can configure the connection of OSMP Console to Administration Server through the Administration Server properties or by using the Administration Server policy settings.
To set the connection ports through the Administration Server properties:
- In the main menu, click the settings icon (
 ) next to the name of the required Administration Server.
 The Administration Server properties window opens.
- On the General tab, select the Connection ports section.
- If necessary, specify the SSL port for Web Console setting or specify other Administration Server connection ports.
The main connection settings of the selected Server are specified.
To set the connection ports through the Administration Server policy settings:
- In the main menu, go to Assets (Devices) → Policies & profiles.
- Click the name of the Administration Server policy, and then go to the Application settings tab.
- If necessary, specify the SSL port for Web Console setting or specify other Administration Server connection ports.
If you disable the Open port for Web Console option and this policy setting will be applied to the device, you will not be able to connect to the Administration Server by using OSMP Console. In this case, the connection will be terminated. If you have an Administration Server on which this policy is not applied, you can reconnect to this Administration Server through OSMP Console.
The main connection settings of the selected Server are specified.
Page top
Configuring internet access settings
An internet connection is required for proper operation of Kaspersky Next XDR Expert components and can be used for specific integrations, both Kaspersky and third-party. For example, you must configure internet access for Administration Server to use Kaspersky Security Network and to download updates of anti-virus databases for Open Single Management Platform and managed Kaspersky applications.
The integration settings of some Kaspersky applications contain an option to enable or disable the usage of proxy server. For example, such an option is available when you configure integration with Kaspersky Threat Intelligence Portal.
To specify the internet access settings:
- In the main menu, click the settings icon () next to the Administration Server name.
The Administration Server properties window opens.
- On the General tab, select the Configuring internet access section.
- Enable the Use proxy server option if you want to use a proxy server when connecting to the internet. If this option is enabled, the fields are available for entering settings. Specify the following settings for a proxy server connection:
Certificates for work with Open Single Management Platform
This section contains information about Open Single Management Platform certificates and describes how to issue and replace certificates for OSMP Console and how to renew a certificate for Administration Server if the Server interacts with OSMP Console.
About Open Single Management Platform certificates
Open Single Management Platform uses the following types of certificates to enable a secure interaction between the application components:
- Administration Server certificate
- OSMP Console Server certificate
- OSMP Console certificate
By default, Open Single Management Platform uses self-signed certificates (that is, issued by Open Single Management Platform itself), but you can replace them with custom certificates to better meet the requirements of your organization's network and comply with the security standards. After Administration Server verifies whether a custom certificate meets all applicable requirements, this certificate assumes the same functional scope as a self-signed certificate. The only difference is that a custom certificate is not reissued automatically upon expiration. You replace certificates with custom ones by means of the klsetsrvcert utility or through the Administration Server properties section in OSMP Console, depending on the certificate type. When you use the klsetsrvcert utility, you need to specify a certificate type by using one of the following values:
- C—Common certificate for ports 13000 and 13291.
- CR—Common reserve certificate for ports 13000 and 13291.
The maximum validity period for any of the Administration Server certificates must be 397 days or less.
Administration Server certificates
An Administration Server certificate is required for the following purposes:
- Authentication of Administration Server when connecting to OSMP Console
- Secure interaction between Administration Server and Network Agent on managed devices
- Authentication when the primary Administration Servers are connected to secondary Administration Servers
The Administration Server certificate is created automatically during installation of the Administration Server component and it is stored in the /var/opt/kaspersky/klnagent_srv/1093/cert/ folder. You specify the Administration Server certificate when you create a response file to install OSMP Console. This certificate is called common ("C").
The Administration Server certificate is valid for 397 days. Open Single Management Platform automatically generates a common reserve ("CR") certificate 90 days before the expiration of the common certificate. The common reserve certificate is subsequently used for seamless replacement of the Administration Server certificate. When the common certificate is about to expire, the common reserve certificate is used to maintain the connection with Network Agent instances installed on managed devices. With this purpose, the common reserve certificate automatically becomes the new common certificate 24 hours before the old common certificate expires.
The maximum validity period for any of the Administration Server certificates must be 397 days or less.
If necessary, you can assign a custom certificate for the Administration Server. For example, this may be necessary for better integration with the existing PKI of your enterprise or for custom configuration of the certificate fields. When replacing the certificate, all Network Agents that were previously connected to Administration Server through SSL will lose their connection and will return "Administration Server authentication error." To eliminate this error, you will have to restore the connection after the certificate replacement.
If the Administration Server certificate is lost, you must reinstall the Administration Server component, and then restore the data in order to recover it.
You can also back up the Administration Server certificate separately from other Administration Server settings in order to move Administration Server from one device to another without data loss.
Mobile certificates
A mobile certificate ("M") is required for authentication of the Administration Server on mobile devices. You specify the mobile certificate in the Administration Server properties.
Also, a mobile reserve ("MR") certificate exists: it is used for seamless replacement of the mobile certificate. Open Single Management Platform automatically generates this certificate 60 days before the expiration of the common certificate. When the mobile certificate is about to expire, the mobile reserve certificate is used to maintain the connection with Network Agent instances installed on managed mobile devices. With this purpose, the mobile reserve certificate automatically becomes the new mobile certificate 24 hours before the old mobile certificate expires.
If the connection scenario requires the use of a client certificate on mobile devices (connection involving two-way SSL authentication), you can generate those certificates by means of the certificate authority for auto-generated user certificates ("MCA"). Also, in the Administration Server properties, you can specify custom client certificates issued by a different certification authority, while integration with the domain Public Key Infrastructure (PKI) of your organization enables you to issue client certificates by means of your domain certification authority.
Web Server certificate
Web Server, a component of Kaspersky Security Center Administration Server, uses a special type of certificate. This certificate is required for publishing Network Agent installation packages that you subsequently download to managed devices. For this purpose, Web Server can use various certificates.
Web Server uses one of the following certificates, in order of priority:
- Custom Web Server certificate that you specified manually by means of OSMP Console
- Common Administration Server certificate ("C")
OSMP Console certificate
The OSMP Console Server has its own certificate. When you open a website, a browser verifies whether your connection is trusted. The Web Console certificate allows you to authenticate the Web Console and is used to encrypt traffic between a browser and the Web Console.
When you open the Web Console, the browser may inform you that the connection to the OSMP Console is not private and the OSMP Console certificate is invalid. This warning appears because the OSMP Console certificate is self-signed and automatically generated by Open Single Management Platform. To remove this warning, you can do one of the following:
- Replace the Web Console certificate with a custom one (recommended option). Create a certificate that is trusted in your infrastructure and that meets the requirements for custom certificates.
- Add the Web Console certificate to the list of trusted browser certificates. We recommend that you use this option only if you cannot create a custom certificate.
Requirements for custom certificates used in Open Single Management Platform
The table below shows the requirements for custom certificates specified for different components of Open Single Management Platform.
Requirements for Open Single Management Platform certificates
Certificate type |
Requirements |
Comments |
|---|---|---|
Common certificate, Common reserve certificate ("C", "CR") |
Minimum key length: 2048. Basic constraints:
Key Usage:
Extended Key Usage (optional): server authentication, client authentication. |
Extended Key Usage parameter is optional. Path Length Constraint value may be an integer different from "None," but not less than 1. |
Web Server certificate |
Extended Key Usage: server authentication. The PKCS #12 / PEM container from which the certificate is specified includes the entire chain of public keys. The Subject Alternative Name (SAN) of the certificate is present; that is, the value of the The certificate meets the effective requirements of web browsers imposed on server certificates, as well as the current baseline requirements of the CA/Browser Forum. |
|
OSMP Console certificate |
The PEM container from which the certificate is specified includes the entire chain of public keys. The Subject Alternative Name (SAN) of the certificate is present; that is, the value of the The certificate meets the effective requirements of web browsers to server certificates, as well as the current baseline requirements of the CA/Browser Forum. |
Encrypted certificates are not supported by OSMP Console. |
Reissuing the certificate for OSMP Console
Most browsers impose a limit on the validity term of a certificate. To fall within this limit, the validity term of the OSMP Console certificate is limited to 397 days. You can replace an existing certificate received from a certification authority (CA) by issuing a new self-signed certificate manually. Alternatively, you can reissue your expired OSMP Console certificate.
Automatically reissuing the certificate for OSMP Console is not supported. You have to manually reissue the expired certificate.
When you open the OSMP Console, the browser may inform you that the connection to the OSMP Console is not private and the OSMP Console certificate is invalid. This warning appears because the OSMP Console certificate is self-signed and automatically generated by Open Single Management Platform. To remove or prevent this warning, you can do one of the following:
- Specify a custom certificate when you reissue it (recommended option). Create a certificate that is trusted in your infrastructure and that meets the requirements for custom certificates.
- Add the OSMP Console certificate to the list of trusted browser certificates after you reissue the certificate. We recommend that you use this option only if you cannot create a custom certificate.
To reissue the expired OSMP Console certificate:
Reinstall OSMP Console by performing one of the following:
- If you want to use the same installation file of OSMP Console, remove OSMP Console, and then install the same OSMP Console version.
- If you want to use an installation file of an upgraded version, run the upgrade command.
The OSMP Console certificate is reissued for another validity term of 397 days.
Page top
Replacing certificate for OSMP Console
By default, when you install OSMP Console Server (also referred to as OSMP Console), a browser certificate for the application is generated automatically. You can replace the automatically generated certificate with a custom one.
To replace the certificate for OSMP Console with a custom one:
- Create a new response file required for the OSMP Console installation.
- In this file, specify paths to the custom certificate file and the key file by using the
certPathparameter and thekeyPathparameter. - Reinstall OSMP Console by specifying the new response file. Do one of the following:
- If you want to use the same installation file of OSMP Console, remove OSMP Console, and then install the same OSMP Console version.
- If you want to use an installation file of an upgraded version, run the upgrade command.
OSMP Console works with the specified certificate.
Page top
Converting a PFX certificate to the PEM format
To use a PFX certificate in OSMP Console, you must first convert it to the PEM format by using any convenient OpenSSL-based cross-platform utility.
To convert a PFX certificate to the PEM format in the Linux operating system:
- In an OpenSSL-based cross-platform utility, execute the following commands:
openssl pkcs12 -in <filename.pfx> -clcerts -nokeys | sed -ne '/-BEGIN CERTIFICATE-/,/-END CERTIFICATE-/p' > server.crtopenssl pkcs12 -in <filename.pfx> -nocerts -nodes | sed -ne '/-BEGIN PRIVATE KEY-/,/-END PRIVATE KEY-/p' > key.pem - Make sure that the certificate file and the private key are generated to the same directory where the .pfx file is stored.
- OSMP Console does not support passphrase-protected certificates. Therefore, run the following command in an OpenSSL-based cross-platform utility to remove a passphrase from the .pem file:
openssl rsa -in key.pem -out key-without-passphrase.pemDo not use the same name for the input and output .pem files.
As a result, the new .pem file is unencrypted. You do not have to enter a passphrase to use it.
The .crt and .pem files are ready to use, so you can specify them in the OSMP Console installer.
Page top
Scenario: Specifying the custom Administration Server certificate
You can assign the custom Administration Server certificate, for example, for better integration with the existing public key infrastructure (PKI) of your enterprise or for custom configuration of the certificate fields. It is useful to replace the certificate immediately after installation of Administration Server.
The maximum validity period for any of the Administration Server certificates must be 397 days or less.
Prerequisites
The new certificate must be created in the PKCS#12 format (for example, by means of the organization's PKI) and must be issued by trusted certification authority (CA). Also, the new certificate must include the entire chain of trust and a private key, which must be stored in the file with the pfx or p12 extension. For the new certificate, the requirements listed below must be met.
Certificate type: Common certificate, common reserve certificate ("C", "CR")
Requirements:
- Minimum key length: 2048
- Basic constraints:
- CA: true
- Path Length Constraint: None
Path Length Constraint value may be an integer different from "None" but not less than 1.
- Key Usage:
- Digital signature
- Certificate signing
- Key encipherment
- CRL Signing
- Extended Key Usage (EKU): server authentication and client authentication. The EKU is optional, but if your certificate contains it, the server and client authentication data must be specified in the EKU.
Certificates issued by a public CA do not have the certificate signing permission. To use such certificates, make sure that you installed Network Agent version 13 or later on distribution points or connection gateways in your network. Otherwise, you will not be able to use certificates without the signing permission.
Stages
Specifying the Administration Server certificate proceeds in stages:
- Replacing the Administration Server certificate
Use the command-line klsetsrvcert utility for this purpose.
- Specifying a new certificate and restoring connection of Network Agents to the Administration Server
When the certificate is replaced, all Network Agents that were previously connected to Administration Server through SSL lose their connection and return "Administration Server authentication error." To specify the new certificate and restore the connection, use the command-line klmover utility.
Results
When you finish the scenario, the Administration Server certificate is replaced and the server is authenticated by Network Agents on the managed devices.
Replacing the Administration Server certificate by using the klsetsrvcert utility
To replace the Administration Server certificate,
On the administrator host where the KDT utility is located, run the following command:
where:
<path_to_new_certificate>is the path to the container with the certificate and a private key in the PKCS #12 format (file with the .P12 or .PFX extension).<password>is the password used for protection of the PKCS #12 container. The certificate and a private key are stored in the container, therefore, the password is required to decrypt the file with the container.
By default, certificate validation parameters are not specified, a custom certificate without signing permission is used. You can replace the common certificate for port 13000.
You do not need to download the klsetsrvcert utility. It is included in the Kubernetes cluster and is not available for direct running. You can run the klsetsrvcert utility only by using KDT from the administrator host.
Connecting Network Agents to Administration Server by using the klmover utility
After you replace the Administration Server certificate by using the command-line klsetsrvcert utility, you need to establish the SSL connection between Network Agents and Administration Server because the connection is broken.
To specify the new Administration Server certificate and restore the connection:
From the command line, run the following utility:
This utility is automatically copied to the Network Agent installation folder, when Network Agent is installed on a client device.
The description of the klmover utility parameters is presented in the table below.
Values of the klmover utility parameters
Parameter |
Value |
|---|---|
|
Address of the Administration Server for connection. You can specify an IP address or the DNS name. |
|
Number of the port through which non-encrypted connection to the Administration Server is established. The default port number is 14000. |
|
Number of the SSL port through which encrypted connection to the Administration Server is established by using SSL. The default port number is 13000. For the root Administration Server, this port is 13000 and it cannot be changed. |
|
Use non-encrypted connection to the Administration Server. If the key is not in use, Network Agent is connected to the Administration Server by using encrypted SSL protocol. |
|
Use the specified certificate file for authentication of access to Administration Server. |
Hierarchy of Administration Servers
Some client companies, for example MSP, may run multiple Administration Servers. It can be inconvenient to administer several separate Administration Servers, so a hierarchy can be applied. Each Administration Server can have several secondary Administration Servers on different nesting levels of the hierarchy. The root Administration Server can only act as a primary Server.
In a hierarchy, a Linux-based Administration Server can work both as a primary Server and as a secondary Server. The primary Linux-based Server can manage both Linux-based and Windows-based secondary Servers. A primary Windows-based Server can manage a secondary Linux-based Server.
A "primary/secondary" configuration for two Administration Servers provides the following options:
- A secondary Administration Server inherits policies, tasks, user roles, and installation packages from the primary Administration Server, thus preventing duplication of settings.
- Selections of devices on the primary Administration Server can include devices from secondary Administration Servers.
- Reports and event selections on the primary Administration Server can contain data (including detailed information) from secondary Administration Servers.
- A primary Administration Server can be used as a source of updates for a secondary Administration Server.
The primary Administration Server only receives data from non-virtual secondary Administration Servers within the scope of the options listed above. This limitation does not apply to virtual Administration Servers, which share the database with their primary Administration Server.
Page top
Creating a hierarchy of Administration Servers: adding a secondary Administration Server
In a hierarchy, a Linux-based Administration Server can work both as a primary Server and as a secondary Server. The primary Linux-based Server can manage both Linux-based and Windows-based secondary Servers. A primary Windows-based Server can manage a secondary Linux-based Server. The root Administration Server can only act as a primary Server.
You can add an Administration Server as a secondary Administration Server, thus establishing a "primary/secondary" hierarchy.
To add a secondary Administration Server that is available for connection through OSMP Console:
- Make sure that port 13000 of the future primary Administration Server is available for receipt of connections from secondary Administration Servers.
- On the future primary Administration Server, click the settings icon ().
- On the properties page that opens, click the Administration Servers tab.
- Select the check box next to the name of the administration group to which you want to add the Administration Server.
- In the menu line, click Connect secondary Administration Server.
The Add secondary Administration Server wizard starts. Proceed through the wizard by using the Next button.
- Fill in the following fields:
- Specify the certificate of the future secondary Server.
The wizard is complete.
- Send the certificate file of the future primary Administration Server to the system administrator of the office where the future secondary Administration Server is located. (You can, for example, write the file to an external device, such as a flash drive, or send it by email.)
The certificate file is located on the future primary Administration Server, at /var/opt/kaspersky/klnagent_srv/1093/cert/.
- Prompt the system administrator in charge of the future secondary Administration Server to do the following:
- Click the settings icon ().
- On the properties page that opens, proceed to the Hierarchy of Administration Servers section of the General tab.
- Select the This Administration Server is secondary in the hierarchy option.
The root Administration Server can only act as a primary Server.
- In the Primary Administration Server address field, enter the network name of the future primary Administration Server.
- Select the previously saved file with the certificate of the future primary Administration Server by clicking Browse.
- If necessary, select the Connect primary Administration Server to secondary Administration Server in DMZ check box.
- If the connection to the future primary Administration Server is performed through a proxy server, select the Use proxy server option and specify the connection settings.
- Click Save.
- Click the settings icon (
The "primary/secondary" hierarchy is built. The primary Administration Server starts receiving connection from the secondary Administration Server using port 13000. The tasks and policies from the primary Administration Server are received and applied. The secondary Administration Server is displayed on the primary Administration Server, in the administration group where it was added.
Page top
Viewing the list of secondary Administration Servers
To view the list of the secondary (including virtual) Administration Servers:
In the main menu, click the name of the Administration Server, which is next to the settings icon (![]() ).
).
The drop-down list of the secondary (including virtual) Administration Servers is displayed.
You can proceed to any of these Administration Servers by clicking its name.
The administration groups are shown, too, but they are grayed and not available for management in this menu.
If you are connected to your primary Administration Server in OSMP Console, and can not connect to a virtual Administration Server that is managed by a secondary Administration Server, you can use one of the following ways:
- Modify the existing OSMP Console installation to add the secondary Server to the list of trusted Administration Servers. Then you will be able to connect to the virtual Administration Server in OSMP Console.
- Use OSMP Console to connect directly to the secondary Administration Server where the virtual Server was created. Then you will be able to switch to the virtual Administration Server in OSMP Console.
Managing virtual Administration Servers
This section describes the following actions to manage virtual Administration Servers:
- Create virtual Administration Servers
- Enable and disable virtual Administration Servers
- Assign an administrator for a virtual Administration Server
- Change the Administration Server for client devices
- Delete virtual Administration Servers
Creating a virtual Administration Server
You can create virtual Administration Servers and add them to administration groups.
To create and add a virtual Administration Server:
- In the main menu, click the settings icon () next to the name of the required Administration Server.
- On the page that opens, proceed to the Administration Servers tab.
- Select the administration group to which you want to add a virtual Administration Server.
The virtual Administration Server will manage devices from the selected group (including the subgroups). - On the menu line, click New virtual Administration Server.
- On the page that opens, define the properties of the new virtual Administration Server:
- Name of virtual Administration Server.
- Administration Server connection address
You can specify the name or the IP address of your Administration Server.
- From the list of users, select the virtual Administration Server administrator. If you want, you can edit one of the existing accounts before assigning it the administrator's role, or create a new user account.
If necessary, you can create a new account that will act as a virtual Administration Server administrator by using the kladduser utility. To do that, use the following command:
kladduser -n <user_name> -p <password> -vs <virtual_server_name>where
virtual_server_nameis the name of the virtual Administration Server. - Click Save.
The new virtual Administration Server is created, added to the administration group and displayed on the Administration Servers tab.
If you are connected to your primary Administration Server in OSMP Console, and can not connect to a virtual Administration Server that is managed by a secondary Administration Server, you can use one of the following ways:
- Modify the existing OSMP Console installation to add the secondary Server to the list of trusted Administration Servers. Then you will be able to connect to the virtual Administration Server in OSMP Console.
- Use OSMP Console to connect directly to the secondary Administration Server where the virtual Server was created. Then you will be able to switch to the virtual Administration Server in OSMP Console.
Enabling and disabling a virtual Administration Server
When you create a new virtual Administration Server, it is enabled by default. You can disable or enable it again at any time. Disabling or enabling a virtual Administration Server is equal to switching off or on a physical Administration Server.
To enable or disable a virtual Administration Server:
- In the main menu, click the settings icon () next to the name of the required Administration Server.
- On the page that opens, proceed to the Administration Servers tab.
- Select the virtual Administration Server that you want to enable or disable.
- On the menu line, click the Enable / disable virtual Administration Server button.
The virtual Administration Server state is changed to enabled or disabled, depending on its previous state. The updated state is displayed next to the Administration Server name.
Assigning an administrator for a virtual Administration Server
When you use virtual Administration Servers in your organization, you might want to assign a dedicated administrator for each virtual Administration Server. For example, this might be useful when you create virtual Administration Servers to manage separate offices or departments of your organization, or if you are an MSP provider and you manage your tenants through virtual Administration Servers.
When you create a virtual Administration Server, it inherits the user list and all of the user rights of the primary Administration Server. If a user has access rights to the primary Server, this user has access rights to the virtual Server as well. After creation, you configure the access rights to the Servers independently. If you want to assign an administrator for a virtual Administration Server only, make sure that the administrator does not have access rights on the primary Administration Server.
You assign an administrator for a virtual Administration Server by granting the administrator access rights to the virtual Administration Server. You can grant the required access rights in one of the following ways:
- Configure access rights for the administrator manually
- Assign one or more user roles for the administrator
To sign in to OSMP Console, an administrator of a virtual Administration Server specifies the virtual Administration Server name, user name, and password. OSMP Console authenticates the administrator and opens the virtual Administration Server to which the administrator has access rights. The administrator cannot switch between Administration Servers.
Prerequisites
Before you start, ensure that the following conditions are met:
- The virtual Administration Server is created.
- On the primary Administration Server, you have created an account for the administrator that you want to assign for the virtual Administration Server.
- You have the Modify object ACLs right in the General features → User permissions functional area.
Configuring access rights manually
To assign an administrator for a virtual Administration Server:
- In the main menu, switch to the required virtual Administration Server:
- Click the chevron icon (
 ) to the right of the current Administration Server name.
 - Select the required Administration Server.
- Click the chevron icon (
- In the main menu, click the settings icon () next to the name of the Administration Server.
The Administration Server properties window opens.
- On the Access rights tab, click the Add button.
A unified list of users of the primary Administration Server and the current virtual Administration Server opens.
- From the list of users, select the account of the administrator that you want to assign for the virtual Administration Server, and then click the OK button.
The application adds the selected user to the user list on the Access rights tab.
- Select the check box next to the added account, and then click the Access rights button.
- Configure the rights that the administrator will have on the virtual Administration Server.
For successful authentication, at minimum, the administrator must have the following rights:
- Read right in the General features → Basic functionality functional area
- Read right in the General features → Virtual Administration Servers functional area
The application saves the modified user rights to the administrator account.
Configuring access rights by assigning user roles
Alternatively, you can grant the access rights to a virtual Administration Server administrator through user roles. For example, this might be useful if you want to assign several administrators on the same virtual Administration Server. If this is the case, you can assign the administrators' accounts the same one or more user roles instead of configuring the same user rights for several administrators.
To assign an administrator for a virtual Administration Server by assigning user roles:
- On the primary Administration Server, create a new user role, and then specify all of the required access rights that an administrator must have on the virtual Administration Server. You can create several roles, for example, if you want to separate access to different functional areas.
- In the main menu, switch to the required virtual Administration Server:
- Click the chevron icon () to the right of the current Administration Server name.
- Select the required Administration Server.
- Click the chevron icon (
- Assign the new role or several roles to the administrator account.
The application assigns the roles to the administrator account.
Configuring access rights at the object level
In addition to assigning access rights at the functional area level, you can configure access to specific objects on the virtual Administration Server, for example, to a specific administration group or a task. To do this, switch to the virtual Administration Server, and then configure the access rights in the object's properties.
Changing the Administration Server for client devices
You can change the Administration Server that manages client devices to a different Server using the Change Administration Server task. After the task completion, the selected client devices will be put under the management of the Administration Server that you specify.
You cannot use the Change Administration Server task for client devices connected to Administration Server through connection gateways. For such devices you have to either reconfigure Network Agent or reinstall Network Agent and specify connection gateway.
To change the Administration Server that manages client devices to a different Server:
- In the main menu, go to Assets (Devices) → Tasks.
- Click Add.
The New task wizard starts. Proceed through the wizard by using the Next button.
- At the New task settings step of the wizard, specify the following settings:
- In the Application drop-down list, select Open Single Management Platform.
- In the Task type field, select Change Administration Server.
- In the Task name field, specify the name for the task that you are creating.
A task name cannot be more than 100 characters long and cannot include any special characters ("*<>?\:|).
- Select devices to which the task will be assigned:
- At the Task scope step of the wizard, specify an administration group, devices with specific addresses, or a device selection.
- At this step of the wizard, confirm that you agree to the terms of changing the Administration Server for client devices.
- At this step of the wizard, select the Administration Server that you want to use to manage the selected devices:
- At the Selecting an account to run the task step of the wizard, specify the account settings:
- If you want to change the default task settings, at the Finish task creation step of the wizard, enable the Open task details when creation is complete option.
If you do not enable this option, the task is created with the default settings. You can change the default settings later, at any time.
- Click the Finish button.
The task is created and displayed in the list of tasks.
- Click the name of the created task to open the task properties window.
- If you want to change the default task settings, in the task properties window, specify the general task settings according to your needs.
- Click the Save button.
The task is created and configured.
- Run the created task.
After the task is completed, the client devices for which it was created are put under the management of the Administration Server specified in the task settings.
Deleting a virtual Administration Server
When you delete a virtual Administration Server, all of the objects created on the Administration Server, including policies and tasks, will be deleted as well. The managed devices from the administration groups that were managed by the virtual Administration Server will be removed from the administration groups. To return the devices under management of Kaspersky Next XDR Expert, run the network polling, and then move the found devices from the Unassigned devices group to the administration groups.
To delete a virtual Administration Server:
- In the main menu, click the settings icon () next to the name of the Administration Server.
- On the page that opens, proceed to the Administration Servers tab.
- Select the virtual Administration Server that you want to delete.
- On the menu line, click the Delete button.
The virtual Administration Server is deleted.
Configuring Administration Server connection events logging
The history of connections and attempts to connect to the Administration Server during its operation can be saved to a log file. The information in the file allows you to track not only connections inside your network infrastructure, but unauthorized attempts to access the server as well.
To log events of connection to the Administration Server:
- In the main menu, click the settings icon () next to the name of the required Administration Server.
The Administration Server properties window opens.
- On the General tab, select the Connection ports section.
- Enable the Log Administration Server connection events option.
All further events of inbound connections to the Administration Server, authentication results, and SSL errors will be saved to the file /var/opt/kaspersky/klnagent_srv/logs/sc.syslog.
Page top
Setting the maximum number of events in the event repository
In the Events repository section of the Administration Server properties window, you can edit the settings of events storage in the Administration Server database by limiting the number of event records and record storage term. When you specify the maximum number of events, the application calculates an approximate amount of storage space required for the specified number. You can use this approximate calculation to evaluate whether you have enough free space on the disk to avoid database overflow. The default capacity of the Administration Server database is 400,000 events. The maximum recommended capacity of the database is 45 million events.
The application checks the database every 10 minutes. If the number of events reaches the specified maximum value plus 10,000, the application deletes the oldest events so that only the specified maximum number of events remains.
When the Administration Server deletes old events, it cannot save new events to the database. During this period, information about events that were rejected is written to the operating system log. The new events are queued and then saved to the database after the deletion operation is complete. By default, the event queue is limited to 20,000 events. You can customize the queue limit by editing the KLEVP_MAX_POSTPONED_CNT flag value.
To limit the number of events that can be stored in the events repository on the Administration Server:
- In the main menu, click the settings icon () next to the name of the required Administration Server.
The Administration Server properties window opens.
- On the General tab, select the Events repository section. Specify the maximum number of events stored in the database.
- Click the Save button.
Changing DBMS credentials
Sometimes, you may need to change DBMS credentials, for example, in order to perform a credential rotation for security purposes.
To change DBMS credentials in a Linux environment by using the klsrvconfig utility:
- Launch a Linux command line.
- Specify the klsrvconfig utility in the opened command line window:
sudo /opt/kaspersky/ksc64/sbin/klsrvconfig -set_dbms_cred - Specify a new account name. You should specify credentials of an account that exists in the DBMS.
- Enter a new password.
- Specify the new password for confirmation.
The DBMS credentials are changed.
Page top
Backup copying and restoration of the Administration Server data
Data backup allows you to save the Administration Server data in a certain state, and restore the data if needed, for example, if the Administration Server data is corrupted.
Before you back up the Administration Server data, check whether a virtual Administration Server is added to the administration group. If a virtual Administration Server is added, make sure that an administrator is assigned to this virtual Administration Server before the backup. You cannot grant the administrator access rights to the virtual Administration Server after the backup. Note that if the administrator account credentials are lost, you will not be able to assign a new administrator to the virtual Administrator Server.
You can create a backup copy of the Administration Server data only by running the Backup of Administration Server data task. This task is automatically created when you deploy Kaspersky Next XDR Expert.
On the primary Administration Server, creating and removing the Backup of Administration Server data task is not available.
The backup copy is saved in the /var/spool/ksc/backup directory. The backup directory is automatically created on the worker node on which Administration Server is installed when you deploy Kaspersky Next XDR Expert. On the primary Administration Server, you cannot change the backup directory path.
The following data is saved in the backup copy of Administration Server:
- Database of Administration Server (policies, tasks, application settings, events saved on the Administration Server)
- Configuration details of the structure of administration groups and client devices
- Repository of distribution packages of applications for remote installation
- Administration Server certificate
Recovery of the Administration Server data is only possible by using the KDT utility.
You can create a backup copy of the KUMA Core and restore it from the backup if needed. You can also back up other Kaspersky Next XDR Expert components by using third-party tools only if you use the DBMS installed on a separate server outside the Kubernetes cluster. You must not create the Administration Server database backup by using third-party tools.
Configuring the Administration Server Backup task
The Administration Server Backup task automatically is created when you deploy Kaspersky Next XDR Expert and cannot be deleted. You can create a backup copy of Administration Server data only by running the Administration Server Backup task.
To configure the Backup of Administration Server data task:
- In the main menu, go to Assets (Devices) → Tasks, and then select the Administration Server Backup task.
- Click the Administration Server Backup task.
The task properties window opens.
- If necessary, specify the general task settings according to your needs.
- In the Application settings section, set the backup protection password and number of backup copies if needed.
We recommend limiting the number of Administration Server data backups, to avoid overflow in the disk space allocated to store backups.
- Click Save to apply changes.
The Backup of Administration Server data task is configured.
Page top
Using the KDT utility to recover Administration Server data
The Backup of Administration Server data task allows you to copy Administration Server data for backup. To recover Administration Server data, you must use the KDT utility.
To recover Administration Server data:
- On the administrator host where the KDT utility is located, run the following command:
./kdt invoke ksc --action listBackupThe list of backups located in the
/var/spool/ksc/backupdirectory is displayed. - Run the following command:
./kdt invoke ksc --action restoreBackup --param ksc_file_backup='<file name>' --param ksc_backup_password="<password>"where:
ksc_file_backupis the path to the required backup archive and the archive name.ksc_backup_passwordis the archive password if the backup was saved with a password. If no password was used set theksc_backup_passwordvariable to "".
The Administration Server data is recovered from the selected backup archive.
Page top
Deleting a hierarchy of Administration Servers
If you no longer want to have a hierarchy of Administration Servers, you can disconnect them from this hierarchy.
To delete a hierarchy of Administration Servers:
- In the main menu, click the settings icon () next to the name of the primary Administration Server.
- On the page that opens, proceed to the Administration Servers tab.
- In the administration group from which you want to delete the secondary Administration Server, select the secondary Administration Server.
- On the menu line, click Delete.
- In the window that opens, click OK to confirm that you want to delete the secondary Administration Server.
The former primary Administration Server and the former secondary Administration Server are now independent of each other. The hierarchy no longer exists.
Page top
Access to public DNS servers
If access to Kaspersky servers by using the system DNS is not possible, Open Single Management Platform can use the following public DNS servers, in the following order:
- Google Public DNS (8.8.8.8)
- Cloudflare DNS (1.1.1.1)
- Alibaba Cloud DNS (223.6.6.6)
- Quad9 DNS (9.9.9.9)
- CleanBrowsing (185.228.168.168)
Requests to these DNS servers may contain domain addresses and the public IP address of the Administration Server, because the application establishes a TCP/UDP connection to the DNS server. If Open Single Management Platform is using a public DNS server, data processing is governed by the privacy policy of the relevant service.
To configure the use of public DNS by using the klscflag utility:
- On the administrator host where the KDT utility is located, run the following command to disable the use of public DNS:
./kdt invoke ksc --action klscflag --param klscflag_param=" -fset -pv ".core/.independent" -s Transport -n ForceUseSystemDNS -t d -v 1" - To enable the use of public DNS, run the following command:
./kdt invoke ksc --action klscflag --param klscflag_param=" -fset -pv ".core/.independent" -s Transport -n ForceUseSystemDNS -t d -v 0"
Configuring the interface
You can configure the OSMP Console interface to display and hide sections and interface elements, depending on the features being used.
To configure the OSMP Console interface in accordance with the currently used set of features:
- In the main menu, go to your account settings, and then select Interface options.
- Enable or disable the required options:
- Show data encryption and protection
- Show EDR alerts
- Click Save.
After the required options are enabled, the console displays the corresponding sections in the main menu. For example, if you enable Show EDR alerts, the Monitoring & reporting → Alerts section appears in the main menu.
Page top
Encrypt communication with TLS
To fix vulnerabilities on your organization's corporate network, you can enable traffic encryption by using the TLS protocol. You can enable TLS encryption protocols and supported cipher suites on Administration Server. Open Single Management Platform supports the TLS protocol versions 1.0, 1.1, 1.2, and 1.3. You can select the required encryption protocol and cipher suites.
Open Single Management Platform uses self-signed certificates. You can also use your own certificates. We recommend using certificates issued by trusted certificate authorities.
To configure allowed encryption protocols and cipher suites on Administration Server:
- On the administrator host where the KDT utility is located, run the following command:
./kdt invoke ksc --action klscflag --param klscflag_param=" -fset -pv ".core/.independent" -s Transport -n SrvUseStrictSslSettings -v <value> -t d"Use the SrvUseStrictSslSettings flag to configure allowed encryption protocols and cipher suites on Administration Server.
Specify the <value> parameter of the SrvUseStrictSslSettings flag:
4—Only the TLS 1.2 and TLS 1.3 protocols are enabled. Also, cipher suites with TLS_RSA_WITH_AES_256_GCM_SHA384 are enabled (these cipher suites are needed for backward compatibility with Kaspersky Security Center 11). This is the default value.Cipher suites supported for the TLS 1.2 protocol:
- ECDHE-RSA-AES256-GCM-SHA384
- ECDHE-RSA-AES256-SHA384
- ECDHE-RSA-CHACHA20-POLY1305
- AES256-GCM-SHA384 (cipher suite with TLS_RSA_WITH_AES_256_GCM_SHA384)
- ECDHE-RSA-AES128-GCM-SHA256
- ECDHE-RSA-AES128-SHA256
Cipher suites supported for the TLS 1.3 protocol:
- TLS_AES_256_GCM_SHA384
- TLS_CHACHA20_POLY1305_SHA256
- TLS_AES_128_GCM_SHA256
- TLS_AES_128_CCM_SHA256
5—Only the TLS 1.2 and TLS 1.3 protocols are enabled. For the TLS 1.2 and TLS 1.3 protocols, the specific cipher suites listed below are supported.Cipher suites supported for the TLS 1.2 protocol:
- ECDHE-RSA-AES256-GCM-SHA384
- ECDHE-RSA-AES256-SHA384
- ECDHE-RSA-CHACHA20-POLY1305
- ECDHE-RSA-AES128-GCM-SHA256
- ECDHE-RSA-AES128-SHA256
Cipher suites supported for the TLS 1.3 protocol:
- TLS_AES_256_GCM_SHA384
- TLS_CHACHA20_POLY1305_SHA256
- TLS_AES_128_GCM_SHA256
- TLS_AES_128_CCM_SHA256
We do not recommend using 0, 1, 2, or 3 as the parameter value of the SrvUseStrictSslSettings flag. These parameter values correspond to insecure TLS protocol versions (the TLS 1.0 and TLS 1.1 protocols) and insecure cipher suites, and are used only for backward compatibility with earlier Kaspersky Security Center versions.
- Restart the following Open Single Management Platform services:
- Administration Server
- Web Server
- Activation Proxy
Traffic encryption by using the TLS protocol is enabled.
You can use the KLTR_TLS12_ENABLED and KLTR_TLS13_ENABLED flags to enable the support of the TLS 1.2 and TLS 1.3 protocols, respectively. These flags are enabled by default.
To enable or disable the support of the TLS 1.2 and TLS 1.3 protocols,
On the administrator host where the KDT utility is located, run one of the following commands:
- To enable or disable the support of the TLS 1.2 protocol:
./kdt invoke --action klscflag --param klscflag_param=" -fset -pv ".core/.independent" -s Transport -n KLTR_TLS12_ENABLED -v <value> -t d" - To enable or disable the support of the TLS 1.3 protocol:
./kdt invoke --action klscflag --param klscflag_param=" -fset -pv ".core/.independent" -s Transport -n KLTR_TLS13_ENABLED -v <value> -t d"
Specify the <value> parameter of the flag:
1—To enable the support of the TLS protocol.0—To disable the support of the TLS protocol.
Discovering networked devices
This section describes search and discovery of networked devices.
Open Single Management Platform allows you to find devices on the basis of specified criteria. You can save search results to a text file.
The search and discovery feature allows you to find the following devices:
- Managed devices in administration groups of Kaspersky Security Center Administration Server and its secondary Administration Servers.
- Unassigned devices managed by Kaspersky Security Center Administration Server and its secondary Administration Servers.
Scenario: Discovering networked devices
You must perform device discovery before installation of the security applications. When all networked devices are discovered, you can receive information about them and manage them through policies. Regular network polls are needed to discover if there are any new devices and whether previously discovered devices are still on the network.
Discovery of networked devices proceeds in stages:
- Initial device discovery
Perform device discovery manually.
- Configuring future polls
Make sure that IP range polling is enabled and that the poll schedule meets the needs of your organization. When configuring the poll schedule, use the recommendations for network polling frequency.
You can also enable Zeroconf polling if your network includes IPv6 devices.
If networked devices are included in a domain, it is recommended to use domain controller polling.
You can perform IP range polling and Zeroconf polling only by using a distribution point.
- Setting up rules for adding discovered devices to administration groups (optional)
If new devices appear on your network, they are discovered during regular polls and are automatically included in the Unassigned devices group. If you want, you can set up the rules for automatically moving these devices to the Managed devices group. You can also establish retention rules.
If you skip this rule-setting stage, all the newly discovered devices go to the Unassigned devices group and stay there. If you want, you can move these devices to the Managed devices group manually. If you move the devices to the Managed devices group manually, you can analyze information about each device and decide whether you want to move it to an administration group, and, if so, to which group.
Results
Completion of the scenario yields the following:
- Kaspersky Security Center Administration Server discovers the devices that are on the network and provides you with information about them.
- Future polls are set up and are conducted according to the specified schedule.
The newly discovered devices are arranged according to the configured rules. (Or, if no rules are configured, the devices stay in the Unassigned devices group).
Page top
IP range polling
Kaspersky Next XDR Expert allows you to poll an IP range only by using a distribution point. The distribution point attempts to perform reverse name resolution for every IPv4 address from the specified range to a DNS name, by using standard DNS requests. If this operation succeeds, the distribution point sends an ICMP ECHO REQUEST (the same as the ping command) to the received name. If the device responds, information about it is added to the Kaspersky Next XDR Expert database. The reverse name resolution is necessary to exclude network devices that can have an IP address but are not computers, for example, network printers or routers.
This polling method relies upon a correctly configured local DNS service. It must have a reverse lookup zone. If this zone is not configured, IP subnet polling will yield no results.
Initially, the distribution point gets IP ranges for polling from the network settings of the device assigned as a distribution point. If the device address is 192.168.0.1 and the subnet mask is 255.255.255.0, the network 192.168.0.0/24 is included in the list of polling address automatically. The distribution point polls all addresses from 192.168.0.1 to 192.168.0.254.
If only IP range polling is enabled, the distribution point discovers devices only with IPv4 addresses. If your network includes IPv6 devices, turn on Zeroconf polling of devices.
IP range polling by using a distribution point
To configure IP range polling by using the distribution point:
- Open the distribution point properties.
- Go to the IP ranges polling section, and then select the Enable range polling option.
The IP range window opens.
- Specify the name of a new IP range.
- Click Add, and then specify the IP range by using the address and subnet mask, or by using the start and end IP address. You can also add an existing subnet by clicking the Browse button.
- Click the Set polling schedule button to specify the polling schedule options, if needed.
Polling starts only according to the specified schedule. A manual start of polling is not available.
Polling schedule options:
- Enable the Use Zeroconf to poll IPv6 networks option, to automatically poll the IPv6 network by using zero-configuration networking (also referred to as Zeroconf).
In this case, the specified IP ranges are ignored because the distribution point polls the whole network. The Use Zeroconf to poll IPv6 networks option is available if the distribution point runs Linux. To use Zerocong IPv6 polling, you must install the avahi-browse utility on the distribution point.
After the polling is completed, the newly discovered devices are automatically included in the Managed devices group, if you set up and enabled device moving rules. If no moving rules have been enabled, the newly discovered devices are automatically included in the Unassigned devices group.
Page top
Domain controller polling
Open Single Management Platform supports polling of a Microsoft Active Directory domain controller and a Samba domain controller. For a Samba domain controller, Samba 4 is used as an Active Directory domain controller.
When you poll a domain controller, Administration Server or a distribution point retrieves information about the domain structure, user accounts, security groups, and DNS names of the devices that are included in the domain.
We recommend using domain controller polling if all networked devices are members of a domain. If some of the networked devices are not included in the domain, these devices cannot be discovered by domain controller polling.
Prerequisites
Before you poll a domain controller, ensure that the following protocols are enabled:
- Simple Authentication and Security Layer (SASL)
- Lightweight Directory Access Protocol (LDAP)
Ensure that the following ports are available on the domain controller device:
- 389 for SASL
- 636 for TLS
Domain controller polling by using Administration Server
To poll a domain controller by using Administration Server:
- In the main menu, go to Discovery & deployment → Discovery → Domain controllers.
- Click Polling settings.
The Domain controller polling settings window opens.
- Select the Enable domain controller polling option.
- In the Poll specified domains, click Add, and then specify the address and user credentials of the domain controller.
- If necessary, in the Domain controller polling settings window, specify the polling schedule. The default period is one hour. The data received at the next polling completely replaces old data.
The following polling schedule options are available:
- Every N days
- Every N minutes
- By days of week
- Every month on specified days of selected weeks
- Run missed tasks
If you change user accounts in a security group of the domain, these changes will be displayed in Open Single Management Platform an hour after you poll the domain controller.
- Click Save to apply changes.
- If you want to perform the poll immediately, click the Start poll button.
Domain controller polling by using a distribution point
You can also poll a domain controller by using a distribution point. A Windows- or Linux-based managed device can act as a distribution point.
For a Linux distribution point, polling of a Microsoft Active Directory domain controller and a Samba domain controller are supported.
For a Windows distribution point, only polling of a Microsoft Active Directory domain controller is supported.
Polling with a Mac distribution point is not supported.
To configure domain controller polling by using the distribution point:
- Open the distribution point properties.
- Select the Domain controller polling section.
- Select the Enable domain controller polling option.
- Select the domain controller that you want to poll.
If you use a Linux distribution point, in the Poll specified domains section, click Add, and then specify the address and user credentials of the domain controller.
If you use a Windows distribution point, you can select one of the following options:
- Poll current domain
- Poll entire domain forest
- Poll specified domains
- Click the Set polling schedule button to specify the polling schedule options if needed.
Polling starts only according to the specified schedule. Manual start of polling is not available.
After the polling is completed, the domain structure will be displayed in the Domain controllers section.
If you set up and enabled device moving rules, the newly discovered devices are automatically included in the Managed devices group. If no moving rules have been enabled, the newly discovered devices are automatically included in the Unassigned devices group.
The discovered user accounts can be used for domain authentication in OSMP Console.
Authentication and connection to a domain controller
On initial connection to the domain controller the Administration Server identifies the connection protocol. This protocol is used for all future connections to the domain controller.
The initial connection to a domain controller proceeds as follows:
- Administration Server attempts to connect to the domain controller over TLS.
By default, certificate verification is not required. Set the KLNAG_LDAP_TLS_REQCERT flag to 1 to enforce certificate verification.
By default, the OS-dependent path to the certificate authority (CA) is used to access the certificate chain. Use the KLNAG_LDAP_SSL_CACERT flag to specify a custom path.
- If the TLS connection fails, Administration Server attempts to connect to the domain controller over SASL (DIGEST-MD5).
- If the SASL (DIGEST-MD5) connection fails, Administration Server uses Simple Authentication over non-encrypted TCP connection to connect to the domain controller.
You can use the KDT command to configure flags. For example, you can enforce certificate verification. To do this, on the administrator host where the KDT utility is located, run the following command:
./kdt invoke ksc --action klscflag --param klscflag_param=" -fset -pv klserver -n KLNAG_LDAP_TLS_REQCERT -t d -v 1"
Page top
Configuring a Samba domain controller
Open Single Management Platform supports a Linux domain controller running only on Samba 4.
A Samba domain controller supports the same schema extensions as a Microsoft Active Directory domain controller. You can enable full compatibility of a Samba domain controller with a Microsoft Active Directory domain controller by using the Samba 4 schema extension. This is an optional action.
We recommend enabling full compatibility of a Samba domain controller with a Microsoft Active Directory domain controller. This will ensure the correct interaction between Open Single Management Platform and the Samba domain controller.
To enable full compatibility of a Samba domain controller with a Microsoft Active Directory domain controller:
- Execute the following command to use the RFC2307 schema extension:
samba-tool domain provision --use-rfc2307 --interactive - Enable the schema update in a Samba domain controller. To do this, add the following line to the
/etc/samba/smb.conffile:dsdb:schema update allowed = trueIf the schema update completes with an error, you need to perform a full restore of the domain controller that acts as a schema master.
If you want to poll a Samba domain controller correctly, you have to specify the netbios name and workgroup parameters in the /etc/samba/smb.conf file.
Using VDI dynamic mode on client devices
A virtual infrastructure can be deployed on a corporate network using temporary virtual machines. Open Single Management Platform detects temporary virtual machines and adds information about them to the Administration Server database. After a user finishes using a temporary virtual machine, the machine is removed from the virtual infrastructure. However, a record about the removed virtual machine can be saved in the database of the Administration Server. Also, nonexistent virtual machines can be displayed in OSMP Console.
To prevent information about nonexistent virtual machines from being saved, Open Single Management Platform supports dynamic mode for Virtual Desktop Infrastructure (VDI). The administrator can enable support of dynamic mode for VDI in the properties of the installation package of Network Agent to be installed on the temporary virtual machine.
When a temporary virtual machine is disabled, Network Agent notifies the Administration Server that the machine has been disabled. If the virtual machine has been disabled successfully, it is removed from the list of devices connected to the Administration Server. If the virtual machine is disabled with errors and Network Agent does not send a notification about the disabled virtual machine to the Administration Server, a backup scenario is used. In this scenario, the virtual machine is removed from the list of devices connected to the Administration Server after three unsuccessful attempts to synchronize with the Administration Server.
Enabling VDI dynamic mode in the properties of an installation package for Network Agent
To enable VDI dynamic mode:
- In the main menu, go to Discovery & deployment → Deployment & assignment → Installation packages.
- In the context menu of the Network Agent installation package, select Properties.
The Properties window opens.
- In the Properties window, select the Advanced section.
- In the Advanced section, select the Enable dynamic mode for VDI option.
The device on which Network Agent is to be installed becomes a part of VDI.
Page top
Moving devices from VDI to an administration group
To move devices that are part of VDI to an administration group:
- Go to Assets (Devices) → Moving rules.
- Click Add.
- On the Rule conditions tab, select the Virtual machines tab.
- Set the This is a virtual machine rule to Yes and Part of Virtual Desktop Infrastructure to Yes.
- Click Save.
Managing client devices
Kaspersky Next XDR Expert allows you to manage client devices:
- View settings and statuses of managed devices, including clusters and server arrays.
- Configure distribution points.
- Manage tasks.
You can use administration groups to combine client devices in a set that can be managed as a single unit. A client device can be included in only one administration group. Devices can be allocated to a group automatically based on Rule conditions:
You can use device selections to filter devices based on a condition. You can also tag devices for creating selections, for finding devices, and for distributing devices among administration groups.
Settings of a managed device
To view the settings of a managed device:
- In the main menu, go to Assets (Devices) → Managed devices.
The list of managed devices is displayed.
- In the list of managed devices, click the link with the name of the required device.
The properties window of the selected device is displayed.
The following tabs are displayed in the upper part of the properties window representing the main groups of the settings:
If you use a PostgreSQL, MariaDB or MySQL DBMS, the Events tab may display an incomplete list of events for the selected client device. This occurs when the DBMS stores a very large amount of events. You can increase the number of displayed events by doing either of the following:
To see a full list of events logged on the Administration Server for the device, use Reports.
Page top
Creating administration groups
Immediately after Open Single Management Platform installation, the hierarchy of administration groups contains only one administration group called Managed devices. When creating a hierarchy of administration groups, you can add devices and virtual machines to the Managed devices group, and add nested groups (see the figure below).
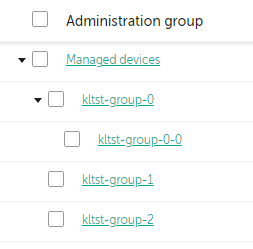
Viewing administration groups hierarchy
To create an administration group:
- In the main menu, go to Assets (Devices) → Hierarchy of groups.
- In the administration group structure, select the administration group that is to include the new administration group.
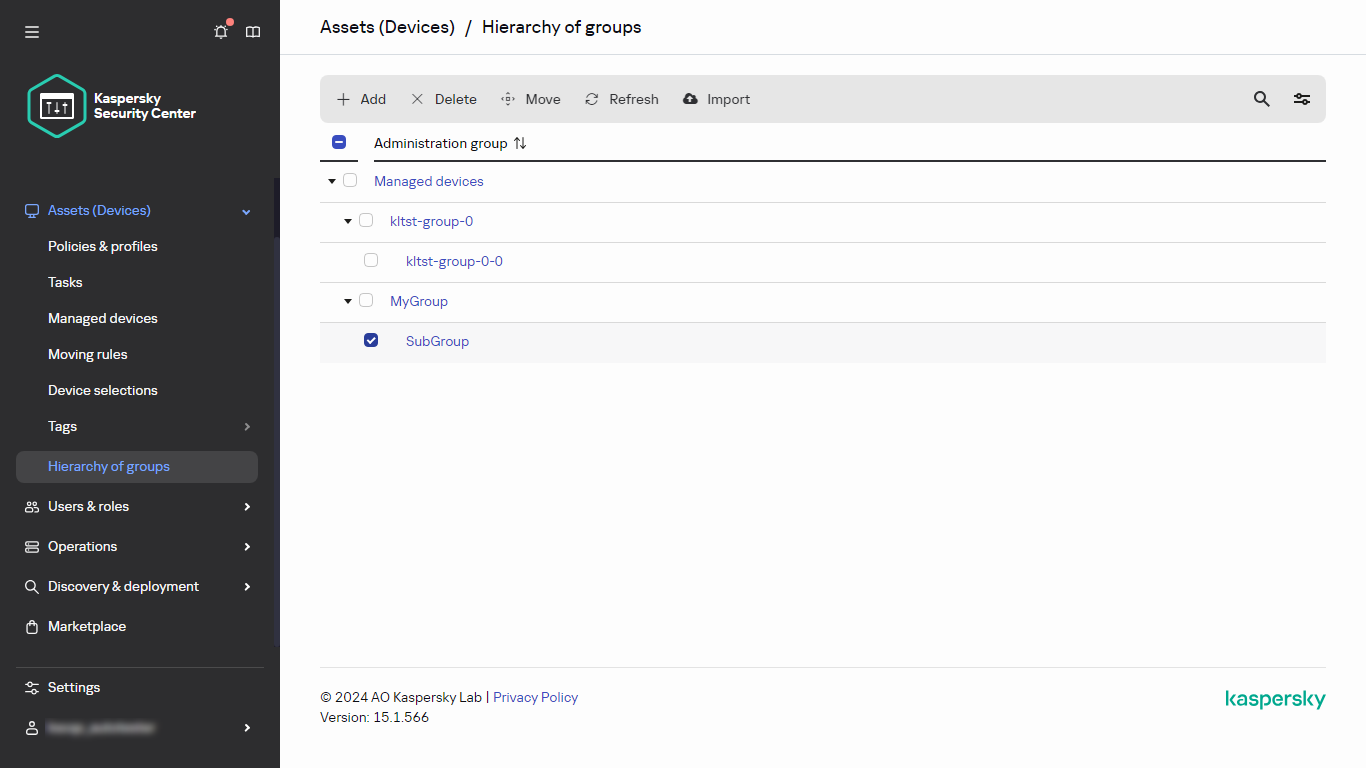
- Click the Add button.
- In the Name of the new administration group window that opens, enter a name for the group, and then click the Add button.
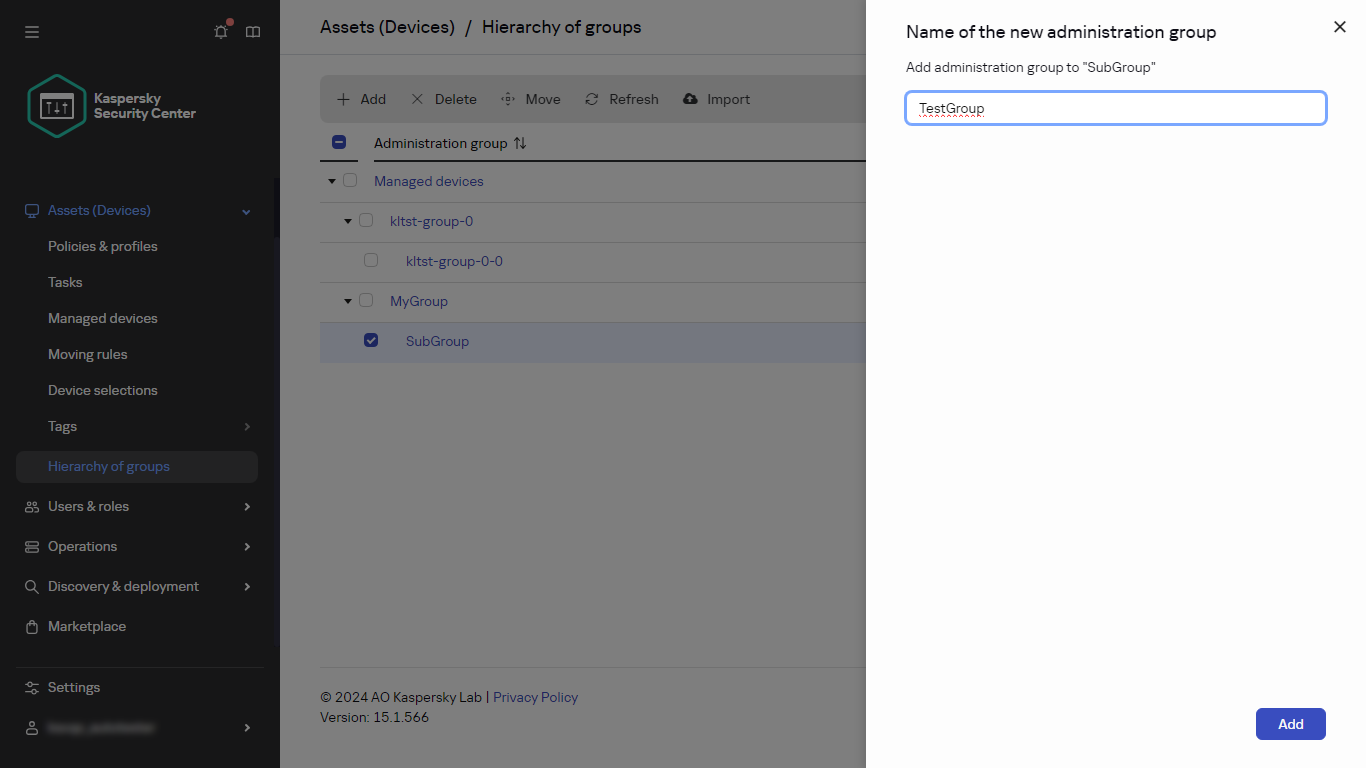
A new administration group with the specified name appears in the hierarchy of administration groups.
To create a structure of administration groups:
- In the main menu, go to Assets (Devices) → Hierarchy of groups.
- Click the Import button.
The New Administration Group Structure Wizard starts. Follow the instructions of the Wizard.
Page top
Device moving rules
We recommend that you automate the allocation of devices to administration groups through device moving rules. A device moving rule consists of three main parts: a name, an execution condition (logical expression with the device attributes), and a target administration group. A rule moves a device to the target administration group if the device attributes meet the rule execution condition.
All device moving rules have priorities. The Administration Server checks the device attributes as to whether they meet the execution condition of each rule, in ascending order of priority. If the device attributes meet the execution condition of a rule, the device is moved to the target group, so the rule processing is complete for this device. If the device attributes meet the conditions of multiple rules, the device is moved to the target group of the rule with the highest priority (that is, has the highest rank in the list of rules).
Device moving rules can be created implicitly. For example, in the properties of an installation package or a remote installation task, you can specify the administration group to which the device must be moved after Network Agent is installed on it. Also, device moving rules can be created explicitly by the administrator of Open Single Management Platform, in the Assets (Devices) → Moving rules section.
By default, a device moving rule is intended for one-time initial allocation of devices to administration groups. The rule moves devices from the unassigned devices group only once. If a device once was moved by this rule, the rule will never move it again, even if you return the device to the unassigned devices group manually. This is the recommended way of applying moving rules.
You can move devices that have already been allocated to some of the administration groups. To do this, in the properties of a rule, clear the Move only devices that do not belong to an administration group check box.
Applying moving rules to devices that have already been allocated to some of the administration groups, significantly increases the load on the Administration Server.
The Move only devices that do not belong to an administration group check box is locked in the properties of automatically created moving rules. Such rules are created when you add the Install application remotely task or create a stand-alone installation package.
You can create a moving rule that would affect a single device repeatedly.
We strongly recommend that you avoid moving a single device from one group to another repeatedly (for example, in order to apply a special policy to that device, run a special group task, or update the device through a specific distribution point).
Such scenarios are not supported, because they increase the load on Administration Server and network traffic to an extreme degree. These scenarios also conflict with the operating principles of Open Single Management Platform (particularly in the area of access rights, events, and reports). Another solution must be found, for example, through the use of policy profiles, tasks for device selections, assignment of Network Agents according to the standard scenario.
Page top
Creating device moving rules
You can set up device moving rules, that is, rules that automatically allocate devices to administration groups.
To create a moving rule:
- In the main menu, go to Assets (Devices) → Moving rules.
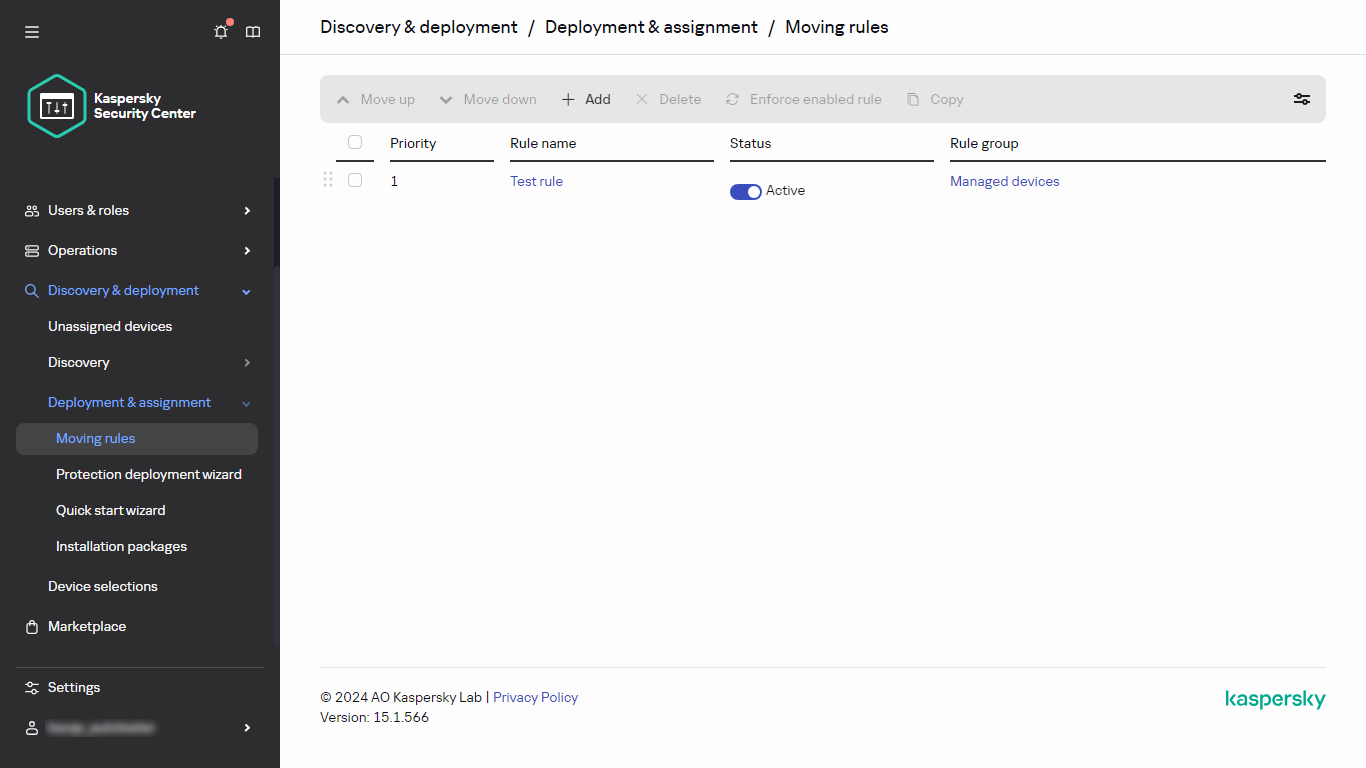
- Click Add. The New rule window opens.
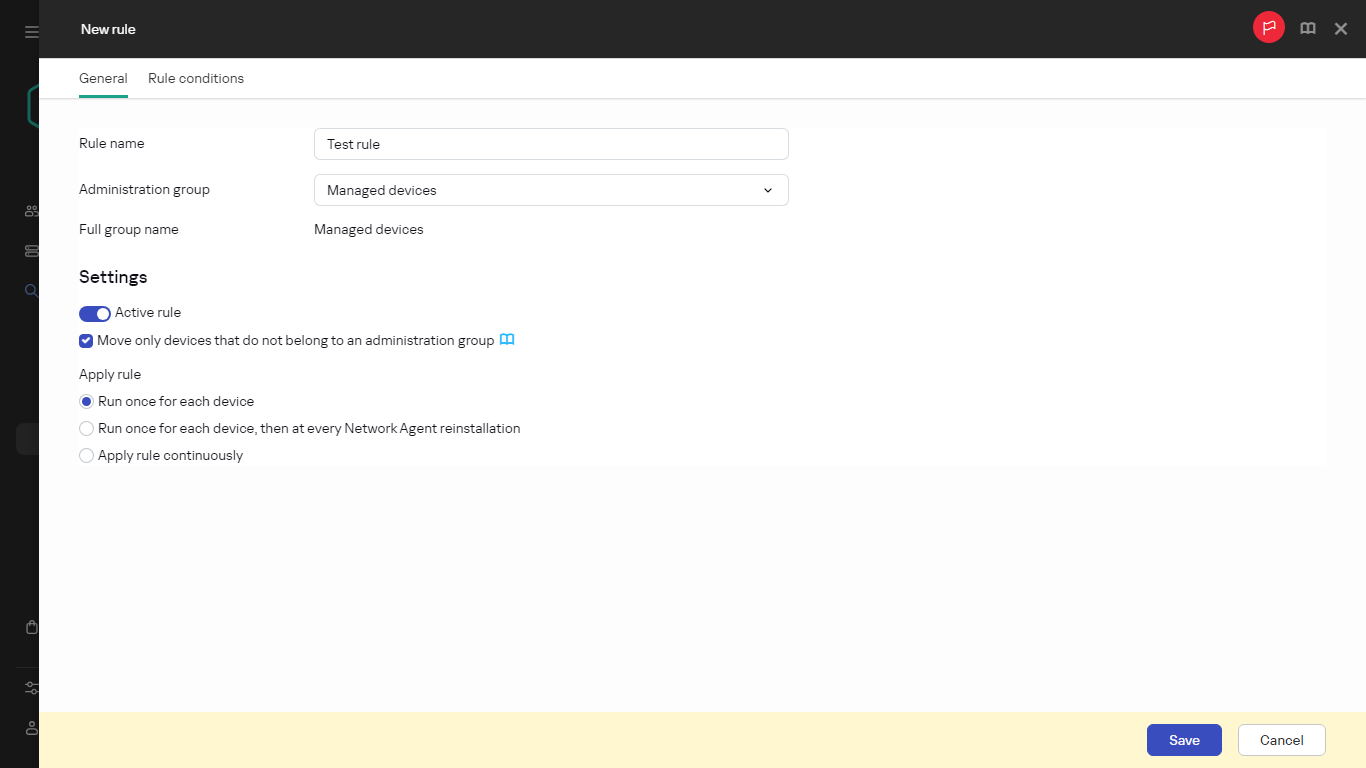
- In the window that opens, specify the following information on the General tab:
- On the Rule conditions tab, specify at least one criterion by which the devices are moved to an administration group.
- Click Save.
The moving rule is created. It is displayed in the list of moving rules.
The higher the position is on the list, the higher the priority of the rule. To increase or decrease the priority of a moving rule, move the rule up or down in the list, respectively, by using the mouse.
If the Apply rule continuously option is selected, the moving rule is applied regardless of the priority settings. Such rules are applied according to the schedule that the Administration Server sets up automatically.
If the device attributes meet the conditions of multiple rules, the device is moved to the target group of the rule with the highest priority (that is, has the highest rank in the list of rules).
Copying device moving rules
You can copy moving rules, for example, if you want to have several identical rules for different target administration groups.
To copy an existing a moving rule:
- Do one of the following:
- In the main menu, go to Assets (Devices) → Moving rules.
- In the main menu, go to Discovery & deployment → Deployment & assignment → Moving rules.
The list of moving rules is displayed.
- Select the check box next to the rule you want to copy.
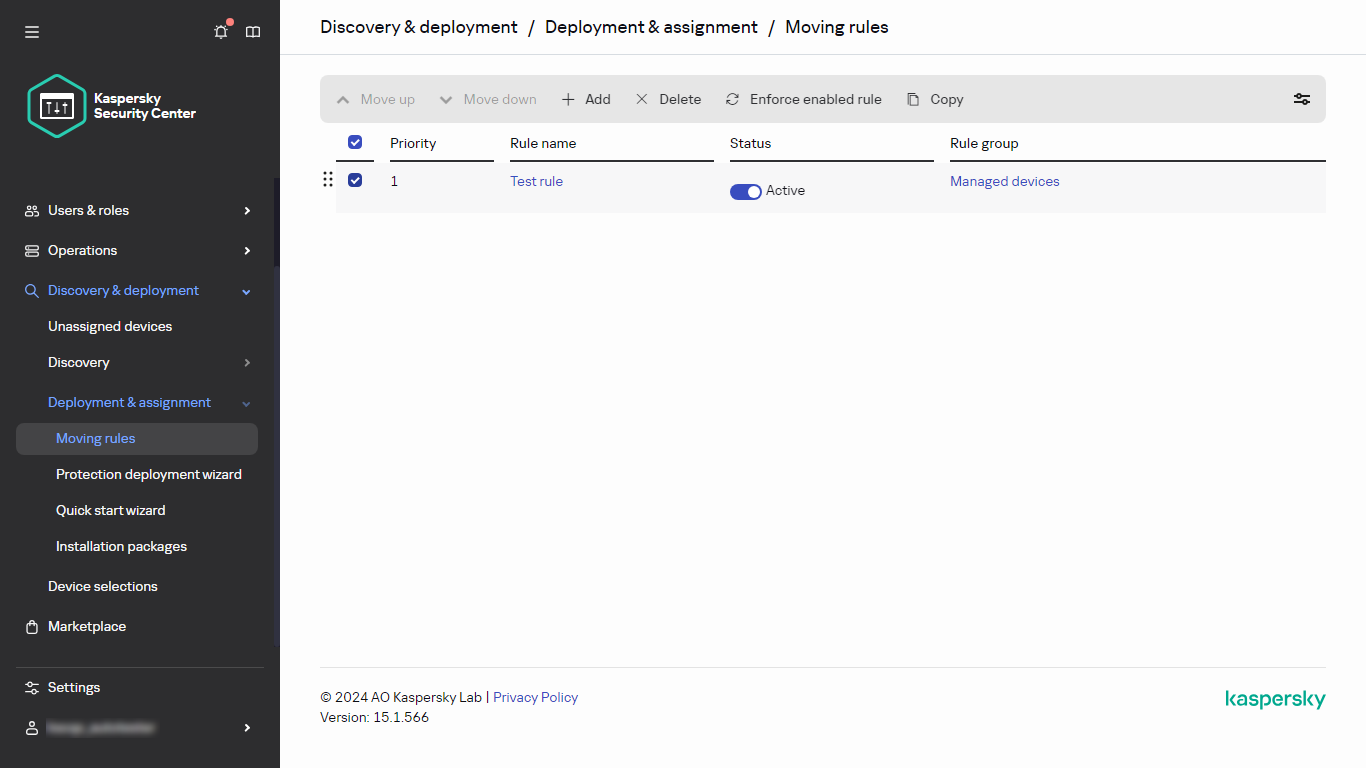
- Click Copy.
- In the window that opens, change the following information on the General tab—or make no changes if you only want to copy the rule without changing its settings:
- Rule name
- Administration group
- Active rule
- Move only devices that do not belong to an administration group
- Apply rule
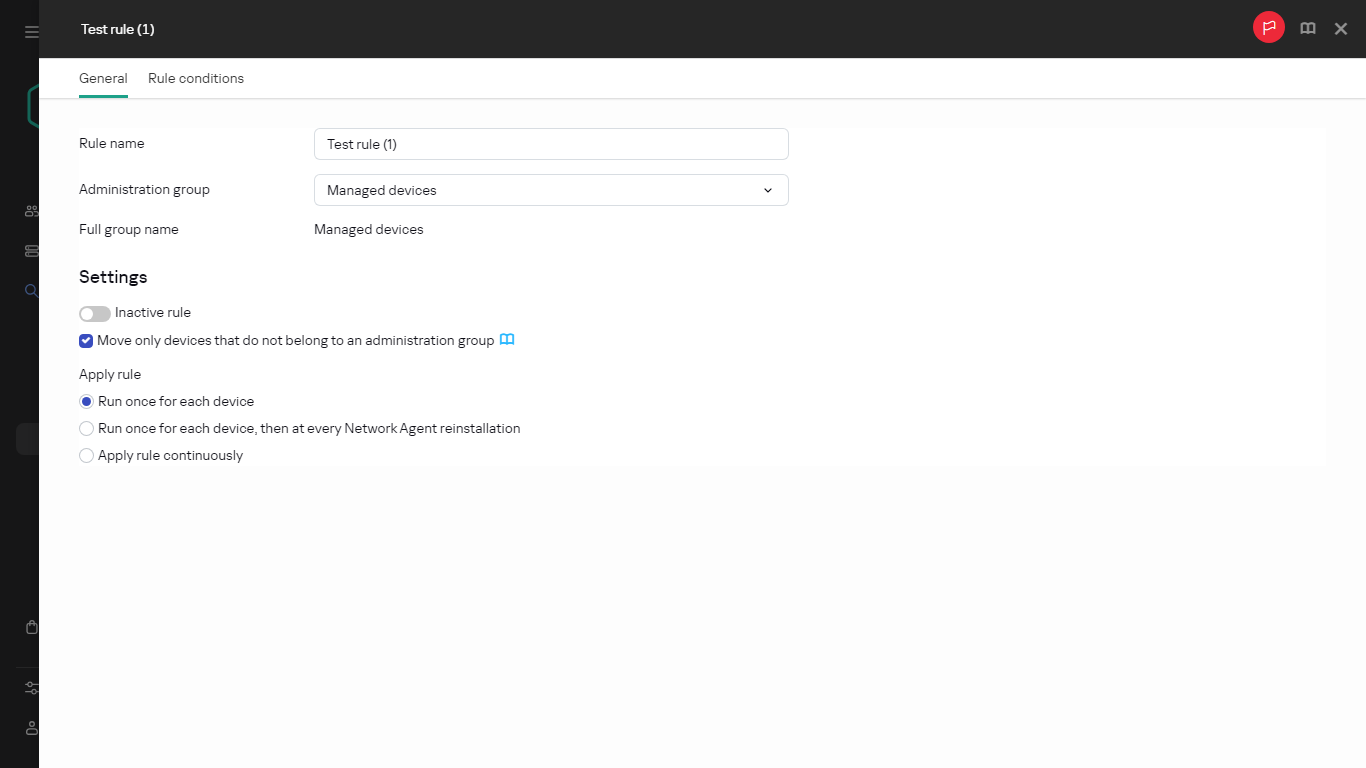
- On the Rule conditions tab, specify at least one criterion for the devices that you want to be moved automatically.
- Click Save.
The new moving rule is created. It is displayed in the list of moving rules.
Page top
Conditions for a device moving rule
When you create or copy a rule to move client devices to administration groups, on the Rule conditions tab you set conditions for moving the devices. To determine which devices to move, you can use the following criteria:
- Tags assigned to client devices.
- Network parameters. For example, you can move devices with IP addresses from a specified range.
- Managed applications installed on client devices, for instance, Network Agent or Administration Server.
- Virtual machines, which are the client devices.
Below, you can find the description on how to specify this information in a device moving rule.
If you specify several conditions in the rule, the AND logical operator works and all the conditions apply at the same time. If you do not select any options or keep some fields blank, such conditions do not apply.
Tags tab
On this tab, you can configure a device moving rule based on device tags that were previously added to the descriptions of client devices. To do this, select the required tags. Also, you can enable the following options:
Network tab
On this tab, you can specify the network data of devices that a device moving rule considers:
- DNS name of the device
- DNS domain
- IP range
- IP address for connection to Administration Server
- Device is in IP range
- Connection profile changed
- Managed by a different Administration Server
Device owner tab
On this tab, you can configure a device moving rule based on the device owner, security group membership, and role:
- Device owner
- Device owner's membership in Active Directory security group
- Device owner's role
- Device owner's membership in an internal security group
Applications tab
On this tab, you can configure a device moving rule based on the managed applications and operating systems installed on client devices:
- Network Agent is installed
- Applications
- Operating system version
- Operating system bit size
You can cull client devices by the operating system bit sizes. In the Operating system bit size field, you can select one of the following values:
- Unknown
- x86
- AMD64
- IA64
To check the operating system bit size of the client devices:
- In the main menu, go to the Assets (Devices) → Managed devices section.
- Click the Columns settings button (
 ) on the right.
 - Select the Operating system bit size option, and then click the Save button.
After that, the operating system bit size is displayed for every managed device.
- Operating system service pack version
- User certificate
- Operating system build
- Operating system release number
Virtual machines tab
On this tab, you can configure a device moving rule according to whether client devices are virtual machines or part of a virtual desktop infrastructure (VDI):
- This is a virtual machine
- Virtual machine type
- Part of Virtual Desktop Infrastructure
Domain controller tab
On this tab, you can specify that it is necessary to move devices included in the domain organizational unit. You can also move devices from all child organizational units of the specified domain organizational unit:
- Device is included in the following organizational unit
- Include child organizational units
- Move devices from child units to corresponding subgroups
- Create subgroups corresponding to containers of newly detected devices
- Delete subgroups that are not present in the domain
- Device is included in the following domain security group
Adding devices to an administration group manually
You can move devices to administration groups automatically by creating device moving rules or manually by moving devices from one administration group to another or by adding devices to a selected administration group. This section describes how to manually add devices to an administration group.
To add manually one or more devices to a selected administration group:
- In the main menu, go to Assets (Devices) → Managed devices.
- Click the Current path:
<current path>link above the list. - In the window that opens, select the administration group to which you want to add the devices.
- Click the Add devices button.
The Move devices wizard starts.
- Make a list of the devices that you want to add to the administration group.
You can add only devices for which information has already been added to the Administration Server database either upon connection of the device or after device discovery.
Select how you want to add devices to the list:
- Click the Add devices button, and then specify the devices in one of the following ways:
- Select devices from the list of devices detected by the Administration Server.
- Specify a device IP address or an IP range.
- Specify a device DNS name.
The device name field must not contain space characters, backspace characters, or the following prohibited characters: , \ / * ' " ; : & ` ~ ! @ # $ ^ ( ) = + [ ] { } | < > %
- Click the Import devices from file button to import a list of devices from a .txt file. Each device address or name must be specified on a separate line.
The file must not contain space characters, backspace characters, or the following prohibited characters: , \ / * ' " ; : & ` ~ ! @ # $ ^ ( ) = + [ ] { } | < > %
- Click the Add devices button, and then specify the devices in one of the following ways:
- View the list of devices to be added to the administration group. You can edit the list by adding or removing devices.
- After making sure that the list is correct, click the Next button.
The wizard processes the device list and displays the result. The successfully processed devices are added to the administration group and are displayed in the list of devices under names generated by Administration Server.
Moving devices or clusters to an administration group manually
You can move devices from one administration group to another, or from the group of unassigned devices to an administration group.
You can also move clusters or server arrays from one administration group to another. When you move a cluster or server array to another group, all of its nodes move with it, because a cluster and any of its nodes always belong to the same administration group. When you select a single cluster node on the Devices tab, the Move to group button becomes unavailable.
To move one or several devices or clusters to a selected administration group:
- Open the administration group from which you want to move the devices. To do this, perform one of the following:
- To open an administration group, in the main menu, go to Assets (Devices) → Managed devices, click the path link in the Current path field, and select an administration group in the left-side pane that opens.
- To open the Unassigned devices group, in the main menu, go to Discovery & deployment → Unassigned devices.
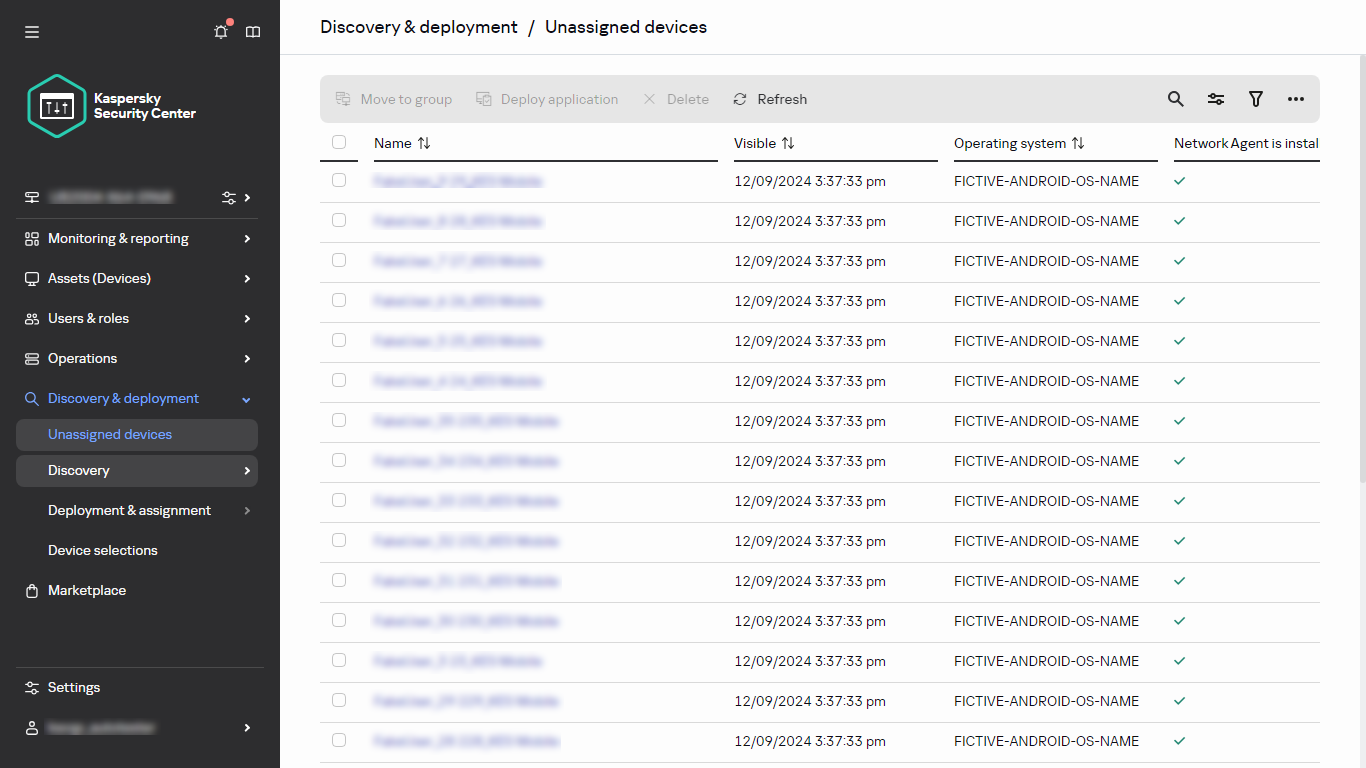
The list of unassigned devices
- If the administration group contains clusters or server arrays, the Managed devices section is divided into two tabs—the Devices tab and the Clusters and server arrays tab. Open the tab for the object that you want to move.
- Select the check boxes next to the devices or clusters that you want to move to a different group.
- Click the Move to group button.
- In the hierarchy of administration groups, select the check box next to the administration group to which you want to move the selected devices or clusters.
- Click the Move button.
The selected devices or clusters are moved to the selected administration group.
Page top
About clusters and server arrays
Open Single Management Platform supports cluster technology. If Network Agent sends information to Administration Server confirming that an application installed on a client device is part of a server array, this client device becomes a cluster node.
If an administration group contains clusters or server arrays, the Managed devices page displays two tabs—one for individual devices, and one for clusters and server arrays. After the managed devices are detected as cluster nodes, the cluster is added as an individual object to the Clusters and server arrays tab.
The cluster or server array nodes are listed on the Devices tab, along with other managed devices. You can view properties of the nodes as individual devices and perform other operations, but you cannot delete a cluster node or move it to another administration group separately from its cluster. You can only delete or move an entire cluster.
You can perform the following operations with clusters or server arrays:
- View properties
- Move the cluster or server array to another administration group
When you move a cluster or server array to another group, all of its nodes move with it, because a cluster and any of its nodes always belong to the same administration group.
- Delete
It is reasonable to delete a cluster or server array only when the cluster or server array does not exist in the organization network any longer. If a cluster is still visible on your network and Network Agent and the Kaspersky security application are still installed on the cluster nodes, Open Single Management Platform returns the deleted cluster and its nodes back to the list of managed devices automatically.
Properties of a cluster or server array
To view the settings of a cluster or server array:
- In the main menu, go to Assets (Devices) → Managed devices → Clusters and server arrays.
The list of clusters and server arrays is displayed.
- Click the name of the required cluster or server array.
The properties window of the selected cluster or server array is displayed.
General
The General section displays general information about the cluster or server array. Information is provided on the basis of data received during the last synchronization of the cluster nodes with the Administration Server:
- Name
- Description
- Windows domain
- NetBIOS name
- DNS name
Tasks
In the Tasks tab, you can manage the tasks assigned to the cluster or server array: view the list of existing tasks; create new ones; remove, start, and stop tasks; modify task settings; and view execution results. The listed tasks relate to the Kaspersky security application installed on the cluster nodes. Open Single Management Platform receives the task list and the task status details from the cluster nodes. If a connection is not established, the status is not displayed.
Nodes
This tab displays a list of nodes included into the cluster or server array. You can click a node name to view the device properties window.
Kaspersky application
The properties window may also contain additional tabs with the information and settings related to the Kaspersky security application installed on the cluster nodes.
Adjustment of distribution points and connection gateways
A structure of administration groups in Open Single Management Platform performs the following functions:
- Sets the scope of policies
There is an alternate way of applying relevant settings on devices, by using policy profiles.
- Sets the scope of group tasks
There is an approach to defining the scope of group tasks that is not based on a hierarchy of administration groups: use of tasks for device selections and tasks for specific devices.
- Sets access rights to devices, virtual Administration Servers, and secondary Administration Servers
- Assigns distribution points
When building the structure of administration groups, you must take into account the topology of the organization's network for the optimum assignment of distribution points. The optimum distribution of distribution points allows you to save traffic on the organization's network.
Depending on the organizational schema and network topology, the following standard configurations can be applied to the structure of administration groups:
- Single office
- Multiple small remote offices
Devices functioning as distribution points must be protected, including physical protection, against any unauthorized access.
Standard configuration of distribution points: Single office
In a standard "single-office" configuration, all devices are on the organization's network so they can "see" each other. The organization's network may consist of a few separate parts (networks or network segments) linked by narrow channels.
The following methods of building the structure of administration groups are possible:
- Building the structure of administration groups taking into account the network topology. The structure of administration groups may not reflect the network topology with absolute precision. A match between the separate parts of the network and certain administration groups would be enough. You can use automatic assignment of distribution points or assign them manually.
- Building the structure of administration groups, without taking the network topology into account. In this case, you must disable automatic assignment of distribution points, and then assign one or several devices to act as distribution points for a root administration group in each of the separate parts of the network, for example, for the Managed devices group. All distribution points will be at the same level and will feature the same scope spanning all devices on the organization's network. In this case, each Network Agent will connect to the distribution point that has the shortest route. The route to a distribution point can be traced with the tracert utility.
Standard configuration of distribution points: Multiple small remote offices
This standard configuration provides for a number of small remote offices, which may communicate with the head office over the internet. Each remote office is located behind the NAT, that is, connection from one remote office to another is not possible because offices are isolated from one another.
The configuration must be reflected in the structure of administration groups: a separate administration group must be created for each remote office (groups Office 1 and Office 2 in the figure below).
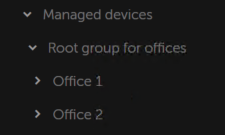
Remote offices are included in the administration group structure
One or multiple distribution points must be assigned to each administration group that correspond to an office. Distribution points must be devices at the remote office that have a sufficient amount of free disk space. Devices deployed in the Office 1 group, for example, will access distribution points assigned to the Office 1 administration group.
If some users move between offices physically, with their laptops, you must select two or more devices (in addition to the existing distribution points) in each remote office and assign them to act as distribution points for a top-level administration group (Root group for offices in the figure above).
Example: A laptop is deployed in the Office 1 administration group and then is moved physically to the office that corresponds to the Office 2 administration group. After the laptop is moved, Network Agent attempts to access the distribution points assigned to the Office 1 group, but those distribution points are unavailable. Then, Network Agent starts attempting to access the distribution points that have been assigned to the Root group for offices. Because remote offices are isolated from one another, attempts to access distribution points assigned to the Root group for offices administration group will only be successful when Network Agent attempts to access distribution points in the Office 2 group. That is, the laptop will remain in the administration group that corresponds to the initial office, but the laptop will use the distribution point of the office where it is physically located at the moment.
Calculating the number and configuration of distribution points
The more client devices a network contains, the more distribution points it requires. We recommend that you not disable automatic assignment of distribution points. When automatic assignment of distribution points is enabled, Administration Server assigns distribution points if the number of client devices is quite large and defines their configuration.
Using exclusively assigned distribution points
If you plan to use certain specific devices as distribution points (that is, exclusively assigned servers), you can opt out of using automatic assignment of distribution points. In this case, make sure that the devices that you intend to make distribution points have sufficient volume of free disk space, are not shut down regularly, and have Sleep mode disabled.
Number of exclusively assigned distribution points on a network that contains a single network segment, based on the number of networked devices
Number of client devices in the network segment |
Number of distribution points |
|---|---|
Less than 300 |
0 (Do not assign distribution points) |
More than 300 |
Acceptable: (N/10,000 + 1), recommended: (N/5000 + 2), where N is the number of networked devices |
Number of exclusively assigned distribution points on a network that contains multiple network segments, based on the number of networked devices
Number of client devices per network segment |
Number of distribution points |
|---|---|
Less than 10 |
0 (Do not assign distribution points) |
10–100 |
1 |
More than 100 |
Acceptable: (N/10,000 + 1), recommended: (N/5000 + 2), where N is the number of networked devices |
Using standard client devices (workstations) as distribution points
If you plan to use standard client devices (that is, workstations) as distribution points, we recommend that you assign distribution points as shown in the tables below in order to avoid excessive load on the communication channels and on Administration Server:
Number of workstations functioning as distribution points on a network that contains a single network segment, based on the number of networked devices
Number of client devices in the network segment |
Number of distribution points |
|---|---|
Less than 300 |
0 (Do not assign distribution points) |
More than 300 |
(N/300 + 1), where N is the number of networked devices; there must be at least 3 distribution points |
Number of workstations functioning as distribution points on a network that contains multiple network segments, based on the number of networked devices
Number of client devices per network segment |
Number of distribution points |
|---|---|
Less than 10 |
0 (Do not assign distribution points) |
10–30 |
1 |
31–300 |
2 |
More than 300 |
(N/300 + 1), where N is the number of networked devices; there must be at least 3 distribution points |
If a distribution point is shut down (or not available for some other reason), the managed devices in its scope can access the Administration Server for updates.
Assigning distribution points automatically
We recommend that you assign distribution points automatically. In this case, Open Single Management Platform will select on its own which devices must be assigned distribution points.
To assign distribution points automatically:
- In the main menu, click the settings icon () next to the name of the required Administration Server.
The Administration Server properties window opens.
- On the General tab, select the Distribution points section.
- Select the Automatically assign distribution points option.
If automatic assignment of devices as distribution points is enabled, you cannot configure distribution points manually or edit the list of distribution points.
- Click the Save button.
Administration Server assigns and configures distribution points automatically.
Assigning distribution points manually
Open Single Management Platform allows you to manually assign devices to act as distribution points.
We recommend that you assign distribution points automatically. In this case, Open Single Management Platform will select on its own which devices must be assigned distribution points. However, if you have to opt out of assigning distribution points automatically for any reason (for example, if you want to use exclusively assigned servers), you can assign distribution points manually after you calculate their number and configuration.
Devices functioning as distribution points must be protected, including physical protection, against any unauthorized access.
To manually assign a device to act as distribution point:
- In the main menu, click the settings icon () next to the name of the required Administration Server.
The Administration Server properties window opens.
- On the General tab, select the Distribution points section.
- Select the Manually assign distribution points option.
- Click the Assign button.
- Select the device that you want to make a distribution point.
When selecting a device, keep in mind the operation features of distribution points and the requirements set for the device that acts as distribution point.
- Select the administration group that you want to include in the scope of the selected distribution point.
- Click the OK button.
The distribution point that you have added will be displayed in the list of distribution points, in the Distribution points section.
- Click the newly added distribution point in the list to open its properties window.
- Configure the distribution point in the properties window:
- The General section contains the settings of interaction between the distribution point and client devices.
- In the Scope section, specify administration groups to which the distribution point will distribute updates.
- In the Source of updates section, you can select a source of updates for the distribution point:
- In the Internet connection settings subsection, you can specify the internet access settings:
- In the KSN Proxy section, you can configure the application to use the distribution point to forward KSN requests from the managed devices:
- In the Connection gateway section, you can configure the distribution point to act as a gateway for connection between Network Agent instances and Administration Server:
- Connection gateway
- Establish connection to gateway from Administration Server (if gateway is in DMZ)
- Open local port for Kaspersky Security Center Web Console
When connecting mobile devices to Administration Server via the distribution point that acts as a connection gateway, you can enable the following options:
- Open port for mobile devices (SSL authentication of the Administration Server only)
- Open port for mobile devices (two-way SSL authentication)
In both cases, the certificates are checked during the TLS session establishment on distribution point only. The certificates are not forwarded to be checked by the Administration Server. After a TLS session with the mobile device is established, the distribution point uses the Administration Server certificate to create a tunnel for synchronization between the mobile device and Administration Server. If you open the port for two-way SSL authentication, the only way to distribute the mobile device certificate is via an installation package.
- Configure domain controller polling by the distribution point.
- Configure the polling of IP ranges by the distribution point.
- In the Advanced section, specify the folder that the distribution point must use to store distributed data.
- Click the OK button.
The selected devices act as distribution points.
Page top
Modifying the list of distribution points for an administration group
You can view the list of distribution points assigned to a specific administration group and modify the list by adding or removing distribution points.
To view and modify the list of distribution points assigned to an administration group:
- In the main menu, go to Assets (Devices) → Managed devices.
- In the Current path field above the list of managed devices, click the path link.
- In the left-side pane that opens, select an administration group for which you want to view the assigned distribution points.
This enables the Distribution points menu item.
- In the main menu, go to Assets (Devices) → Distribution points.
- To add new distribution points for the administration group, click the Assign button.
- To remove the assigned distribution points, select devices from the list and click the Unassign button.
Depending on your modifications, the new distribution points are added to the list or existing distribution points are removed from the list.
Page top
Enabling a push server
In Open Single Management Platform, a distribution point can work as a push server for the devices managed through the mobile protocol and for the devices managed by Network Agent. For example, a push server must be enabled if you want to be able to force synchronization of KasperskyOS devices with Administration Server. A push server has the same scope of managed devices as the distribution point on which the push server is enabled. If you have several distribution points assigned for the same administration group, you can enable push server on each of the distribution points. In this case, Administration Server balances the load between the distribution points.
You might want to use distribution points as push servers to make sure that there is continuous connectivity between a managed device and the Administration Server. Continuous connectivity is needed for some operations, such as running and stopping local tasks, receiving statistics for a managed application, or creating a tunnel. If you use a distribution point as a push server, you do not have to use the Do not disconnect from the Administration Server option on managed devices or send packets to the UDP port of the Network Agent.
A push server supports the load of up to 50,000 simultaneous connections.
To enable push server on a distribution point:
- In the main menu, click the settings icon () next to the name of the required Administration Server.
The Administration Server properties window opens.
- On the General tab, select the Distribution points section.
- Click the name of the distribution point on which you want to enable the push server.
The distribution point properties window opens.
- On the General section, enable the Run push server option.
- In the Push server port field, type the port number. You can specify number of any unoccupied port.
- In the Address for remote hosts field, specify the IP address or the name of the distribution point device.
- Click the OK button.
The push server is enabled on the selected distribution point.
About device statuses
Open Single Management Platform assigns a status to each managed device. The particular status depends on whether the conditions defined by the user are met. In some cases, when assigning a status to a device, Open Single Management Platform takes into consideration the device's visibility flag on the network (see the table below). If Open Single Management Platform does not find a device on the network within two hours, the visibility flag of the device is set to Not Visible.
The statuses are the following:
- Critical or Critical/Visible
- Warning or Warning/Visible
- OK or OK/Visible
The table below lists the default conditions that must be met to assign the Critical or Warning status to a device, with all possible values.
Conditions for assigning a status to a device
Condition |
Condition description |
Available values |
|---|---|---|
Security application is not installed |
Network Agent is installed on the device, but a security application is not installed. |
|
Too many viruses detected |
Some viruses have been found on the device by a task for virus detection, for example, the Malware scan task, and the number of viruses found exceeds the specified value. |
More than 0. |
Real-time protection level differs from the level set by the Administrator |
The device is visible on the network, but the real-time protection level differs from the level set (in the condition) by the administrator for the device status. |
|
Malware scan has not been performed in a long time |
The device is visible on the network and a security application is installed on the device, but neither the Malware scan task nor a local scan task has been run within the specified time interval. The condition is applicable only to devices that were added to the Administration Server database 7 days ago or earlier. |
More than 1 day. |
Databases are outdated |
The device is visible on the network and a security application is installed on the device, but the anti-virus databases have not been updated on this device within the specified time interval. The condition is applicable only to devices that were added to the Administration Server database 1 day ago or earlier. |
More than 1 day. |
Not connected in a long time |
Network Agent is installed on the device, but the device has not connected to an Administration Server within the specified time interval, because the device was turned off. |
More than 1 day. |
Active threats are detected |
The number of unprocessed objects in the Active threats folder exceeds the specified value. |
More than 0 items. |
Restart is required |
The device is visible on the network, but an application requires the device restart longer than the specified time interval and for one of the selected reasons. |
More than 0 minutes. |
Incompatible applications are installed |
The device is visible on the network, but software inventory performed through Network Agent has detected incompatible applications installed on the device. |
|
Software vulnerabilities have been detected |
The device is visible on the network and Network Agent is installed on the device, but the Find vulnerabilities and required updates task has detected vulnerabilities with the specified severity level in applications installed on the device. |
|
License expired |
The device is visible on the network, but the license has expired. |
|
License expires soon |
The device is visible on the network, but the license will expire on the device in less than the specified number of days. |
More than 0 days. |
Check for Windows Update updates has not been performed in a long time |
The device is visible on the network, but the Perform Windows Update synchronization task has not been run within the specified time interval. |
More than 1 day. |
Invalid encryption status |
Network Agent is installed on the device, but the device encryption result is equal to the specified value. |
|
Mobile device settings do not comply with the policy |
The mobile device settings are other than the settings that were specified in the Kaspersky Endpoint Security for Android policy during the check of compliance rules. |
|
Unprocessed security issues detected |
Some unprocessed security issues have been found on the device. Security issues can be created either automatically, through managed Kaspersky applications installed on the client device, or manually by the administrator. |
|
Device status defined by application |
The status of the device is defined by the managed application. |
|
Device is out of disk space |
Free disk space on the device is less than the specified value, or the device could not be synchronized with the Administration Server. The Critical or Warning status is changed to the OK status when the device is successfully synchronized with the Administration Server and free space on the device is greater than or equal to the specified value. |
More than 0 MB. |
Device has become unmanaged |
During device discovery, the device was recognized as visible on the network, but more than three attempts to synchronize with the Administration Server failed. |
|
Protection is disabled |
The device is visible on the network, but the security application on the device has been disabled for longer than the specified time interval. In this case, the state of the security application is stopped or failure, and differs from the following: starting, running, or suspended. |
More than 0 minutes. |
Security application is not running |
The device is visible on the network and a security application is installed on the device but is not running. |
|
Open Single Management Platform allows you to set up automatic switching of the status of a device in an administration group when specified conditions are met. When the specified conditions are met, the client device is assigned one of the following statuses: Critical or Warning. When the specified conditions are not met, the client device is assigned the OK status.
Different statuses may correspond to different values of one condition. For example, by default, if the Databases are outdated condition has the More than 3 days value, the client device is assigned the Warning status; if the value is More than 7 days, the Critical status is assigned.
When Open Single Management Platform assigns a status to a device, for some conditions (see the Condition description column in the table above) the visibility flag is taken into consideration. For example, if a managed device was assigned the Critical status because the Databases are outdated condition was met, and later the visibility flag was set for the device, then the device is assigned the OK status.
Configuring the switching of device statuses
You can change conditions to assign the Critical or Warning status to a device.
To enable changing the device status to Critical:
- In the main menu, go to Assets (Devices) → Hierarchy of groups.
- In the list of groups that opens, click the link with the name of a group for which you want to change switching the device statuses.
- In the properties window that opens, select the Device status tab.
- In the left pane, select Critical.
- In the right pane, in the Set to Critical if these are specified section, enable the condition to switch a device to the Critical status.
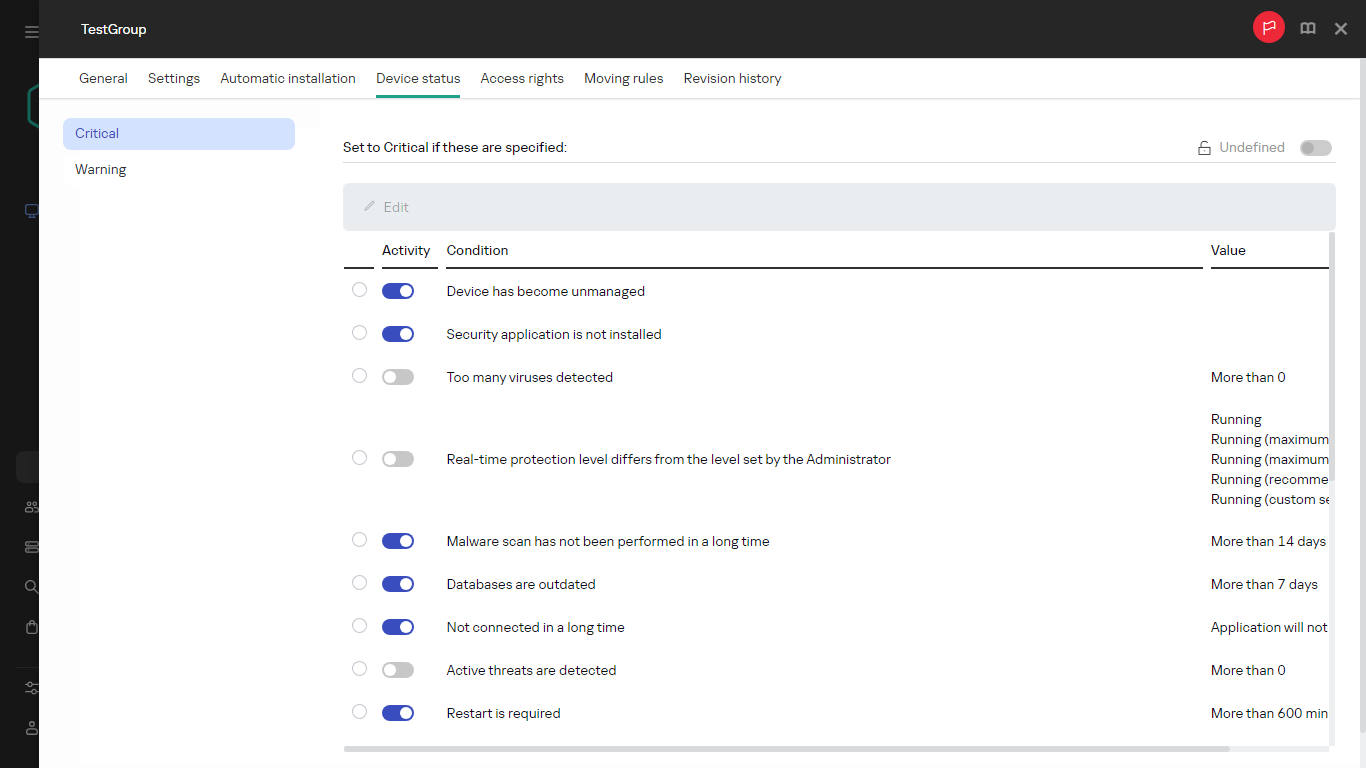
You can change only settings that are not locked in the parent policy.
- Select the radio button next to the condition in the list.
- In the upper-left corner of the list, click the Edit button.
- Set the required value for the selected condition.
Values cannot be set for every condition.
- Click OK.
When specified conditions are met, the managed device is assigned the Critical status.
To enable changing the device status to Warning:
- In the main menu, go to Assets (Devices) → Hierarchy of groups.
- In the list of groups that opens, click the link with the name of a group for which you want to change switching the device statuses.
- In the properties window that opens, select the Device status tab.
- In the left pane, select Warning.
- In the right pane, in the Set to Warning if these are specified section, enable the condition to switch a device to the Warning status.
You can change only settings that are not locked in the parent policy.
- Select the radio button next to the condition in the list.
- In the upper-left corner of the list, click the Edit button.
- Set the required value for the selected condition.
Values cannot be set for every condition.
- Click OK.
When specified conditions are met, the managed device is assigned the Warning status.
Device selections
Device selections are a tool for filtering devices according to specific conditions. You can use device selections to manage several devices: for example, to view a report about only these devices or to move all of these devices to another group.
Open Single Management Platform provides a broad range of predefined selections (for example, Devices with Critical status, Protection is disabled, Active threats are detected). Predefined selections cannot be deleted. You can also create and configure additional user-defined selections.
In user-defined selections, you can set the search scope and select all devices, managed devices, or unassigned devices. Search parameters are specified in the conditions. In the device selection you can create several conditions with different search parameters. For example, you can create two conditions and specify different IP ranges in each of them. If several conditions are specified, a selection displays the devices that meet any of the conditions. By contrast, search parameters within a condition are superimposed. If both an IP range and the name of an installed application are specified in a condition, only those devices will be displayed where both the application is installed and the IP address belongs to the specified range.
Viewing the device list from a device selection
Open Single Management Platform allows you to view the list of devices from a device selection.
To view the device list from the device selection:
- In the main menu, go to the Assets (Devices) → Device selections or Discovery & deployment → Device selections section.
- In the selection list, click the name of the device selection.
The page displays a table with information about the devices included in the device selection.
- You can group and filter the data of the device table as follows:
- Click the settings icon (), and then select the columns to be displayed in the table.
- Click the filter icon (), and then specify and apply the filter criterion in the invoked menu.
The filtered table of devices is displayed.
- Click the settings icon (
You can select one or several devices in the device selection and click the New task button to create a task that will be applied to these devices.
To move the selected devices of the device selection to another administration group, click the Move to group button, and then select the target administration group.
Page top
Creating a device selection
To create a device selection:
- In the main menu, go to Assets (Devices) → Device selections.
A page with a list of device selections is displayed.
- Click the Add button.
The Device selection settings window opens.
- Enter the name of the new selection.
- Specify the group that contains the devices to be included in the device selection:
- Find any devices—Searching for devices that meet the selection criteria and included in the Managed Devices or Unassigned devices group.
- Find managed devices—Searching for devices that meet the selection criteria and included in the Managed Devices group.
- Find unassigned devices—Searching for devices that meet the selection criteria and included in the Unassigned devices group.
You can enable the Include data from secondary Administration Servers check box to enable searching for devices that meet the selection criteria and managed by secondary Administration Servers.
- Click the Add button.
- In the window that opens, specify conditions that must be met for including devices in this selection, and then click the OK button.
- Click the Save button.
The device selection is created and added to the list of device selections.
Page top
Configuring a device selection
To configure a device selection:
- In the main menu, go to Assets (Devices) → Device selections.
A page with a list of device selections is displayed.
- Select the relevant user-defined device selection, and click the Properties button.
The Device selection settings window opens.
- On the General tab, click the New condition link.
- Specify conditions that must be met for including devices in this selection.
- Click the Save button.
The settings are applied and saved.
Below are descriptions of the conditions for assigning devices to a selection. Conditions are combined by using the OR logical operator: the selection will contain devices that comply with at least one of the listed conditions.
General
In the General section, you can change the name of the selection condition and specify whether that condition must be inverted:
Network infrastructure
In the Network subsection, you can specify the criteria that will be used to include devices in the selection according to their network data:
- Device name
- Domain
- Administration group
- Description
- IP range
- Managed by a different Administration Server
In the Domain controller subsection, you can configure criteria for including devices into a selection based on domain membership:
In the Network activity subsection, you can specify the criteria that will be used to include devices in the selection according to their network activity:
- Acts as a distribution point
- Do not disconnect from the Administration Server
- Connection profile switched
- Last connected to Administration Server
- New devices detected by network poll
- Device is visible
Device statuses
In the Managed device status subsection, you can configure criteria for including devices into a selection based on the description of the devices status from a managed application:
In the Status of components in managed applications subsection, you can configure criteria for including devices in a selection according to the statuses of components in managed applications:
- Data Leakage Prevention status
- Collaboration servers protection status
- Anti-virus protection status of mail servers
- Endpoint Sensor status
In the Status-affecting problems in managed applications subsection, you can specify the criteria that will be used to include devices in the selection according to the list of possible problems detected by a managed application. If at least one problem that you select exists on a device, the device will be included in the selection. When you select a problem listed for several applications, you have the option to select this problem in all of the lists automatically.
You can select check boxes for descriptions of statuses from the managed application; upon receipt of these statuses, the devices will be included in the selection. When you select a status listed for several applications, you have the option to select this status in all of the lists automatically.
System details
In the Operating system section, you can specify the criteria that will be used to include devices in the selection according to their operating system type.
- Platform type
- Operating system service pack version
- Operating system bit size
- Operating system build
- Operating system release number
In the Virtual machines section, you can set up the criteria to include devices in the selection according to whether these are virtual machines or part of virtual desktop infrastructure (VDI):
In the Hardware registry subsection, you can configure criteria for including devices into a selection based on their installed hardware:
Ensure that the lshw utility is installed on Linux devices from which you want to fetch hardware details. Hardware details fetched from virtual machines may be incomplete depending on the hypervisor used.
- Device
- Vendor
- Device name
- Description
- Device vendor
- Serial number
- Inventory number
- User
- Location
- CPU clock rate, in MHz, from
- CPU clock rate, in MHz, to
- Number of virtual CPU cores, from
- Number of virtual CPU cores, to
- Hard drive volume, in GB, from
- Hard drive volume, in GB, to
- RAM size, in MB, from
- RAM size, in MB, to
Third-party software details
In the Applications registry subsection, you can set up the criteria to search for devices according to applications installed on them:
- Application name
- Application version
- Vendor
- Application status
- Find by update
- Name of incompatible security application
- Application tag
- Apply to devices without the specified tags
In the Vulnerabilities and updates subsection, you can specify the criteria that will be used to include devices in the selection according to their Windows Update source:
WUA is switched to Administration Server
Details of Kaspersky applications
In the Kaspersky applications subsection, you can configure criteria for including devices in a selection based on the selected managed application:
- Application name
- Application version
- Critical update name
- Application status
- Select the period of the last update of modules
- Device is managed through Administration Server
- Security application is installed
In the Anti-virus protection subsection, you can set up the criteria for including devices in a selection based on their protection status:
In the Encryption subsection, you can configure the criterion for including devices in a selection based on the selected encryption algorithm:
The Application components subsection contains the list of components of those applications that have corresponding management plug-ins installed in OSMP Console.
In the Application components subsection, you can specify criteria for including devices in a selection according to the statuses and version numbers of the components that refer to the application that you select:
Tags
In the Tags section, you can configure criteria for including devices into a selection based on key words (tags) that were previously added to the descriptions of managed devices:
Apply if at least one specified tag matches
To add tags to the criterion, click the Add button, and select tags by clicking the Tag entry field. Specify whether to include or exclude the devices with the selected tags in the device selection.
Users
In the Users section, you can set up the criteria to include devices in the selection according to the accounts of users who have logged in to the operating system.
Device owner
In the Device owner section, you can set up the criteria to include devices in the selection according to the registered owners of the device, their roles, and their membership in security groups:
- Device owner
- Device owner's membership in Active Directory security group
- Device owner's role
- Device owner's membership in an internal security group
Exporting the device list from a device selection
Open Single Management Platform allows you to save information about devices from a device selection and export it as a CSV or a TXT file.
To export the device list from the device selection:
- Open the table with the devices from the device selection.
- Use one of the following ways to select the devices that you want to export:
- To select particular devices, select the check boxes next to them.
- To select all devices from the current table page, select the check box in the device table header, and then select the Select all on current page check box.
- To select all devices from the table, select the check box in the device table header, and then select the Select all check box.
- Click the Export to CSV or Export to TXT button. All information about the selected devices included in the table will be exported.
Note that if you applied a filter criterion to the device table, only the filtered data from the displayed columns will be exported.
Page top
Removing devices from administration groups in a selection
When working with a device selection, you can remove devices from administration groups right in this selection, without switching to the administration groups from which these devices must be removed.
To remove devices from administration groups:
- In the main menu, go to Assets (Devices) → Device selections or Discovery & deployment → Device selections.
- In the selection list, click the name of the device selection.
The page displays a table with information about the devices included in the device selection.
- Select the devices that you want to remove, and then click Delete.
The selected devices are removed from their respective administration groups.
Device tags
This section describes device tags, and provides instructions for creating and modifying them as well as for tagging devices manually or automatically.
Device tags
Open Single Management Platform allows you to tag devices. A tag is the string value that can be used for grouping, describing, or finding devices. Tags assigned to devices can be used for creating selections, for finding devices, and for distributing devices among administration groups.
You can tag devices manually or automatically. If you want to tag an individual device, you can use manual tagging. Auto-tagging is performed by Open Single Management Platform in one of the following ways:
- In accordance with the specified tagging rules.
- By an application.
We do not recommend that you use different ways of tagging to assign the same tag. For example, if the tag is assigned by the rule, it is not recommended to manually assign this tag to devices.
If the tags are assigned by rules, devices are tagged automatically when the specified rules are met. An individual rule corresponds to each tag. Rules are applied to the network properties of the device, operating system, applications installed on the device, and other device properties. For example, you can set up a rule that will assign the [CentOS] tag to all devices running CentOS operating system. Then, you can use this tag when creating a device selection; this will help you sort all CentOS devices and assign them a task.
A tag is automatically removed from a device in the following cases:
- When the device stops meeting conditions of the rule that assigns the tag.
- When the rule that assigns the tag is disabled or deleted.
The list of tags and the list of rules on each Administration Server are independent of all other Administration Servers, including a primary Administration Server or subordinate virtual Administration Servers. A rule is applied only to devices from the same Administration Server on which the rule is created.
Page top
Creating a device tag
To create a device tag:
- In the main menu, go to Assets (Devices) → Tags → Device tags.
- Click Add.
A new tag window opens.
- In the Tag field, enter the tag name.
- Click Save to save the changes.
The new tag appears in the list of device tags.
Renaming a device tag
To rename a device tag:
- In the main menu, go to Assets (Devices) → Tags → Device tags.
- Click the name of the tag that you want to rename.
A tag properties window opens.
- In the Tag field, change the tag name.
- Click Save to save the changes.
The updated tag appears in the list of device tags.
Deleting a device tag
You can delete only manually assigned tags.
To delete a manually assigned device tag:
- In the main menu, go to Assets (Devices) → Tags → Device tags.
The list of tags is displayed.
- Select the device tag that you want to delete.
- Click the Delete button.
- In the window that opens, click Yes.
The device tag is deleted. The deleted tag is automatically removed from all of the devices to which it was assigned.
When you delete a tag assigned to the device by an auto-tagging rule, the rule is not deleted, and the tag will be assigned to a new device when the device first meets the rule conditions. If you delete an auto-tagging rule, the tag specified in the rule conditions will be removed from all devices to which it was assigned but will not be deleted from the list of tags. If necessary, you can manually delete the tag from the list.
The deleted tag is not removed automatically from the device if this tag is assigned to the device by an application or Network Agent. To remove the tag from your device, use the klscflag utility.
Viewing devices to which a tag is assigned
To view devices to which a tag is assigned:
- In the main menu, go to Assets (Devices) → Tags → Device tags.
- Click the View devices link next to the tag for which you want to view assigned devices.
You will be redirected to the Managed devices section of the main menu, with the devices filtered by the tag for which you clicked the View devices link.
- If you want to return to the list of device tags, click the Back button of your browser.
After you view the devices to which the tag is assigned, you can either create and assign a new tag or assign the existing tag to other devices. In this case, you have to remove the filter by tag, select the devices, and then assign the tag.
Viewing tags assigned to a device
To view tags assigned to a device:
- In the main menu, go to Assets (Devices) → Managed devices.
- Click the name of the device whose tags you want to view.
- In the device properties window that opens, select the Tags tab.
The list of tags assigned to the selected device is displayed. In the Tag assigned column you can view how the tag was assigned.
You can assign another tag to the device or remove an already assigned tag. You can also view all device tags that exist on the Administration Server.
You can also view tags assigned to a device in the command line, by using the klscflag utility.
To view tags assigned to a device in the command line, run the following command:
/opt/kaspersky/klnagent64/sbin/klscflag -ssvget -pv 1103/1.0.0.0 -s KLNAG_SECTION_TAGS_INFO -n KLCONN_HOST_TAGS -svt ARRAY_T -ss "|ss_type = \"SS_PRODINFO\";"
Tagging a device manually
To assign a tag to a device manually:
- View tags assigned to the device to which you want to assign another tag.
- Click Add.
- In the window that opens, do one of the following:
- To create and assign a new tag, select Create new tag, and then specify the name of the new tag.
- To select an existing tag, select Assign existing tag, and then select the necessary tag in the drop-down list.
- Click OK to apply the changes.
- Click Save to save the changes.
The selected tag is assigned to the device.
Removing an assigned tag from a device
To remove a tag from a device:
- In the main menu, go to Assets (Devices) → Managed devices.
- Click the name of the device whose tags you want to view.
- In the device properties window that opens, select the Tags tab.
- Select the check box next to the tag that you want to remove.
- At the top of the list, click the Unassign tag? button.
- In the window that opens, click Yes.
The tag is removed from the device.
The unassigned device tag is not deleted. If you want, you can delete it manually.
You cannot manually remove tags assigned to the device by applications or Network Agent. To remove these tags, use the klscflag utility.
Viewing rules for tagging devices automatically
To view rules for tagging devices automatically,
Do any of the following:
- In the main menu, go to Assets (Devices) → Tags → Auto-tagging rules.
- In the main menu, go to Assets (Devices) → Tags → Device tags, and then click the Set up auto-tagging rules link.
- View tags assigned to a device and then click the Settings button.
The list of rules for auto-tagging devices appears.
Editing a rule for tagging devices automatically
To edit a rule for tagging devices automatically:
- View rules for tagging devices automatically.
- Click the name of the rule that you want to edit.
A rule settings window opens.
- Edit the general properties of the rule:
- In the Rule name field, change the rule name.
The name cannot be more than 256 characters long.
- Do any of the following:
- Enable the rule by switching the toggle button to Rule enabled.
- Disable the rule by switching the toggle button to Rule disabled.
- In the Rule name field, change the rule name.
- Do any of the following:
- If you want to add a new condition, click the Add button, and specify the settings of the new condition in the window that opens.
- If you want to edit an existing condition, click the name of the condition that you want to edit, and then edit the condition settings.
- If you want to delete a condition, select the check box next to the name of the condition that you want to delete, and then click Delete.
- Click OK in the conditions settings window.
- Click Save to save the changes.
The edited rule is shown in the list.
Creating a rule for tagging devices automatically
To create a rule for tagging devices automatically:
- View rules for tagging devices automatically.
- Click Add.
A new rule settings window opens.
- Configure the general properties of the rule:
- In the Rule name field, enter the rule name.
The name cannot be more than 256 characters long.
- Do one of the following:
- Enable the rule by switching the toggle button to Rule enabled.
- Disable the rule by switching the toggle button to Rule disabled.
- In the Tag field, enter the new device tag name or select one of the existing device tags from the list.
The name cannot be more than 256 characters long.
- In the Rule name field, enter the rule name.
- In the conditions section, click the Add button to add a new condition.
A new condition settings window open.
- Enter the condition name.
The name cannot be more than 256 characters long. The name must be unique within a rule.
- Set up the triggering of the rule according to the following conditions. You can select multiple conditions.
- Network—Network properties of the device, such as DNS name of the device or device inclusion in an IP subnet.
If case sensitive collation is set for the database that you use for Open Single Management Platform, keep case when you specify a device DNS name. Otherwise, the auto-tagging rule will not work.
- Applications—Presence of Network Agent on the device, operating system type, version, and architecture.
- Virtual machines—Device belongs to a specific type of virtual machine.
- Applications registry—Presence of applications of different vendors on the device.
- Network—Network properties of the device, such as DNS name of the device or device inclusion in an IP subnet.
- Click OK to save the changes.
If necessary, you can set multiple conditions for a single rule. In this case, the tag will be assigned to a device if it meets at least one condition.
- Click Save to save the changes.
The newly created rule is enforced on devices managed by the selected Administration Server. If the settings of a device meet the rule conditions, the device is assigned the tag.
Later, the rule is applied in the following cases:
- Automatically and periodically, depending on the server workload
- After you edit the rule
- When you run the rule manually
- After Administration Server detects a change in the settings of a device that meets the rule conditions or the settings of a group that contains such a device
You can create multiple tagging rules. A single device can be assigned multiple tags if you have created multiple tagging rules and if the respective conditions of these rules are met simultaneously. You can view the list of all assigned tags in the device properties.
Page top
Running rules for auto-tagging devices
When a rule is run, the tag specified in properties of this rule is assigned to devices that meet conditions specified in properties of the same rule. You can run only active rules.
To run rules for auto-tagging devices:
- View rules for tagging devices automatically.
- Select check boxes next to active rules that you want to run.
- Click the Run rule button.
The selected rules are run.
Deleting a rule for tagging devices automatically
To delete a rule for tagging devices automatically:
- View rules for tagging devices automatically.
- Select the check box next to the rule that you want to delete.
- Click Delete.
- In the window that opens, click Delete again.
The selected rule is deleted. The tag that was specified in properties of this rule is unassigned from all of the devices that it was assigned to.
The unassigned device tag is not deleted. If you want, you can delete it manually.
Data encryption and protection
Data encryption reduces the risk of unintentional leakage of sensitive and corporate data if your laptop or hard drive is stolen or lost. Also, data encryption allows you to prevent access by unauthorized users and applications.
You can use the data encryption feature if your network includes Windows-based managed devices with Kaspersky Endpoint Security for Windows installed. In this case, on devices running a Windows operating system, you can manage the following types of encryption:
- BitLocker Drive Encryption
- Kaspersky Disk Encryption
By using these components of Kaspersky Endpoint Security for Windows, you can, for example, enable or disable encryption, view the list of encrypted drives, or generate and view reports about encryption.
To configure encryption, define the Kaspersky Endpoint Security for Windows policy in Open Single Management Platform. Kaspersky Endpoint Security for Windows performs encryption and decryption according to the active policy. For detailed instructions on how to configure rules and for a description of encryption features, see the Kaspersky Endpoint Security for Windows Help.
Encryption management for a hierarchy of Administration Servers is currently not available in the Web Console. Use the primary Administration Server to manage encrypted devices.
You can show or hide some of the interface elements related to the encryption management feature by using the user interface settings.
Viewing the list of encrypted drives
In Open Single Management Platform, you can view details about encrypted drives and devices that are encrypted at the drive level. After the information on a drive is decrypted, the drive is automatically removed from the list.
To view the list of encrypted drives,
In the main menu, go to Operations → Data encryption and protection → Encrypted drives.
If the section is not on the menu, this means that it is hidden. In the user interface settings, enable the Show data encryption and protection option to display the section.
You can export the list of encrypted drives to a CSV or TXT file. To do this, click the Export to CSV or Export to TXT button.
Viewing the list of encryption events
When running data encryption or decryption tasks on devices, Kaspersky Endpoint Security for Windows sends Open Single Management Platform information about events of the following types:
- Cannot encrypt or decrypt a file, or create an encrypted archive, due to a lack of free disk space.
- Cannot encrypt or decrypt a file, or create an encrypted archive, due to license issues.
- Cannot encrypt or decrypt a file, or create an encrypted archive, due to missing access rights.
- The application has been prohibited from accessing an encrypted file.
- Unknown errors.
To view a list of events that occurred during data encryption on devices,
In the main menu, go to Operations → Data encryption and protection → Encryption events.
If the section is not on the menu, this means that it is hidden. In the user interface settings, enable the Show data encryption and protection option to display the section.
You can export the list of encrypted drives to a CSV or TXT file. To do this, click the Export to CSV or Export to TXT button.
Alternatively, you can examine the list of encryption events for every managed device.
To view the encryption events for a managed device:
- In the main menu, go to Assets (Devices) → Managed devices.
- Click on the name of a managed device.
- On the General tab, go to the Protection section.
- Click the View data encryption errors link.
Creating and viewing encryption reports
You can generate the following reports:
- Report on encryption status of managed devices. This report provides details about the data encryption of various managed devices. For example, the report shows the number of devices to which the policy with configured encryption rules applies. Also, you can find out, for instance, how many devices need to be rebooted. The report also contains information about the encryption technology and algorithm for every device.
- Report on encryption status of mass storage devices. This report contains similar information as the report on the encryption status of managed devices, but it provides data only for mass storage devices and removable drives.
- Report on rights to access encrypted drives. This report shows which user accounts have access to encrypted drives.
- Report on file encryption errors. This report contains information about errors that occurred when the data encryption or decryption tasks were run on devices.
- Report on blockage of access to encrypted files. This report contains information about blocking application access to encrypted files. This report is helpful if an unauthorized user or application tries to access encrypted files or drives.
You can generate any report in the Monitoring & reporting → Reports section. Alternatively, in the Operations → Data encryption and protection section, you can generate the following encryption reports:
- Report on encryption status of mass storage devices
- Report on rights to access encrypted drives
- Report on file encryption errors
To generate an encryption report in the Data encryption and protection section:
- Make sure that you enabled the Show data encryption and protection option in the Interface options.
- In the policy properties, open the Event configuration tab.
- In the Critical section, click Add event and select check box next to the event Error applying file encryption / decryption rules.
- Click OK.
- In the main menu, go to Operations → Data encryption and protection.
- Open one of the following sections:
- Encrypted drives generates the report on encryption status of mass storage devices or the report on rights to access encrypted drives.
- Encryption events generates the report on file encryption errors.
- Click the name of the report that you want to generate.
The report generation starts.
Granting access to an encrypted drive in offline mode
A user can request access to an encrypted device, for example, when Kaspersky Endpoint Security for Windows is not installed on the managed device. After you receive the request, you can create an access key file and send it to the user. All of the use cases and detailed instructions are provided in the Kaspersky Endpoint Security for Windows Help.
To grant access to an encrypted drive in offline mode:
- Get a request access file from a user (a file with the FDERTC extension). Follow the instructions in the Kaspersky Endpoint Security for Windows Help to generate the file in Kaspersky Endpoint Security for Windows.
- In the main menu, go to Operations → Data encryption and protection → Encrypted drives.
A list of encrypted drives appears.
- Select the drive to which the user requested access.
- Click the Grant access to the device in offline mode button.
- In the window that opens, select the Kaspersky Endpoint Security for Windows plug-in.
- Follow the instructions provided in the Kaspersky Endpoint Security for Windows Help (see the instructions for OSMP Console at the end of the section).
After that, the user applies the received file to access the encrypted drive and read data stored on the drive.
Changing the Administration Server for client devices
You can change the Administration Server to a different one for specific client devices. For this purpose, use the Change Administration Server task.
To change the Administration Server that manages client devices to a different Server:
- Connect to the Administration Server that manages the devices.
- Create the Administration Server change task.
The New task wizard starts. Follow the instructions of the wizard. In the New task window of the New task wizard, select the Kaspersky Security Center 15.2 application and the Change Administration Server task type. After that, specify the devices for which you want to change the Administration Server:
- Run the created task.
After the task is completed, the client devices for which it was created are put under the management of the Administration Server specified in the task settings.
If the Administration Server supports encryption and data protection and you are creating a Change Administration Server task, a warning is displayed. The warning states that if any encrypted data is stored on devices, after the new Server begins managing the devices, users will be able to access only the encrypted data with which they previously worked. In other cases, no access to encrypted data is provided. For detailed descriptions of scenarios in which access to encrypted data is not provided, refer to the Kaspersky Endpoint Security for Windows Help.
Page top
Viewing and configuring the actions when devices show inactivity
If client devices within a group are inactive, you can get notifications about it. You can also automatically delete such devices.
To view or configure the actions when the devices in the group show inactivity:
- In the main menu, go to Assets (Devices) → Hierarchy of groups.
- Click the name of the required administration group.
The hierarchy of administration groups
The administration group properties window opens.
- In the properties window, go to the Settings tab.
- In the Inheritance section, enable or disable the following options:
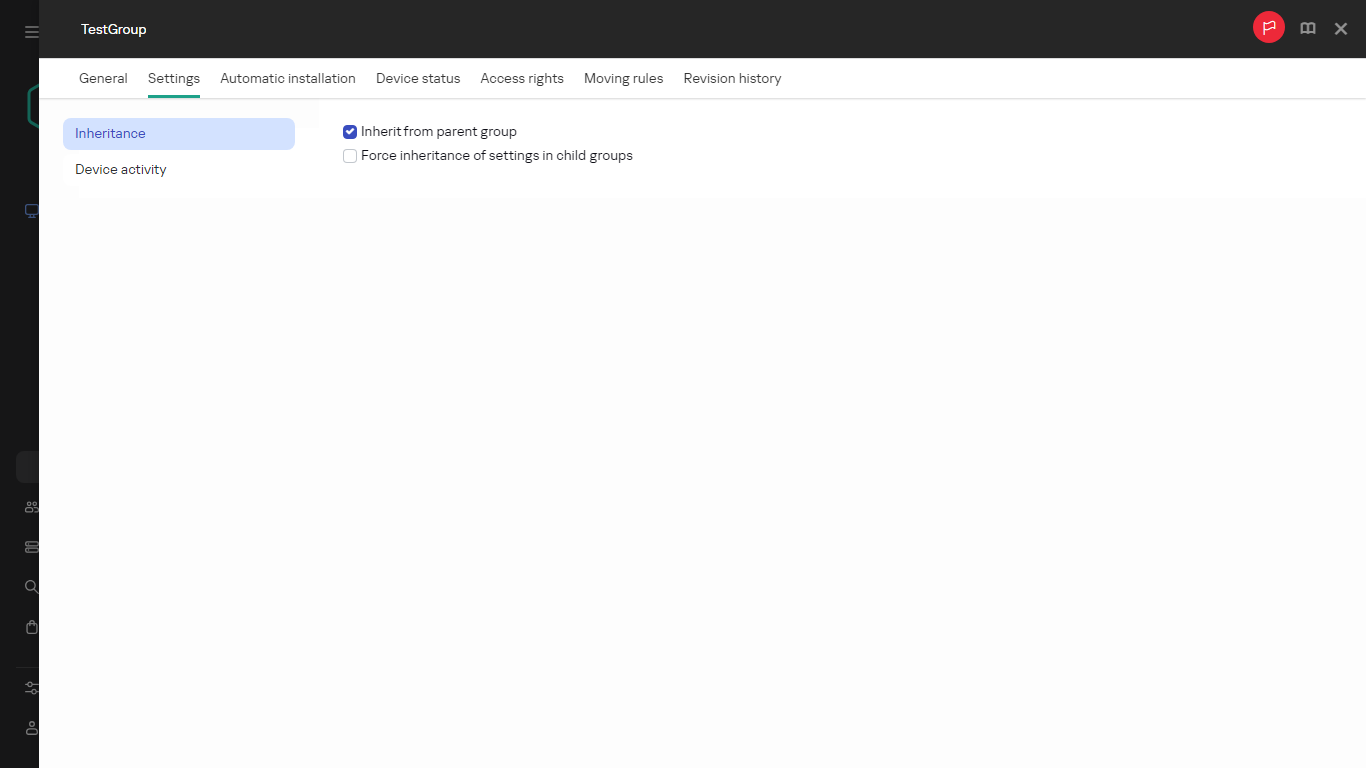
Administration group properties
- In the Device activity section, enable or disable the following options:
- Notify the administrator if the device has been inactive for longer than (days)
- Remove the device from the group if it has been inactive for longer than (days)
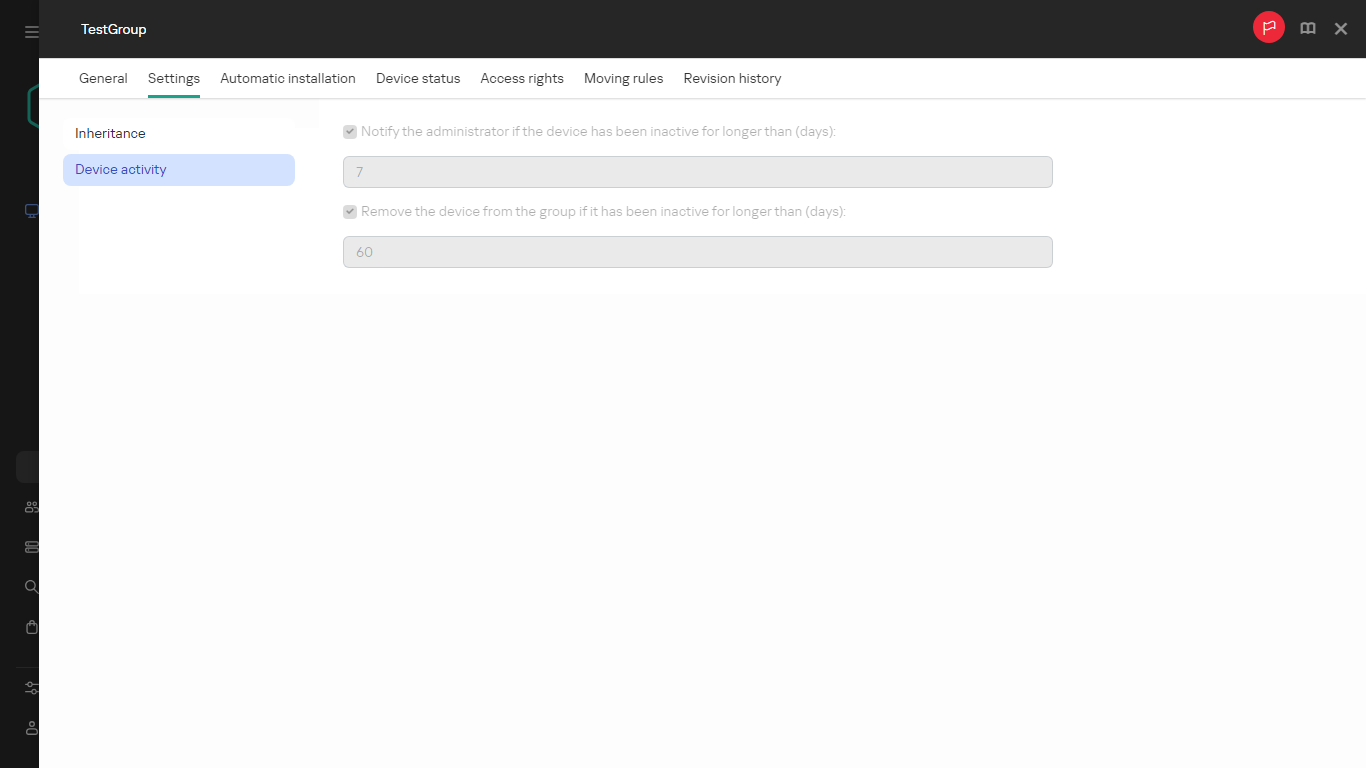
Administration group properties
- Click Save.
Your changes are saved and applied.
Page top
Deploying Kaspersky applications
This section describes Kaspersky applications deployment on client devices in your organization by means of OSMP Console.
Scenario: Kaspersky applications deployment
This scenario explains how to deploy Kaspersky applications through OSMP Console. You can use the Protection deployment wizard, or you can complete all necessary steps manually.
Stages
Kaspersky applications deployment proceeds in stages:
- Downloading and creating installation packages
Download the package manually.
If you cannot install Kaspersky applications by means of Open Single Management Platform on some devices, for example, on remote employees' devices, you can create stand-alone installation packages for applications. If you use stand-alone packages to install Kaspersky applications, you do not have to create and run a remote installation task, nor create and configure tasks for Kaspersky Endpoint Security for Windows.
Alternatively, you can download the distribution packages for Network Agent and security applications from the Kaspersky website. If the remote installation of the applications is not possible for some reason, you can use the downloaded distribution packages to install the applications locally.
- Creating, configuring, and running the remote installation task
This step is part of the Protection deployment wizard. If you choose not to run the Protection deployment wizard, you must create this task manually and configure it manually.
You also can manually create several remote installation tasks for different administration groups or different device selections. You can deploy different versions of one application in these tasks.
Make sure that all the devices on your network are discovered; then run the remote installation task (or tasks).
If you want to install Network Agent on devices with the SUSE Linux Enterprise Server 15 operating system, install the insserv-compat package first to configure Network Agent.
- Creating and configuring tasks
The Update task of Kaspersky Endpoint Security must be configured.
Create this task manually and configure it manually. Make sure that the schedule for the task meets your requirements. (By default, the scheduled start for the task is set to Manually, but you might want to choose another option.)
- Creating policies
Create the policy for Kaspersky Endpoint Security manually. You can use the default settings of the policy; you can also modify the default settings of the policy according to your needs at any time.
- Verifying the results
Make sure that deployment was completed successfully: you have policies and tasks for each application, and these applications are installed on the managed devices.
Results
Completion of the scenario yields the following:
- All required policies and tasks for the selected applications are created.
- The schedules of tasks are configured according to your needs.
- The selected applications are deployed, or scheduled to be deployed, on the selected client devices.
Protection deployment wizard
To install Kaspersky applications, you can use the Protection deployment wizard. The Protection deployment wizard enables remote installation of applications either through specially created installation packages or directly from a distribution package.
The Protection deployment wizard performs the following actions:
- Downloads an installation package for application installation (if it was not created earlier). The installation package is located at Discovery & deployment → Deployment & assignment → Installation packages. You can use this installation package for the application installation in the future.
- Creates and runs a remote installation task for specific devices or for an administration group. The newly created remote installation task is stored in the Tasks section. You can later start this task manually. The task type is Install application remotely.
If you want to install Network Agent on devices with the SUSE Linux Enterprise Server 15 operating system, install the insserv-compat package first to configure Network Agent.
Step 1. Starting Protection deployment wizard
You can start the Protection deployment wizard manually at any time.
To start the Protection deployment wizard manually,
In the main menu, go to Discovery & deployment → Deployment & assignment → Protection deployment wizard.
The Protection deployment wizard starts. Proceed through the wizard by using the Next button.
Page top
Step 2. Selecting the installation package
Select the installation package of the application that you want to install.
If the installation package of the required application is not listed, click the Add button and then select the application from the list.
Step 3. Selecting a method for distribution of key file or activation code
Select a method for the distribution of the key file or the activation code:
If the installation package already includes a key file or an activation code, this window is displayed, but it only contains the license key information.
Step 4. Selecting Network Agent version
If you selected the installation package of an application other than Network Agent, you also have to install Network Agent, which connects the application with Kaspersky Security Center Administration Server.
Select the latest version of Network Agent.
Page top
Step 5. Selecting devices
Specify a list of devices on which the application will be installed:
Step 6. Specifying the remote installation task settings
On the Remote installation task settings page, specify the settings for remote installation of the application.
In the Force installation package download settings group, specify how files that are required for the application installation are distributed to client devices:
- Using Network Agent
- Using operating system resources through distribution points
- Using operating system resources through Administration Server
Define the additional setting:
- Do not re-install application if it is already installed
- Assign package installation in Active Directory group policies
Step 7. Removing incompatible applications before installation
This step is only present if the application that you deploy is known to be incompatible with some other applications.
Select the option if you want Open Single Management Platform to automatically remove applications that are incompatible with the application you deploy.
The list of incompatible applications is also displayed.
If you do not select this option, the application will only be installed on devices that have no incompatible applications.
Page top
Step 8. Moving devices to Managed devices
Specify whether devices must be moved to an administration group after Network Agent installation.
The Do not move devices option is selected by default. For security reasons, you might want to move the devices manually.
Page top
Step 9. Selecting accounts to access devices
If necessary, add the accounts that will be used to start the remote installation task:
Page top
Step 10. Starting installation
This page is the final step of the wizard. At this step, the Remote installation task has been successfully created and configured.
By default, the Run the task after the wizard finishes option is not selected. If you select this option, the Remote installation task will start immediately after you complete the wizard. If you do not select this option, the Remote installation task will not start. You can later start this task manually.
Click OK to complete the final step of the Protection deployment wizard.
Page top
Adding management plug-ins for Kaspersky applications
For remote administration of Kaspersky applications by using OSMP Console, you must install management web plug-ins. Management web plug-in installation is possible after you deploy Kaspersky Next XDR Expert.
To install a management web plug-in for a Kaspersky application:
- Move the management web plug-in archive to the administrator host on which the KDT utility is located.
- If necessary, on the administrator host, export the current version of the configuration file.
You do not need to export the configuration file if the installation parameters are not added or modified.
- Run the following command to install the plug-in:
./kdt apply -k <path_to_plugin_archive> -i <path_to_configuration_file>In the command, specify the path to the plug-in archive and the path to the current configuration file. You do not need to specify the path to the configuration file in the command if the installation parameters are not added or modified.
The management web plug-in is installed. Reload OSMP Console to display the added plug-in.
You can view the list of components related to OSMP (including management web plug-ins) by using KDT. Also, you can view OSMP Console version and the list of installed management web plug-ins. To do this, in the main menu of OSMP Console, go to your account settings, and then select About.
Removing management web plug-ins
You can remove the management web plug-ins of Kaspersky applications that provide additional functionality for Kaspersky Next XDR Expert. The Kaspersky Next XDR Expert services plug-ins are used for the correct function of Kaspersky Next XDR Expert and cannot be removed (for example, the plug-in of Incident Response Platform).
To remove a management web plug-in:
If needed, run the following command to obtain the name of the plug-in that you want to remove:
./kdt statusThe list of components is displayed.
On the administrator host, run the following command. Specify the name of the plug-in that you want to remove:
./kdt remove --cnab <plug-in_name>
The specified management web plug-in is removed by KDT.
Page top
Viewing the list of components integrated in Open Single Management Platform
You can view the list of components integrated in OSMP (including management web plug-ins) by using KDT.
To view the list of components,
On the administrator host on which KDT is located, run the following command:
./kdt state
The list of components integrated in OSMP (including management web plug-ins) is displayed in the command line window.
Page top
Viewing names, parameters, and custom actions of Kaspersky Next XDR Expert components
KDT allows you to view the list of the Kaspersky Next XDR Expert components that are contained in the transport archive, as well as the list of installed components. Also, you can view the parameter list and the custom action list of a Kaspersky Next XDR Expert component. If custom actions are available for the component, you can also view the description and parameters of the specified custom action by using KDT.
Custom action is an action that allows you to perform additional operations specific to the Kaspersky Next XDR Expert component (except installation, update, deletion). For example, recovering Administration Server data and increasing the amount of disk space used for Administration Server and its logs are performed by using custom actions.
A custom action is run by using KDT as follows:./kdt invoke <component_name> --action <custom_action> --param <custom_action_parameter>
To view the list of Kaspersky Next XDR Expert components included in the transport archive,
On the administrator host where the KDT utility is located, run the following command. In the command, specify the path to the transport archive and its name:
./kdt describe -k <transport_archive_name_with_path>
To view the list of Kaspersky Next XDR Expert components,
On the administrator host where the KDT utility is located, run the following command:
./kdt describe
The lists of Kaspersky Next XDR Expert components are displayed.
To view the parameter list and the custom action list of the Kaspersky Next XDR Expert component,
On the administrator host where the KDT utility is located, run the following command and specify the name of the Kaspersky Next XDR Expert component:
./kdt describe <component_name>
The lists of the parameters and custom actions available for the specified component are displayed.
To view the description and the parameter list of the custom action,
On the administrator host where the KDT utility is located, run the following command and specify the Kaspersky Next XDR Expert component name and its command:
./kdt describe <component_name> <custom_action>
The description and the parameter list of the specified component custom action are displayed.
Page top
Downloading and creating installation packages for Kaspersky applications
You can create installation packages for Kaspersky applications from Kaspersky web servers if your Administration Server has access to the internet.
To download and create installation package for Kaspersky application:
- Do one of the following:
- In the main menu, go to Discovery & deployment → Deployment & assignment → Installation packages.
- In the main menu, go to Operations → Repositories → Installation packages.
You can also view notifications about new packages for Kaspersky applications in the list of onscreen notifications. If there are notifications about a new package, you can click the link next to the notification and proceed to the list of available installation packages.
A list of installation packages available on Administration Server is displayed.
- Click Add.
The New package wizard starts. Proceed through the wizard by using the Next button.
- Select Create an installation package for a Kaspersky application.
A list of available installation packages on Kaspersky web servers appears. The list contains installation packages only for those applications that are compatible with the current version of Open Single Management Platform.
- Click the name of an installation package, for example, Kaspersky Endpoint Security for Linux.
A window opens with information about the installation package.
You can download and use an installation package which includes cryptographic tools that implement strong encryption, if it complies with applicable laws and regulations. To download the installation package of Kaspersky Endpoint Security for Windows valid for the needs of your organization, consult the legislation of the country where the client devices of your organization are located.
- Read the information and click the Download and create installation package button.
If a distribution package can not be converted to an installation package, the Download distribution package button instead of the Download and create installation package is displayed.
The downloading of the installation package to Administration Server starts. You can close the wizard's window or proceed to the next step of the instruction. If you close the wizard's window, the download process will continue in background mode.
If you want to track an installation package download process:
- In the main menu, go to Operations → Repositories → Installation packages → In progress ().
- Track the operation progress in the Download progress column and the Download status column of the table.
When the process is complete, the installation package is added to the list on the Downloaded tab. If the download process stops and the download status switches to Accept EULA, then click the installation package name, and then proceed to the next step of the instruction.
If the size of data contained in the selected distribution package exceeds the current limit, an error message is displayed. You can change the limit value and then proceed with the installation package creation.
- For some Kaspersky applications, during the download process the Show EULA button is displayed. If it is displayed, do the following:
- Click the Show EULA button to read the End User License Agreement (EULA).
- Read the EULA that is displayed on the screen, and click Accept.
The downloading continues after you accept the EULA. If you click Decline, the download is stopped.
- When the downloading is complete, click the Close button.
The installation package is displayed in the list of installation packages.
Creating installation packages from a file
You can use custom installation packages to do the following:
- To install any application (such as a text editor) on a client device, for example, by means of a task.
- To create a stand-alone installation package.
A custom installation package is a folder with a set of files. The source to create a custom installation package is an archive file. The archive file contains a file or files that must be included in the custom installation package.
While creating a custom installation package, you can specify command-line parameters, for example, to install the application in silent mode.
To create a custom installation package:
- Do one of the following:
- In the main menu, go to Discovery & deployment → Deployment & assignment → Installation packages.
- In the main menu, go to Operations → Repositories → Installation packages.
A list of installation packages available on the Administration Server is displayed.
- Click Add.
The New package wizard starts. Proceed through the wizard by using the Next button.
- Select Create an installation package from a file.
- Specify the package name and click the Browse button.
- In the window that opens, choose an archive file located on the available disks.
You can upload a ZIP, CAB, TAR, or TAR.GZ archive file. It is not possible to create an installation package from an SFX (self-extracting archive) file.
File upload to the Administration Server starts.
- If you specified a file of a Kaspersky application, you may be prompted to read and accept the End User License Agreement (EULA) for the application. To continue, you must accept the EULA. Select the Accept the terms and conditions of this End User License Agreement option only if you have fully read, understand and accept the terms of the EULA.
Additionally, you may be prompted to read and accept the Privacy Policy. To continue, you must accept the Privacy Policy. Select the I accept the Privacy Policy option only if you understand and agree that your data will be handled and transmitted (including to third countries) as described in the Privacy Policy.
- Select a file (from the list of files that are extracted from the chosen archive file) and specify the command-line parameters of an executable file.
You can specify command-line parameters to install the application from the installation package in a silent mode. Specifying command-line parameters is optional.
The process to create the installation package is started.
The wizard informs you when the process is finished.
If the installation package is not created, an appropriate message is displayed.
- Click the Finish button to close the wizard.
The installation package appears in the list of installation packages.
In the list of installation packages available on Administration Server, by clicking the link with the name of a custom installation package, you can:
- View the following properties of an installation package:
- Name. Custom installation package name.
- Source. Application vendor name.
- Application. Application name packed into the custom installation package.
- Version. Application version.
- Language. Language of the application packed into the custom installation package.
- Size (MB). Size of the installation package.
- Operating system. Type of the operating system for which the installation package is intended.
- Created. Installation package creation date.
- Modified. Installation package modification date.
- Type. Type of the installation package.
- Change the command-line parameters.
Creating stand-alone installation packages
You and device users in your organization can use stand-alone installation packages to install applications on devices manually.
A stand-alone installation package is an executable file that you can store on the Web Server or in the shared folder, send by email, or transfer to a client device by another method. On the client device, the user can run the received file locally to install an application without involving Open Single Management Platform. You can create stand-alone installation packages for Kaspersky applications and for third-party applications. To create a stand-alone installation package for a third-party application you must create a custom installation package.
Be sure that stand-alone installation package is not available for third persons.
To create a stand-alone installation package:
- Do one of the following:
- In the main menu, go to Discovery & deployment → Deployment & assignment → Installation packages.
- In the main menu, go to Operations → Repositories → Installation packages.
A list of installation packages available on Administration Server is displayed.
- In the list of installation packages, select an installation package and, above the list, click the Deploy button.
- Select the Using a stand-alone package option.
The Stand-alone installation package creation wizard starts. Proceed through the wizard by using the Next button.
- Make sure that the Install Network Agent together with this application option is enabled if you want to install Network Agent together with the selected application.
By default, this option is enabled. It is recommended to enable this option if you are not sure whether Network Agent is installed on the device. If Network Agent is already installed on the device, after the stand-alone installation package with Network Agent installed Network Agent will be updated to the newer version.
If you disable this option, Network Agent will not be installed on the device and the device will be unmanaged.
If a stand-alone installation package for the selected application already exists on Administration Server, the wizard informs you about this fact. In this case, you must select one of the following actions:
- Create stand-alone installation package. Select this option, for example, if you want to create a stand-alone installation package for a new application version and also want to retain a stand-alone installation package that you created for a previous application version. The new stand-alone installation package is placed in another folder.
- Use existing stand-alone installation package. Select this option if you want to use an existing stand-alone installation package. The process of package creation will not be started.
- Rebuild existing stand-alone installation package. Select this option if you want to create a stand-alone installation package for the same application again. The stand-alone installation package is placed in the same folder.
- On the Move to list of managed devices step, the Do not move devices option is selected by default. If you do not want to move the client device to any administration group after Network Agent installation, do not change choice of option.
If you want to move client device after Network Agent installation, select the Move unassigned devices to this group option and specify an administration group to which you want to move the client device. By default, the device is moved to the Managed devices group.
- When the process of the stand-alone installation package creation is finished, click the FINISH button.
The Stand-alone Installation Package Creation Wizard closes.
The stand-alone installation package is created and placed on the Web Server. You can view the list of stand-alone packages by clicking the View the list of stand-alone packages button above the list of installation packages.
Changing the limit on the size of custom installation package data
The total size of data unpacked during creation of a custom installation package is limited. The default limit is 1 GB.
If you attempt to upload an archive file that contains data exceeding the current limit, an error message is displayed. You might have to increase this limit value when creating installation packages from large distribution packages.
To change the limit value for the custom installation package size,
On the administrator host where the KDT utility is located, run the following command:
./kdt invoke ksc --action klscflag --param klscflag_param=" -fset -pv klserver -n MaxArchivePkgSize -t d -v <number of bytes>"
Where <number of bytes> is a number of bytes in hexadecimal or decimal format.
For example, if the required limit is 2 GB, you can specify the decimal value 2147483648 or the hexadecimal value 0x80000000. In this case, for a local installation of Administration Server, you can use the following command:
./kdt invoke ksc --action klscflag --param klscflag_param=" -fset -pv klserver -n MaxArchivePkgSize -t d -v 2147483648"
The limit on the size of custom installation package data is changed.
Page top
Installing Network Agent for Linux in silent mode (with an answer file)
You can install Network Agent on Linux devices by using an answer file—a text file that contains a custom set of installation parameters: variables and their respective values. Using this answer file allows you to run an installation in silent mode, that is, without user participation.
To perform installation of Network Agent for Linux in silent mode:
- If you want to install Network Agent on devices with the SUSE Linux Enterprise Server 15 operating system, install the insserv-compat package first to configure Network Agent.
If you want to install Network Agent on devices that use the operating system RED OS 7.3.4 or later or MSVSPHERE 9.2 or later, install the libxcrypt-compat package for the correct function of Network Agent.
- Read the End User License Agreement. Follow the steps below only if you understand and accept the terms of the End User License Agreement.
- Set the value of the KLAUTOANSWERS environment variable by entering the full name of the answer file (including the path), for example, as follows:
export KLAUTOANSWERS=/tmp/nagent_install/answers.txt - Create the answer file (in TXT format) in the directory that you have specified in the environment variable. Add to the answer file a list of variables in the VARIABLE_NAME=variable_value format, each variable on a separate line.
For correct usage of the answer file, you must include in it a minimum set of the three required variables:
- KLNAGENT_SERVER
- KLNAGENT_AUTOINSTALL
- EULA_ACCEPTED
You can also add any optional variables to use more specific parameters of your remote installation. The following table lists all of the variables that can be included in the answer file:
- Install Network Agent:
- To install Network Agent from an RPM package to a 32-bit operating system, execute the following command:
# rpm -i klnagent-<build number>.i386.rpm - To install Network Agent from an RPM package to a 64-bit operating system, execute the following command:
# rpm -i klnagent64-<build number>.x86_64.rpm - To install Network Agent from an RPM package on a 64-bit operating system for the Arm architecture, execute the following command:
# rpm -i klnagent64-<build number>.aarch64.rpm - To install Network Agent from a DEB package to a 32-bit operating system, execute the following command:
# apt-get install ./klnagent_<build number>_i386.deb - To install Network Agent from a DEB package to a 64-bit operating system, execute the following command:
# apt-get install ./klnagent64_<build number>_amd64.deb - To install Network Agent from a DEB package on a 64-bit operating system for the Arm architecture, execute the following command:
# apt-get install ./klnagent64_<build number>_arm64.deb
- To install Network Agent from an RPM package to a 32-bit operating system, execute the following command:
Installation of Network Agent for Linux starts in silent mode; the user is not prompted for any actions during the process.
Page top
Preparing a device running Astra Linux in the closed software environment mode for installation of Network Agent
Prior to the installation of Network Agent on a device running Astra Linux in the closed software environment mode, you must perform two preparation procedures—the one in the instructions below and general preparation steps for any Linux device.
Before you begin:
- Make sure that the device on which you want to install Network Agent for Linux is running one of the supported Linux distributions.
- Download the necessary Network Agent installation file from the Kaspersky website.
Run the commands provided in this instruction under an account with root privileges.
To prepare a device running Astra Linux in the closed software environment mode for installation of Network Agent:
- Open the
/etc/digsig/digsig_initramfs.conffile, and then specify the following setting:DIGSIG_ELF_MODE=1 - In the command line, run the following command to install the compatibility package:
apt install astra-digsig-oldkeys - Create a directory for the application key:
mkdir -p /etc/digsig/keys/legacy/kaspersky/ - Place the application key /opt/kaspersky/ksc64/share/kaspersky_astra_pub_key.gpg in the directory created in the previous step:
cp kaspersky_astra_pub_key.gpg /etc/digsig/keys/legacy/kaspersky/If the Open Single Management Platform distribution kit does not include the kaspersky_astra_pub_key.gpg application key, you can download it by clicking the link: https://media.kaspersky.com/utilities/CorporateUtilities/kaspersky_astra_pub_key.gpg.
- Update the RAM disks:
update-initramfs -u -k allReboot the system.
- Perform the preparation steps common for any Linux device.
The device is prepared. You can now proceed to the installation of Network Agent.
Page top
Viewing the list of stand-alone installation packages
You can view the list of stand-alone installation packages and properties of each stand-alone installation package.
To view the list of stand-alone installation packages for all installation packages:
Above the list, click the View the list of stand-alone packages button.
In the list of stand-alone installation packages, their properties are displayed as follows:
- Package name. Stand-alone installation package name that is automatically formed as the application name included in the package and the application version.
- Application name. Application name included in the stand-alone installation package.
- Application version.
- Network Agent installation package name. The property is displayed only if Network Agent is included in the stand-alone installation package.
- Network Agent version. The property is displayed only if Network Agent is included in the stand-alone installation package.
- Size. File size in MB.
- Group. Name of the group to which the client device is moved after Network Agent installation.
- Created. Date and time of the stand-alone installation package creation.
- Modified. Date and time of the stand-alone installation package modification.
- Path. Full path to the folder where the stand-alone installation package is located.
- Web address. Web address of the stand-alone installation package location.
- File hash. The property is used to certify that the stand-alone installation package was not changed by third-party persons and a user has the same file you have created and transferred to the user.
To view the list of stand-alone installation packages for specific installation package:
Select the installation package in the list and, above the list, click the View the list of stand-alone packages button.
In the list of stand-alone installation packages, you can do the following:
- Publish a stand-alone installation package on the Web Server by clicking the Publish button. Published stand-alone installation package is available for downloading for users whom you sent the link to the stand-alone installation package.
- Cancel publication of a stand-alone installation package on the Web Server by clicking the Unpublish button. Unpublished stand-alone installation package is available for downloading only for you and other administrators.
- Download a stand-alone installation package to your device by clicking the Download button.
- Send email with the link to a stand-alone installation package by clicking the Send by email button.
- Remove a stand-alone installation package by clicking the Remove button.
Distributing installation packages to secondary Administration Servers
Open Single Management Platform allows you to create installation packages for Kaspersky applications and for third-party applications, as well as distribute installation packages to client devices and install applications from the packages. To optimize the load on the primary Administration Server, you can distribute installation packages to secondary Administration Servers. After that, the secondary Servers transmit the packages to client devices, and then you can perform the remote installation of the applications on your client devices.
To distribute installation packages to secondary Administration Servers:
- Make sure that the secondary Administration Servers are connected to the primary Administration Server.
- In the main menu, go to Assets (Devices) → Tasks.
The list of tasks is displayed.
- Click the Add button.
The New task wizard starts. Follow the steps of the wizard.
- On the New task settings page, from the Application drop-down list, select Kaspersky Security Center. Then, from the Task type drop-down list, select Distribute installation package, and then specify the task name.
- On the Task scope page, select the devices to which the task is assigned in one of the following ways:
- If you want to create a task for all secondary Administration Servers in a specific administration group, select this group, and then create a group task for it.
- If you want to create a task for specific secondary Administration Servers, select these Servers, and then create a task for them.
- On the Distributed installation packages page, select the installation packages that are to be copied to the secondary Administration Servers.
- Specify an account to run the Distribute installation package task under this account. You can use your account and keep the Default account option enabled. Alternatively, you can specify that the task should be run under another account that has the necessary access rights. To do this, select the Specify account option, and then enter the credentials of that account.
- On the Finish task creation page, you can enable the Open task details when creation is complete option to open the task properties window, and then modify the default task settings. Otherwise, you can configure the task settings later, at any time.
- Click the Finish button.
The task created for distributing installation packages to the secondary Administration Servers is displayed in the task list.
- You can run the task manually or wait for it to launch according to the schedule that you specified in the task settings.
After the task is completed, the selected installation packages are copied to the specified secondary Administration Servers.
Page top
Preparing a Linux device and installing Network Agent on a Linux device remotely
Network Agent installation is comprised of two steps:
- A Linux device preparation
- Network Agent remote installation
If you want to install Network Agent on devices that use the operating system RED OS 7.3.4 or later or MSVSPHERE 9.2 or later, install the libxcrypt-compat package for the correct function of Network Agent.
A Linux device preparation
To prepare a device running Linux for remote installation of Network Agent:
- Make sure that the following software is installed on the target Linux device:
- Sudo (for Ubuntu 10.04, Sudo version is 1.7.2p1 or later)
- Perl language interpreter version 5.10 or later
- Test the device configuration:
- Check whether you can connect to the device through an SSH client (such as PuTTY).
If you cannot connect to the device, open the
/etc/ssh/sshd_configfile and make sure that the following settings have the respective values listed below:PasswordAuthentication noChallengeResponseAuthentication yesDo not modify the /etc/ssh/sshd_config file if you can connect to the device with no issues; otherwise, you may encounter SSH authentication failure when running a remote installation task.
Save the file (if necessary) and restart the SSH service by using the
sudo service ssh restartcommand. - Disable the sudo password for the user account under which the device is to be connected.
- Use the
visudocommand in sudo to open the sudoers configuration file.In the file you have opened, add the following line to the end of the file: <
username> ALL = (ALL) NOPASSWD: ALL. In this case,<username>is the user account which is to be used for the device connection using SSH. If you are using the Astra Linux operating system, in the /etc/sudoers file, add the last line with the following text:%astra-admin ALL=(ALL:ALL) NOPASSWD: ALL - Save the sudoers file and then close it.
- Connect to the device again through SSH and make sure that the Sudo service does not prompt you to enter a password; you can do this using the
sudo whoamicommand.
- Check whether you can connect to the device through an SSH client (such as PuTTY).
- If you want to install Network Agent on devices running operating system with the systemd initialization system, open the
/etc/systemd/logind.conffile, and then do one of the following:- Specify
noas a value for theKillUserProcessessetting:KillUserProcesses=no. - For the
KillExcludeUserssetting, type the user name of the account under which the remote installation is to be performed, for example,KillExcludeUsers=root.
To apply the changed setting, restart the Linux device or execute the following command:
$ sudo systemctl restart systemd-logind.service - Specify
- If you want to install Network Agent on devices with the SUSE Linux Enterprise Server 15 operating system, install the insserv-compat package first to configure Network Agent.
- If you want to install Network Agent on devices that have the Astra Linux operating system running in the closed software environment mode, perform additional steps to prepare Astra Linux devices.
- If you want to install Network Agent on devices running Ubuntu Server or Ubuntu Desktop version 10.04, perform additional steps to prepare these devices.
Network Agent remote installation
To install Network Agent on Linux devices remotely:
- Download and create an installation package:
- Before installing the package on the device, make sure that it already has all the dependencies (programs and libraries) installed for this package.
You can view the dependencies for each package on your own, using utilities that are specific for the Linux distribution on which the package is to be installed. For more details about utilities, refer to your operating system documentation.
- Download the Network Agent installation package by using the application interface or from the Kaspersky website.
- To create a remote installation package, use the following files:
- klnagent.kpd
- akinstall.sh
- .deb or .rpm package of Network Agent
- Before installing the package on the device, make sure that it already has all the dependencies (programs and libraries) installed for this package.
- Create a remote installation task with the following settings:
- On the Settings page of the New task wizard, select the Using operating system resources through Administration Server check box. Clear all other check boxes.
- On the Selecting an account to run the task page specify the settings of the user account that is used for device connection through SSH.
- Run the remote installation task. Use the option for the
sucommand to preserve the environment:-m, -p, --preserve-environment.
Installing applications using a remote installation task
Open Single Management Platform allows you to install applications on devices remotely, using remote installation tasks. Those tasks are created and assigned to devices through a dedicated wizard. To assign a task more quickly and easily, you can specify devices (up to 1000 devices) in the wizard window in one of the following ways:
- Assign task to an administration group. In this case, the task is assigned to devices included in an administration group created earlier.
- Specify device addresses manually or import addresses from a list. You can specify DNS names, IP addresses, and IP subnets of devices to which you want to assign the task.
- Assign task to a device selection. In this case, the task is assigned to devices included in a selection created earlier. You can specify the default selection or a custom one that you created. You can only select up to 1000 devices.
For correct remote installation on a device with no Network Agent installed, the following ports must be opened: a) TCP 139 and 445; b) UDP 137 and 138. By default, these ports are opened on all devices included in the domain. They are opened automatically by the remote installation preparation utility.
Installing an application remotely
This section contains information on how to remotely install an application on devices in an administration group, devices with specific addresses, or a selection of devices.
To install an application on specific devices:
- In the main menu, go to Assets (Devices) → Tasks.
- Click Add.
The New task wizard starts.
- In the Task type field, select Install application remotely.
- Select one of the following options:
- Assign task to an administration group
- Specify device addresses manually or import addresses from a list
- Assign task to a device selection
The Install application remotely task is created for the specified devices. If you selected the Assign task to an administration group option, the task is a group one.
- At the Task scope step, specify an administration group, devices with specific addresses, or a device selection.
The available settings depend on the option selected at the previous step.
- At the Installation packages step, specify the following settings:
- In the Select installation package field, select the installation package of an application that you want to install.
- In the Force installation package download settings group, specify how files that are required for the application installation are distributed to client devices:
- In the Maximum number of concurrent downloads field, specify the maximum allowed number of client devices to which Administration Server can simultaneously transmit the files.
- In the Maximum number of installation attempts field, specify the maximum allowed number of installer runs.
If the number of attempts specified in the parameter is exceeded, Open Single Management Platform does not start the installer on the device anymore. To restart the Install application remotely task, increase the value of the Maximum number of installation attempts parameter and start the task. Alternatively, you can create a new Install application remotely task.
- If you migrate from one Kaspersky application to another and your current application is password-protected, enter the password in the Password to uninstall the current Kaspersky application field. Note that during the migration, your current Kaspersky application will be uninstalled.
The Password to uninstall the current Kaspersky application field is only available if you have selected the Using Network Agent option in the Force installation package download settings group.
You can use the uninstall password only for the Kaspersky Security for Windows Server to Kaspersky Endpoint Security for Windows migration scenario when installing Kaspersky Endpoint Security for Windows by using the Install application remotely task. Using the uninstall password when installing other components may cause installation errors.
To complete the migration scenario successfully, make sure that the following prerequisites are met:
- You are using Kaspersky Security Center Network Agent 14.2 for Windows or later.
- You are installing the application on devices running Windows.
- Define the additional setting:
- Select on which devices you want to install the application:
- Specify whether devices must be moved to an administration group after installation:
- Do not move devices
- Move unassigned devices to the selected group (only a single group can be selected)
Note that the Do not move devices option is selected by default. For security reasons, you might want to move the devices manually.
- At the this step of the wizard, specify whether the devices must be restarted during installation of applications:
- If necessary, at the Select accounts to access devices step, add the accounts that will be used to start the Install application remotely task:
- At the Finish task creation step, click the Finish button to create the task and close the wizard.
If you enabled the Open task details when creation is complete option, the task settings window opens. In this window, you can check the task parameters, modify them, or configure a task start schedule, if necessary.
- In the task list, select the task you created, and then click Start.
Alternatively, wait for the task to launch according to the schedule that you specified in the task settings.
When the remote installation task is completed, the selected application is installed on the specified devices.
Installing applications on secondary Administration Servers
To install an application on secondary Administration Servers:
- Establish a connection with the Administration Server that controls the relevant secondary Administration Servers.
- Make sure that the installation package corresponding to the application being installed is available on each of the selected secondary Administration Servers. If you cannot find the installation package on any of the secondary Servers, distribute it. For this purpose, create a task with the Distribute installation package task type.
- Create a task for a remote application installation on secondary Administration Servers. Select the Install application on secondary Administration Server remotely task type.
The New task wizard creates a task for remote installation of the application selected in the wizard on specific secondary Administration Servers.
- Run the task manually or wait for it to launch according to the schedule that you specified in the task settings.
When the remote installation task is complete, the selected application is installed on the secondary Administration Servers.
Page top
Specifying settings for remote installation on Unix devices
When you install an application on a Unix device by using a remote installation task, you can specify Unix-specific settings for the task. These settings are available in the task properties after the task is created.
To specify Unix-specific settings for a remote installation task:
- In the main menu, go to Assets (Devices) → Tasks.
- Click the name of the remote installation task for which you want to specify the Unix-specific settings.
The task properties window opens.
- Go to Application settings → Unix-specific settings.
- Specify the following settings:
- Click the Save button.
The specified task settings are saved.
Starting and stopping Kaspersky applications
You can use the Start or stop application task for starting and stopping Kaspersky applications on managed devices.
To create the Start or stop application task:
- In the main menu, go to Assets (Devices) → Tasks.
- Click Add.
The New task wizard starts. Proceed through the wizard by using the Next button.
- In the Application drop-down list, select the application for which you want to create the task.
- In the Task type list, select the Application activation task.
- In the Task name field, specify the name of the new task.
The task name cannot be more than 100 characters long and cannot include any special characters ("*<>?\:|).
- Select the devices to which the task will be assigned.
- In the Applications window, do the following:
- Select the check boxes next to the names of applications for which you want to create the task.
- Select the Start application or the Stop application option.
- If you want to modify the default task settings, enable the Open task details when creation is complete option at the Finish task creation step. If you do not enable this option, the task is created with the default settings. You can modify the default settings later, at any time.
- Click the Finish button.
The task is created and displayed in the list of tasks.
- Click the name of the created task to open the task properties window.
- In the task properties window, specify the general task settings according to your needs, and then save the settings.
The task is created and configured.
If you want to run the task, select it in the task list, and then click the Start button.
Page top
Replacing third-party security applications
Installation of Kaspersky security applications through Open Single Management Platform may require removal of third-party software that is incompatible with the application being installed. Open Single Management Platform provides several ways of removing the third-party applications.
Removing incompatible applications when configuring remote installation of an application
You can enable the Uninstall incompatible applications automatically option when you configure remote installation of a security application in the Protection deployment wizard. When this option is enabled, Open Single Management Platform removes incompatible applications before installing a security application on a managed device.
Removing incompatible applications through a dedicated task
To remove incompatible applications, use the Uninstall application remotely task. This task should be run on devices before the security application installation task. For example, in the installation task you can select On completing another task as the schedule type where the other task is Uninstall application remotely.
This method of uninstallation is useful when the security application installer cannot properly remove an incompatible application.
Page top
Removing applications or software updates remotely
You can remove applications or software updates on managed devices that run Linux remotely only by using Network Agent.
To remove applications or software updates remotely from selected devices:
- In the main menu, go to Assets (Devices) → Tasks.
- Click Add.
The New task wizard starts. Proceed through the wizard by using the Next button.
- In the Application drop-down list, select Open Single Management Platform.
- In the Task type list, select the Uninstall application remotely task type.
- In the Task name field, specify the name of the new task.
A task name cannot be more than 100 characters long and cannot include any special characters ("*<>?\:|).
- Select the devices to which the task will be assigned.
Go to the next step of the wizard.
- Select what kind of software you want to remove, and then select specific applications, updates, or patches that you want to remove:
- Specify how client devices will download the Uninstallation utility:
- Using Network Agent
- Using operating system resources through Administration Server
- Using operating system resources through distribution points
- Maximum number of concurrent downloads
- Maximum number of uninstallation attempts
- Verify operating system type before downloading
Go to the next step of the wizard.
- Specify the operating system restart settings:
- Do not restart the device
- Restart the device
- Prompt user for action
- Repeat prompt every (min)
- Restart after (min)
- Force closure of applications in blocked sessions
Go to the next step of the wizard.
- If necessary, add the accounts that will be used to start the remote uninstallation task:
- At the Finish task creation step of the wizard, enable the Open task details when creation is complete option to modify the default task settings.
If you do not enable this option, the task will be created with the default settings. You can modify the default settings later.
- Click the Finish button.
The wizard creates the task. If you enabled the Open task details when creation is complete option, the task properties window automatically opens. In this window, you can specify the general task settings and, if required, change the settings specified during task creation.
You can also open the task properties window by clicking the name of the created task in the list of tasks.
The task is created, configured, and displayed in the list of tasks at Assets (Devices) → Tasks.
- To run the task, select it in the task list, and then click the Start button.
You can also set a task start schedule on the Schedule tab of the task properties window.
For a detailed description of scheduled start settings, refer to the general task settings.
After the task is completed, the selected application is removed from the selected devices.
Remote uninstallation issues
Sometimes remote uninstallation of third-party applications may finish with the following warning: "Remote uninstallation has finished on this device with warnings: Application for removal is not installed." This issue occurs when the application to be uninstalled has already been uninstalled or was installed only for an individual user. Applications installed for an individual user (also referred to as per-user applications) become invisible and cannot be uninstalled remotely if the user is not logged in.
This behavior differs from applications intended for use by multiple users on the same device (also referred to as per-device applications). Per-device applications are visible and accessible to all users of the device.
Therefore, per-user applications must be uninstalled only when the user is logged in.
Source of information about installed applications
The Network Agent retrieves information about software installed on Windows devices from the following registry keys:
- HKEY_LOCAL_MACHINE\Software\Microsoft\Windows\CurrentVersion\Uninstall
Contains information about applications installed for all users.
- HKEY_LOCAL_MACHINE\Software\Wow6432Node\Microsoft\Windows\CurrentVersion\Uninstall
Contains information about applications installed for all users.
- HKEY_CURRENT_USER\Software\Microsoft\Windows\CurrentVersion\Uninstall
Contains information about applications installed for the current user.
- HKEY_USER<...>\Software\Microsoft\Windows\CurrentVersion\Uninstall
Contains information about applications installed for specific users.
Preparing a device running SUSE Linux Enterprise Server 15 for installation of Network Agent
To install Network Agent on a device with the SUSE Linux Enterprise Server 15 operating system:
Before the Network Agent installation, run the following command:
$ sudo zypper install insserv-compat
This enables you to install the insserv-compat package and configure Network Agent properly.
Run the rpm -q insserv-compat command to check whether the package is already installed.
If your network includes a lot of devices running SUSE Linux Enterprise Server 15, you can use the special software for configuring and managing the company infrastructure. By using this software, you can automatically install the insserv-compat package on all necessary devices at once. For example, you can use Puppet, Ansible, Chef, you can make your own script—use any method that is convenient for you.
If the device does not have the GPG signing keys for SUSE Linux Enterprise, you may encounter the following warning: Package header is not signed! Select the i option to ignore the warning.
After preparing the SUSE Linux Enterprise Server 15 device, deploy and install Network Agent.
Page top
Preparing a Windows device for remote installation
Remote installation of the application on the client device may return an error for the following reasons:
- The task has already been successfully performed on this device.
In this case, the task does not have to be performed again.
- When a task was started, the device was shut down.
In this case, turn on the device, and then restart the task.
- There is no connection between the Administration Server and the Network Agent installed on the client device.
To determine the cause of the problem, use the utility designed for remote diagnostics of client devices (klactgui).
- If Network Agent is not installed on the device, the following issues may occur during remote installation:
- Network errors
- Misconfigured operating system
- Incorrectly configured account rights in the remote installation task
To avoid issues that may occur during installation of the application on a client device without Network Agent installed, you must force the installation of selected installation packages by using the remote installation task of Open Single Management Platform—provided that each device has a user account with local administrator rights.
Previously, the riprep utility was used to prepare a Windows device for remote installation. This is now considered an outdated method for configuring operating systems. The riprep utility is not recommended for use on operating systems newer than Windows XP and Windows Server 2003 R2.
Forced installation can also be applied if devices cannot be directly accessed by Administration Server. For example, if the devices are on isolated networks or on a local network, while Administration Server is in the DMZ. In such cases, a distribution point is required for deployment to such devices.
Using distribution points as local installation centers may also be useful when performing installation on devices in subnets communicating with Administration Server via a low-capacity channel while a broader channel is available between devices in the same subnet.
In case of initial deployment, Network Agent is not installed. Therefore, in the settings of the remote installation task, you cannot select distribution of files required for application installation by using Network Agent. You can only choose to distribute files by using operating system resources through Administration Server or distribution points.
You should specify an account that has access to the admin$ share in the settings of the remote installation task.
You can specify target devices either explicitly (with a list), by selecting the Open Single Management Platform administration group to which they belong, or by creating a selection of devices based upon a specific criterion. The installation start time is defined by the task schedule. If the Run missed tasks setting is enabled in the task properties, the task can be run either immediately after target devices are turned on or when they are moved to the target administration group.
Forced installation consists of delivering installation packages to target devices, subsequent copying of files to the admin$ resource on each of the target devices, and remote registration of supporting services on those devices. Delivery of installation packages to target devices is performed through the Open Single Management Platform feature that ensures network interaction. The following conditions must be met in this case:
- Target devices are accessible from the distribution point with the Windows operating system, from which remote installation to client devices is to be carried out and this distribution point is selected for the target devices.
- Name resolution for target devices functions properly on the network.
- The administrative shares (admin$) remain enabled on target devices.
- The following system services are running on target devices:
- Server (LanmanServer)
By default, this service is running.
- DCOM Server Process Launcher (DcomLaunch)
- RPC Endpoint Mapper (RpcEptMapper)
- Remote Procedure Call (RpcSs)
- Server (LanmanServer)
- Port TCP 445 is open on target devices, to enable remote access through Windows tools.
TCP 139, UDP 137, and UDP 138 are used by older protocols and are no longer necessary for current applications.
Dynamic outbound access ports must be allowed on the firewall, for connections from distribution points to target devices.
- The Active Directory domain policy security settings are allowed to provide the operation of the NTLM protocol during the deployment of Network Agent.
- On target devices running Microsoft Windows XP, Simple File Sharing mode is disabled.
- On target devices, the access sharing and security model are set as Classic – local users authenticate as themselves. It can in no way be Guest only – local users authenticate as Guest.
- Target devices are members of the domain, or uniform accounts with administrator rights are created on target devices in advance.
To deploy Network Agent or other applications successfully to a device that is not joined to a Windows Server 2003 or later Active Directory domain, you must disable remote UAC on that device. Remote UAC is one of the reasons that prevent local administrative accounts from accessing admin$, which is necessary for forced deployment of Network Agent or other applications. Disabling remote UAC does not affect local UAC.
During installation on new devices that have not yet been allocated to any of the Open Single Management Platform administration groups, you can open the remote installation task properties and specify the administration group to which devices will be moved after Network Agent installation.
When creating a group task, keep in mind that each group task affects all devices in all nested groups within a selected group. Therefore, you must avoid duplicating installation tasks in subgroups.
A simplified way to create tasks for forced installation of applications is automatic installation. To do this, you must open the administration group properties, open the list of installation packages, and then select the ones that must be installed on devices in this group. As a result, the selected installation packages will be automatically installed on all devices in this group and all of its subgroups. The time interval over which the packages will be installed depends on the network throughput and the total number of networked devices.
You can use several distribution points to reduce the load during the delivery of installation packages to target devices. Note that this installation method places a significant load on devices acting as distribution points. If you use distribution points, you have to make sure that they are present in each of the isolated subnets hosting target devices.
The free disk space in the partition with the %ALLUSERSPROFILE%\Application Data\KasperskyLab\adminkit folder must exceed, by many times, the total size of the distribution packages of installed applications.
Page top
Configuring Kaspersky applications
This section contains information about manual configuration of policies and tasks, about user roles, about building an administration group structure and hierarchy of tasks.
Scenario: Configuring network protection
Create and configure policies and tasks required for your network.
Prerequisites
Before you start, make sure that you have done the following:
- Installed Kaspersky Security Center Administration Server
- Installed OSMP Console
- Completed the Open Single Management Platform main installation scenario
Configuring network protection proceeds in stages:
- Setup and propagation of Kaspersky application policies and policy profiles
To configure and propagate settings for Kaspersky applications installed on the managed devices, you can use two different security management approaches—device-centric or user-centric. These two approaches can also be combined.
- Configuring tasks for remote management of Kaspersky applications
Manually create and configure the following policies and tasks in the Managed devices administration group:
- Policy of Kaspersky Endpoint Security
- Group task for updating Kaspersky Endpoint Security
- Policy of Network Agent
How-to instructions: Setting up the group task for updating Kaspersky Endpoint Security.
If necessary, create additional tasks to manage the Kaspersky applications installed on the client devices.
- Evaluating and limiting the event load on the database
Information about events that occur during the operation of managed applications is transferred from a client device and registered in the Administration Server database. To reduce the load on the Administration Server, evaluate and limit the maximum number of events that can be stored in the database.
How-to instructions: Setting the maximum number of events.
Results
Upon completion of this scenario, your network will be protected by configuration of Kaspersky applications, tasks, and events received by the Administration Server:
- The Kaspersky applications are configured according to the policies and policy profiles.
- The applications are managed through a set of tasks.
- The maximum number of events that can be stored in the database is set.
When the network protection configuration is complete, you can proceed to configuring regular updates to Kaspersky databases and applications.
About device-centric and user-centric security management approaches
You can manage security settings from the standpoint of device features and from the standpoint of user roles. The first approach is called device-centric security management and the second is called user-centric security management. To apply different application settings to different devices, you can use either or both types of management in combination.
Device-centric security management enables you to apply different security application settings to managed devices depending on device-specific features. For example, you can apply different settings to devices allocated in different administration groups.
User-centric security management enables you to apply different security application settings to different user roles. You can create several user roles, assign an appropriate user role to each user, and define different application settings to the devices owned by users with different roles. For example, you may want to apply different application settings to devices of accountants and human resources (HR) specialists. As a result, when user-centric security management is implemented, each department—accounts department and HR department—has its own settings configuration for Kaspersky applications. A settings configuration defines which application settings can be changed by users and which are forcibly set and locked by the administrator.
By using user-centric security management, you can apply specific application settings to individual users. This may be required when an employee has a unique role in the company or when you want to monitor security issues related to devices of a specific person. Depending on the role of this employee in the company, you can expand or limit the rights of this person to change application settings. For example, you might want to expand the rights of a system administrator who manages client devices in a local office.
You can also combine the device-centric and user-centric security management approaches. For example, you can configure a specific application policy for each administration group, and then create policy profiles for one or several user roles of your enterprise. In this case, the policies and policy profiles are applied in the following order:
- The policies created for device-centric security management are applied.
- They are modified by the policy profiles according to the policy profile priorities.
- The policies are modified by the policy profiles associated with user roles.
Policy setup and propagation: Device-centric approach
When you complete this scenario, the applications will be configured on all of the managed devices in accordance with the application policies and policy profiles that you define.
Prerequisites
Before you start, make sure that you have installed Kaspersky Security Center Administration Server and OSMP Console. You might also want to consider user-centric security management as an alternative or additional option to the device-centric approach. Learn more about two management approaches.
Stages
The scenario of device-centric management of Kaspersky applications consists of the following steps:
- Configuring application policies
Configure settings for Kaspersky applications installed on the managed devices by creating a policy for each application. The set of policies will be propagated to the client devices.
If you have a hierarchical structure of several Administration Servers and/or administration groups, the secondary Administration Servers and child administration groups inherit the policies from the primary Administration Server by default. You can force the inheritance by the child groups and secondary Administration Servers to prohibit any modifications of the settings configured in the upstream policy. If you want only part of the settings to be forcibly inherited, you can lock them in the upstream policy. The rest unlocked settings will be available for modification in the downstream policies. The created hierarchy of policies will allow you to effectively manage devices in the administration groups.
How-to instructions: Creating a policy
- Creating policy profiles (optional)
If you want devices within a single administration group to run under different policy settings, create policy profiles for those devices. A policy profile is a named subset of policy settings. This subset is distributed on target devices together with the policy, supplementing it under a specific condition called the profile activation condition. Profiles only contain settings that differ from the "basic" policy, which is active on the managed device.
By using profile activation conditions, you can apply different policy profiles, for example, to the devices having a specific hardware configuration or marked with specific tags. Use tags to filter devices that meet specific criteria. For example, you can create a tag called CentOS, mark all devices running CentOS operating system with this tag, and then specify this tag as an activation condition for a policy profile. As a result, Kaspersky applications installed on all devices running CentOS will be managed by their own policy profile.
How-to instructions:
- Propagating policies and policy profiles to the managed devices
By default, the Administration Server automatically synchronizes with managed devices every 15 minutes. During the synchronization, the new or changed policies and policy profiles are propagated to the managed devices. You can circumvent auto-synchronization and run the synchronization manually by using the Force synchronization command. When synchronization is complete, the policies and policy profiles are delivered and applied to the installed Kaspersky applications.
You can check whether the policies and policy profiles were delivered to a device. Open Single Management Platform specifies the delivery date and time in the properties of the device.
How-to instructions: Forced synchronization
Results
When the device-centric scenario is complete, the Kaspersky applications are configured according to the settings specified and propagated through the hierarchy of policies.
The configured application policies and policy profiles will be applied automatically to the new devices added to the administration groups.
Policy setup and propagation: User-centric approach
This section describes the scenario of user-centric approach to the centralized configuration of Kaspersky applications installed on the managed devices. When you complete this scenario, the applications will be configured on all of the managed devices in accordance with the application policies and policy profiles that you define.
Prerequisites
Before you start, make sure that you have successfully installed Kaspersky Security Center Administration Server and OSMP Console, and completed the main deployment scenario. You might also want to consider device-centric security management as an alternative or additional option to the user-centric approach. Learn more about two management approaches.
Process
The scenario of user-centric management of Kaspersky applications consists of the following steps:
- Configuring application policies
Configure settings for Kaspersky applications installed on the managed devices by creating a policy for each application. The set of policies will be propagated to the client devices.
If you have a hierarchical structure of several Administration Servers and/or administration groups, the secondary Administration Servers and child administration groups inherit the policies from the primary Administration Server by default. You can force the inheritance by the child groups and secondary Administration Servers to prohibit any modifications of the settings configured in the upstream policy. If you want only part of the settings to be forcibly inherited, you can lock them in the upstream policy. The rest unlocked settings will be available for modification in the downstream policies. The created hierarchy of policies will allow you to effectively manage devices in the administration groups.
How-to instructions: Creating a policy
- Specifying owners of the devices
Assign the managed devices to the corresponding users.
How-to instructions: Assigning a user as a device owner
- Defining user roles typical for your enterprise
Think about different kinds of work that the employees of your enterprise typically perform. You must divide all employees in accordance with their roles. For example, you can divide them by departments, professions, or positions. After that you will need to create a user role for each group. Keep in mind that each user role will have its own policy profile containing application settings specific for this role.
- Creating user roles
Create and configure a user role for each group of employees that you defined on the previous step or use the predefined user roles. The user roles will contain set of rights of access to the application features.
How-to instructions: Creating a user role
- Defining the scope of each user role
For each of the created user roles, define users and/or security groups and administration groups. Settings associated with a user role apply only to devices that belong to users who have this role, and only if these devices belong to groups associated with this role, including child groups.
How-to instructions: Editing the scope of a user role
- Creating policy profiles
Create a policy profile for each user role in your enterprise. The policy profiles define which settings will be applied to the applications installed on users' devices depending on the role of each user.
How-to instructions: Creating a policy profile
- Associating policy profiles with the user roles
Associate the created policy profiles with the user roles. After that: the policy profile becomes active for a user that has the specified role. The settings configured in the policy profile will be applied to the Kaspersky applications installed on the user's devices.
How-to instructions: Associating policy profiles with roles
- Propagating policies and policy profiles to the managed devices
By default, Open Single Management Platform automatically synchronizes the Administration Server with the managed devices every 15 minutes. During the synchronization, the new or changed policies and policy profiles are propagated to the managed devices. You can circumvent auto-synchronization and run the synchronization manually by using the Force synchronization command. When synchronization is complete, the policies and policy profiles are delivered and applied to the installed Kaspersky applications.
You can check whether the policies and policy profiles were delivered to a device. Open Single Management Platform specifies the delivery date and time in the properties of the device.
How-to instructions: Forced synchronization
Results
When the user-centric scenario is complete, the Kaspersky applications are configured according to the settings specified and propagated through the hierarchy of policies and policy profiles.
For a new user, you will have to create a new account, assign the user one of the created user roles, and assign the devices to the user. The configured application policies and policy profiles will be automatically applied to the devices of this user.
Policies and policy profiles
In OSMP Console, you can create policies for Kaspersky applications. This section describes policies and policy profiles, and provides instructions for creating and modifying them.
About policies and policy profiles
A policy is a set of Kaspersky application settings that are applied to an administration group and its subgroups. You can install several Kaspersky applications on the devices of an administration group. Kaspersky Security Center provides a single policy for each Kaspersky application in an administration group. A policy has one of the following statuses:
The status of the policy
Status |
Description |
|---|---|
Active |
The current policy that is applied to the device. Only one policy may be active for a Kaspersky application in each administration group. Devices apply the settings values of an active policy for a Kaspersky application. |
Inactive |
A policy that is not currently applied to a device. |
Out-of-office |
If this option is selected, the policy becomes active when the device leaves the corporate network. |
Policies function according to the following rules:
- Multiple policies with different values can be configured for a single application.
- Only one policy can be active for the current application.
- A policy can have child policies.
Generally, you can use policies as preparations for emergency situations, such as a virus attack. For example, if there is an attack via flash drives, you can activate a policy that blocks access to flash drives. In this case, the current active policy automatically becomes inactive.
In order to prevent maintaining multiple policies, for example, when different occasions assume changing of several settings only, you may use policy profiles.
A policy profile is a named subset of policy settings values that replaces the settings values of a policy. A policy profile affects the effective settings formation on a managed device. Effective settings are a set of policy settings, policy profile settings, and local application settings that are currently applied for the device.
Policy profiles function according to the following rules:
- A policy profile takes effect when a specific activation condition occurs.
- Policy profiles contain values of settings that differ from the policy settings.
- Activation of a policy profile changes the effective settings of the managed device.
- A policy can include a maximum of 100 policy profiles.
About lock and locked settings
Each policy setting has a lock button icon (). The table below shows lock button statuses:
Lock button statuses
Status |
Description |
|---|---|
|
If an open lock is displayed next to a setting and the toggle button is disabled, the setting is not specified in the policy. A user can change these settings in the managed application interface. These type of settings are called unlocked. |
|
If a closed lock is displayed next to a setting and the toggle button is enabled, the setting is applied to the devices where the policy is enforced. A user cannot modify the values of these settings in the managed application interface. These type of settings are called locked. |


We highly recommend that you close locks for the policy settings that you want to apply on the managed devices. The unlocked policy settings can be reassigned by Kaspersky application settings on a managed device.
You can use a lock button for performing the following actions:
- Locking settings for an administration subgroup policy
- Locking settings of a Kaspersky application on a managed device
Thus, a locked setting is used for implementing effective settings on a managed device.
A process of effective settings implementation includes the following actions:
- Managed device applies settings values of Kaspersky application.
- Managed device applies locked settings values of a policy.
A policy and managed Kaspersky application contain the same set of settings. When you configure policy settings, the Kaspersky application settings change values on a managed device. You cannot adjust locked settings on a managed device (see the figure below):
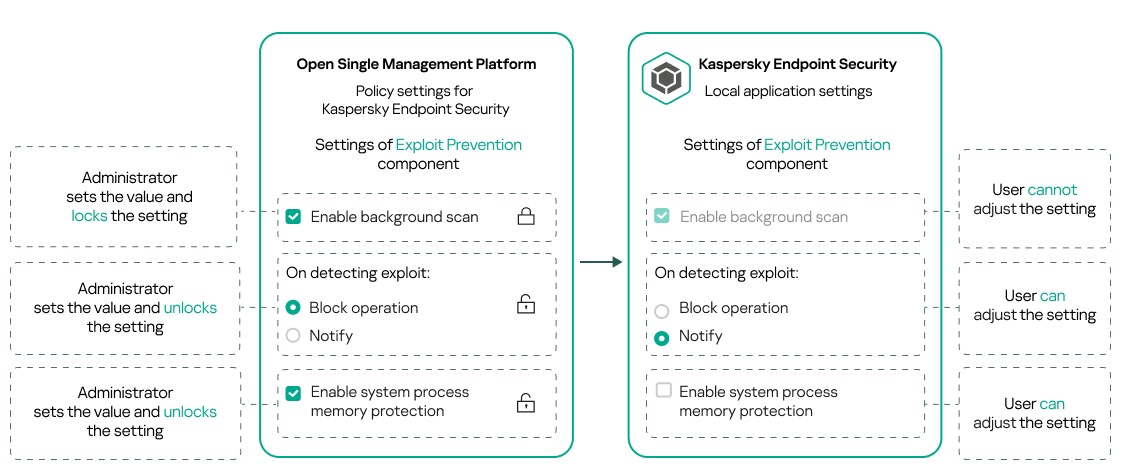
Locks and Kaspersky application settings
Inheritance of policies and policy profiles
This section provides information about the hierarchy and inheritance of policies and policy profiles.
Hierarchy of policies
If different devices need different settings, you can organize devices into administration groups.
You can specify a policy for a single administration group. Policy settings can be inherited. Inheritance means receiving policy settings values in subgroups (child groups) from a policy of a higher-level (parent) administration group.
Hereinafter, a policy for a parent group is also referred to as a parent policy. A policy for a subgroup (child group) is also referred to as a child policy.
By default, at least one managed devices group exists on Administration Server. If you want to create custom groups, they are created as subgroups (child groups) within the managed devices group.
Policies of the same application act on each other, according to a hierarchy of administration groups. Locked settings from a policy of a higher-level (parent) administration group will reassign policy settings values of a subgroup (see the figure below).
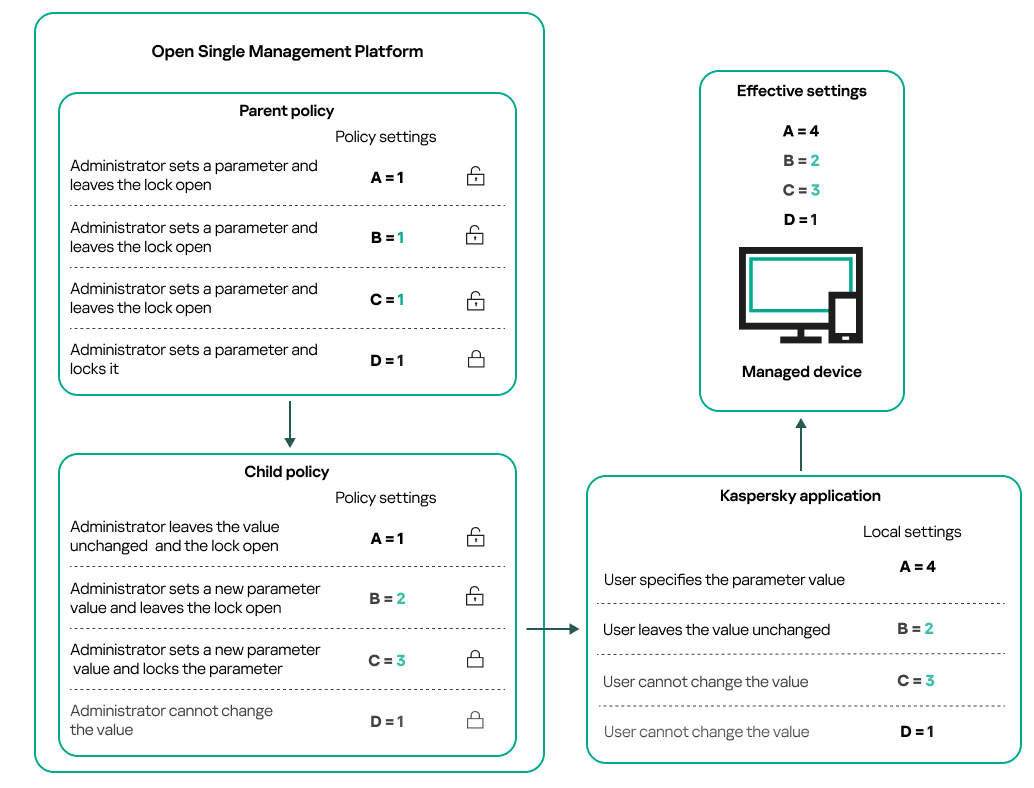
Hierarchy of policies
Page top
Policy profiles in a hierarchy of policies
Policy profiles have the following priority assignment conditions:
- A profile's position in a policy profile list indicates its priority. You can change a policy profile priority. The highest position in a list indicates the highest priority (see the figure below).
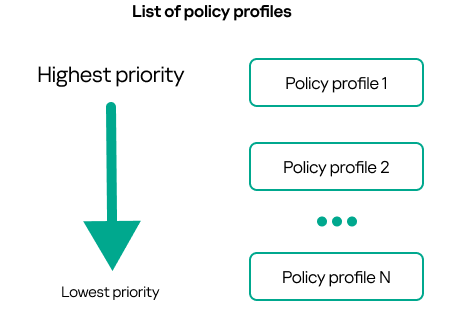
Priority definition of a policy profile
- Activation conditions of policy profiles do not depend on each other. Several policy profiles can be activated simultaneously. If several policy profiles affect the same setting, the device takes the setting value from the policy profile with the highest priority (see the figure below).

Managed device configuration fulfills activation conditions of several policy profiles
Policy profiles in a hierarchy of inheritance
Policy profiles from different hierarchy level policies comply with the following conditions:
- A lower-level policy inherits policy profiles from a higher-level policy. A policy profile inherited from a higher-level policy obtains higher priority than the original policy profile's level.
- You cannot change a priority of an inherited policy profile (see the figure below).
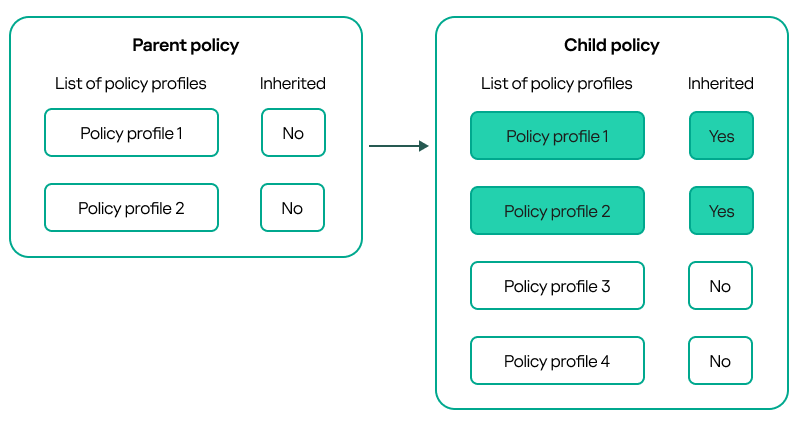
Inheritance of policy profiles
Policy profiles with the same name
If there are two policies with the same names in different hierarchy levels, these policies function according to the following rules:
- Locked settings and the profile activation condition of a higher-level policy profile changes the settings and profile activation condition of a lower-level policy profile (see the figure below).

Child profile inherits settings values from a parent policy profile
- Unlocked settings and the profile activation condition of a higher-level policy profile do not change the settings and profile activation condition of a lower-level policy profile.
How settings are implemented on a managed device
Implementation of effective settings on a managed device can be described as follows:
- The values of all settings that have not been locked are taken from the policy.
- Then they are overwritten with the values of managed application settings.
- And then the locked settings values from the effective policy are applied. Locked settings values change the values of unlocked effective settings.
Managing policies
This section describes managing policies and provides information about viewing the list of policies, creating a policy, modifying a policy, copying a policy, moving a policy, forced synchronization, viewing the policy distribution status chart, and deleting a policy.
Viewing the list of policies
You can view lists of policies created for the Administration Server or for any administration group.
To view a list of policies:
- In the main menu, go to Assets (Devices) → Hierarchy of groups.
- In the administration group structure, select the administration group for which you want to view the list of policies.
The list of policies appears in tabular format. If there are no policies, the table is empty. You can show or hide the columns of the table, change their order, view only lines that contain a value that you specify, or use search.
Creating a policy
You can create policies; you can also modify and delete existing policies.
To create a policy:
- In the main menu, go to Assets (Devices) → Policies & profiles.
- Select the administration group for which the policy is to be created:
- For the root group.
In this case you can proceed to the next step.
- For a subgroup:
- Click the current path link at the top of the window.
- In the panel that opens, click the link with the name of the required subgroup.
The current path changes to reflect the selected subgroup.
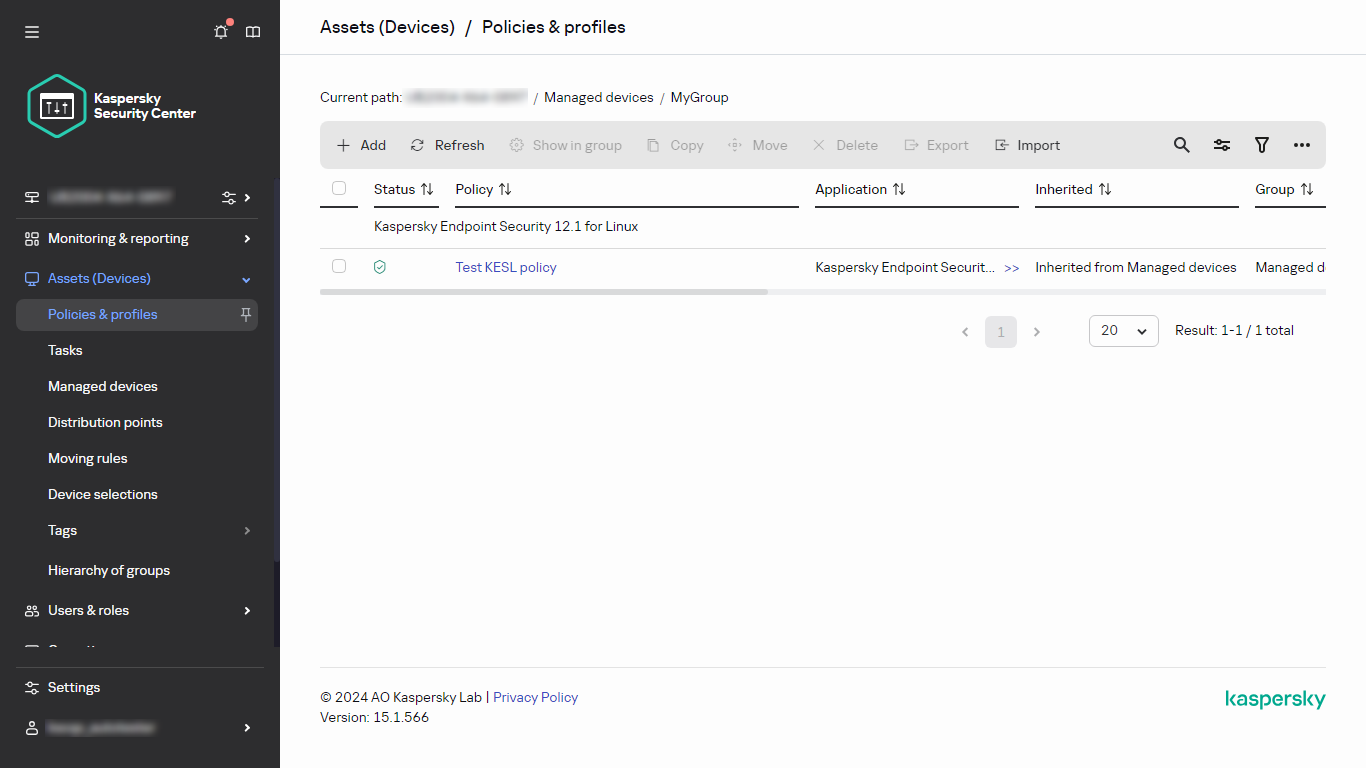
- For the root group.
- Click Add.
The Select application window opens.
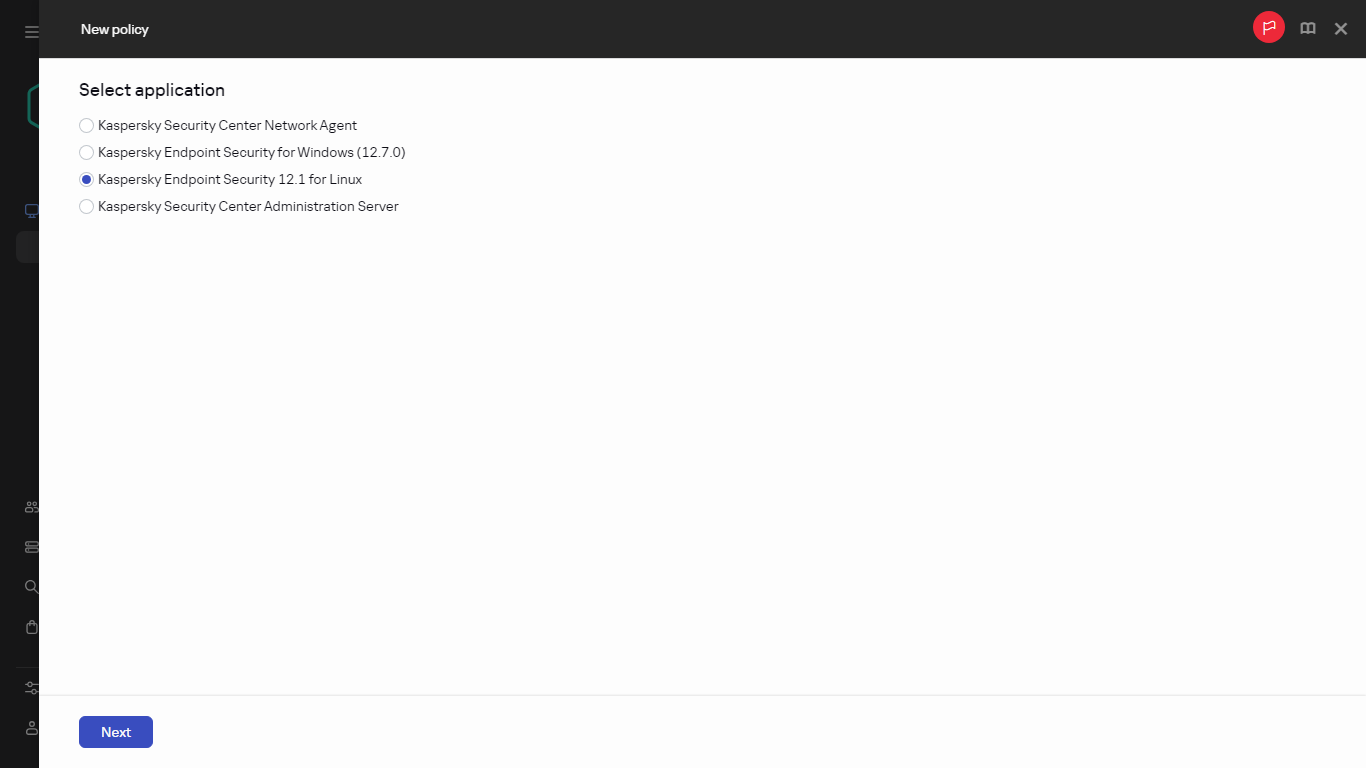
- Select the application for which you want to create a policy.
- Click Next.
The new policy settings window opens with the General tab selected. If you want, change the default name, default status, and default inheritance settings of the policy.
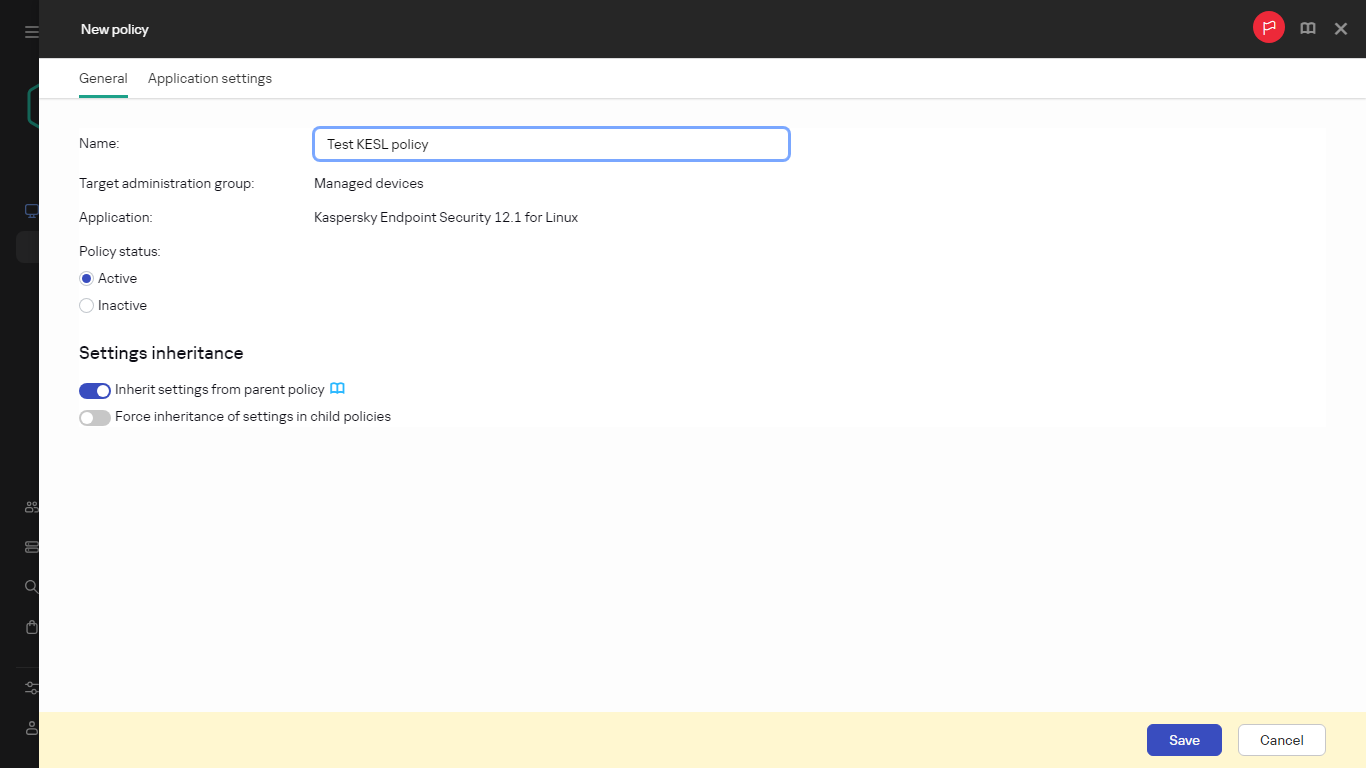
- Select the Application settings tab.
Or, you can click Save and exit. The policy will appear in the list of policies, and you can edit its settings later.
- On the Application settings tab, in the left pane select the category that you want and in the results' pane on the right, edit the settings of the policy. You can edit policy settings in each category (section).
The set of settings depends on the application for which you create a policy. For details, refer to the following:
- Administration Server configuration
- Network Agent policy settings
- Kaspersky Endpoint Security for Linux Help
- Kaspersky Endpoint Security for Windows Help
For details about settings of other security applications, refer to the documentation for the corresponding application.
When editing the settings, you can click Cancel to cancel the last operation.
- Click Save to save the policy.
The policy will appear in the list of policies.
General policy settings
General
In the General tab, you can modify the policy status and specify the inheritance of policy settings:
- In the Policy status block, you can select one of the policy modes:
- In the Settings inheritance settings group, you can configure the policy inheritance:
Event configuration
The Event configuration tab allows you to configure event logging and event notification. Events are distributed by importance level on the following tabs:
- Critical
The Critical section is not displayed in the Network Agent policy properties.
- Functional failure
- Warning
- Info
In each section, the list shows the types of events and the default event storage term on the Administration Server (in days). Clicking an event type lets you specify the following settings:
- Event registration
You can specify how many days to store the event and select where to store the event:
- Export to SIEM system by using Syslog
- Store in the OS event log on device
- Store in the OS event log on Administration Server
- Event notifications
You can select if you want to be notified about the event in one of the following ways:
- Notify by email
- Notify by SMS
- Notify by running an executable file or script
- Notify by SNMP
By default, the notification settings specified on the Administration Server properties tab (such as recipient address) are used. If you want, you can change these settings in the Email, SMS, and Executable file to be run tabs.
Revision history
The Revision history tab allows you to view the list of the policy revisions and roll back changes made to the policy, if necessary.
Modifying a policy
To modify a policy:
- In the main menu, go to Assets (Devices) → Policies & profiles.
- Click the policy that you want to modify.
The policy settings window opens.
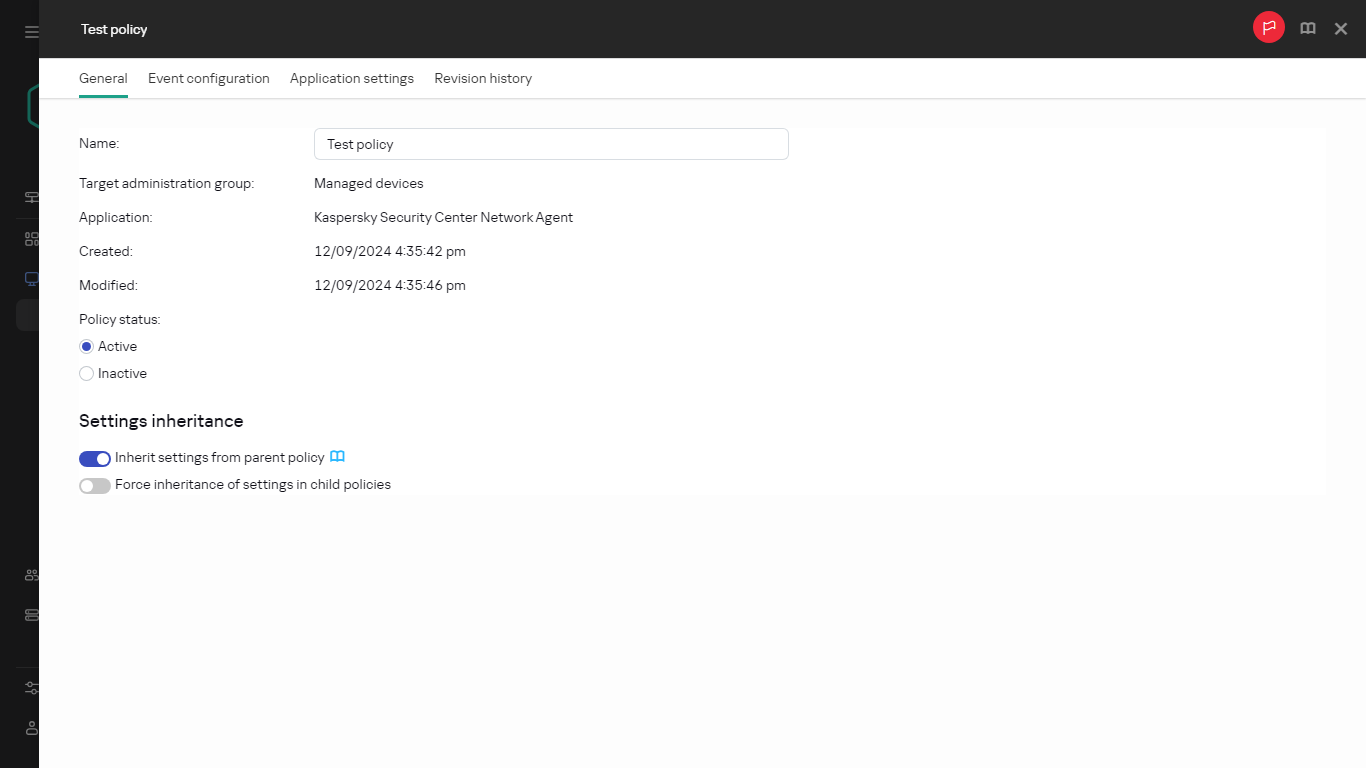
- Specify the general settings and settings of the application for which you create a policy. For details, refer to the following:
- Administration Server configuration
- Network Agent policy settings
- Kaspersky Endpoint Security for Linux Help
- Kaspersky Endpoint Security for Windows Help
For details about settings of other security applications, refer to the documentation for that application.
- Click Save.
The changes made to the policy will be saved in the policy properties, and will appear in the Revision history section.
Page top
Enabling and disabling a policy inheritance option
To enable or disable the inheritance option in a policy:
- Open the required policy.
- Open the General tab.
- Enable or disable policy inheritance:
- If you enable Inherit settings from parent policy in a child policy and an administrator locks some settings in the parent policy, then you cannot change these settings in the child policy.
- If you disable Inherit settings from parent policy in a child policy, then you can change all of the settings in the child policy, even if some settings are locked in the parent policy.
- If you enable Force inheritance of settings in child policies in the parent group, this enables the Inherit settings from parent policy option for each child policy. In this case, you cannot disable this option for any child policy. All of the settings that are locked in the parent policy are forcibly inherited in the child groups, and you cannot change these settings in the child groups.
- Click the Save button to save changes or click the Cancel button to reject changes.
By default, the Inherit settings from parent policy option is enabled for a new policy.
If a policy has profiles, all of the child policies inherit these profiles.
Copying a policy
You can copy policies from one administration group to another.
To copy a policy to another administration group:
- In the main menu, go to Assets (Devices) → Policies & profiles.
- Select the check box next to the policy (or policies) that you want to copy.
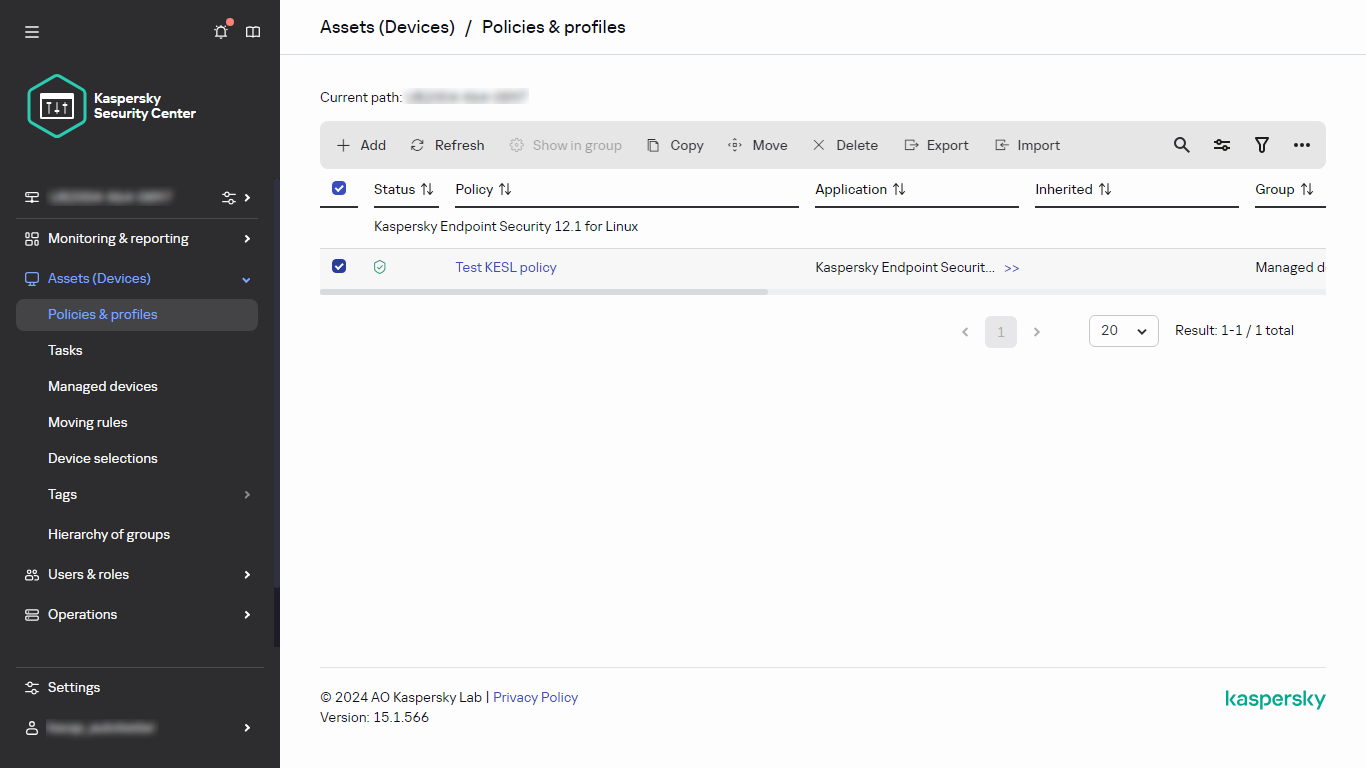
- Click the Copy button.
On the right side of the screen, the tree of the administration groups appears.
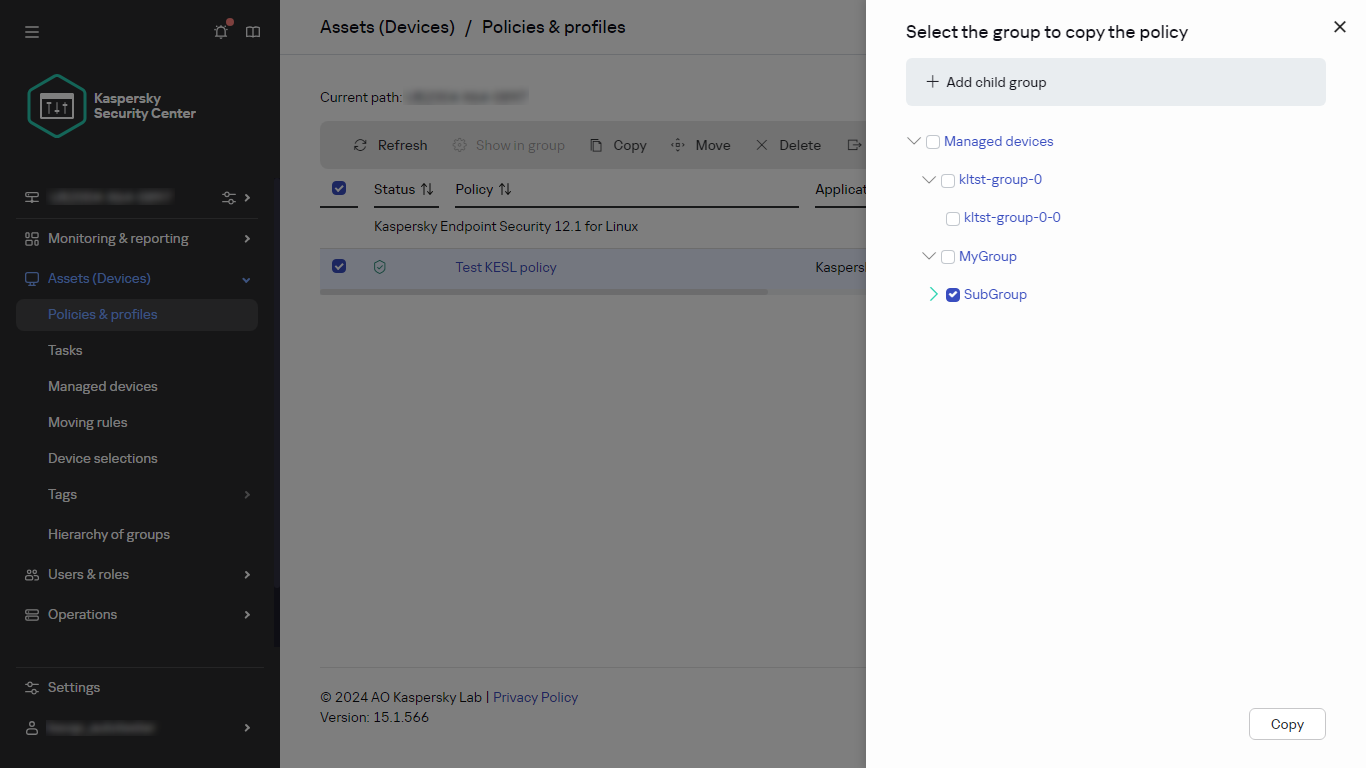
- In the tree, select the target group, that is, the group to which you want to copy the policy (or policies).
- Click the Copy button at the bottom of the screen.
- Click OK to confirm the operation.
The policy (policies) will be copied to the target group with all its profiles. The status of each copied policy in the target group will be Inactive. You can change the status to Active at any time.
If a policy with the name identical to that of the newly moved policy already exists in the target group, the name of the newly moved policy is expanded with the (<next sequence number>) index, for example: (1).
Moving a policy
You can move policies from one administration group to another. For example, you want to delete a group, but you want to use its policies for another group. In this case, you may want move the policy from the old group to the new one before deleting the old group.
To move a policy to another administration group:
- In the main menu, go to Assets (Devices) → Policies & profiles.
- Select the check box next to the policy (or policies) that you want to move.
- Click the Move button.
On the right side of the screen, the tree of the administration groups appears.

- In the tree, select the target group, that is, the group to which you want to move the policy (or policies).
- Click the Move button at the bottom of the screen.
- Click OK to confirm the operation.
If a policy is not inherited from the source group, it is moved to the target group with all its profiles. The status of the policy in the target group is Inactive. You can change the status to Active at any time.
If a policy is inherited from the source group, it remains in the source group. It is copied to the target group with all its profiles. The status of the policy in the target group is Inactive. You can change the status to Active at any time.
If a policy with the name identical to that of the newly moved policy already exists in the target group, the name of the newly moved policy is expanded with the (<next sequence number>) index, for example: (1).
Exporting a policy
Open Single Management Platform allows you to save a policy, its settings, and the policy profiles to a KLP file. You can use this KLP file to import the saved policy both to Kaspersky Security Center Windows and Kaspersky Security Center Linux.
To export a policy:
- In the main menu, go to Assets (Devices) → Policies & profiles.
- Select the check box next to the policy that you want to export.
You cannot export multiple policies at the same time. If you select more than one policy, the Export button will be disabled.
Selecting a policy for export
- Click the Export button.
- In the opened Save as window, specify the policy file name and path. Click the Save button.
The Save as window is displayed only if you use Google Chrome, Microsoft Edge, or Opera. If you use another browser, the policy file is automatically saved in the Downloads folder.
Importing a policy
Open Single Management Platform allows you to import a policy from a KLP file. The KLP file contains the exported policy, its settings, and the policy profiles.
To import a policy:
- In the main menu, go to Assets (Devices) → Policies & profiles.
- Click the Import button.
- Click the Browse button to choose a policy file that you want to import.
- In the opened window, specify the path to the KLP policy file, and then click the Open button. Note that you can select only one policy file.
The policy processing starts.
- After the policy is processed successfully, select the administration group to which you want to apply the policy.
- Click the Complete button to finish the policy import.
The notification with the import results appears. If the policy is imported successfully, you can click the Details link to view the policy properties.
After a successful import, the policy is displayed in the policy list. The settings and profiles of the policy are also imported. Regardless of the policy status that was selected during the export, the imported policy is inactive. You can change the policy status in the policy properties.
If the newly imported policy has a name identical to that of an existing policy, the name of the imported policy is expanded with the (<next sequence number>) index, for example: (1), (2).
Page top
Forced synchronization
Although Open Single Management Platform automatically synchronizes the status, settings, tasks, and policies for managed devices, in some cases the administrator must know for certain, at a given moment, whether synchronization has already been performed for a specified device.
Synchronizing a single device
To force synchronization between the Administration Server and a managed device:
- In the main menu, go to Assets (Devices) → Managed devices.
- Click the name of the device that you want to synchronize with the Administration Server.
A property window opens with the General section selected.
- Click the Force synchronization button.
The application synchronizes the selected device with the Administration Server.
Synchronizing multiple devices
To force synchronization between the Administration Server and multiple managed devices:
- Open the device list of an administration group or a device selection:
- In the main menu, go to Assets (Devices) → Managed devices, click the path link in the Current path field above the list of managed devices, then select the administration group that contains devices to synchronize.
- Run a device selection to view the device list.
- Select the check boxes next to the devices that you want to synchronize with the Administration Server.
- Above the list of managed devices, click the ellipsis button (
 ), and then click the Force synchronization button.
The application synchronizes the selected devices with the Administration Server.
- In the device list, check that the time of last connection to the Administration Server has changed, for the selected devices, to the current time. If the time has not changed, update the page content by clicking the Refresh button.
The selected devices are synchronized with the Administration Server.
Viewing the time of a policy delivery
After changing a policy for a Kaspersky application on the Administration Server, the administrator can check whether the changed policy has been delivered to a specific managed device. A policy can be delivered during a regular synchronization or a forced synchronization.
To view the date and time that an application policy was delivered to a managed device:
- In the main menu, go to Assets (Devices) → Managed devices.
- Click the name of the device that you want to synchronize with the Administration Server.
A property window opens with the General section selected.
- Click the Applications tab.
- Select the application for which you want to view the policy synchronization date.
The application policy window opens with the General section selected and the policy delivery date and time displayed.
Viewing the policy distribution status chart
In Open Single Management Platform, you can view the status of policy application on each device in a policy distribution status chart.
To view the policy distribution status on each device:
- In the main menu, go to Assets (Devices) → Policies & profiles.
- Select check box next to the name of the policy for which you want to view the distribution status on devices.
- In the menu that appears, select the Distribution link.
The <Policy name> distribution results window opens.
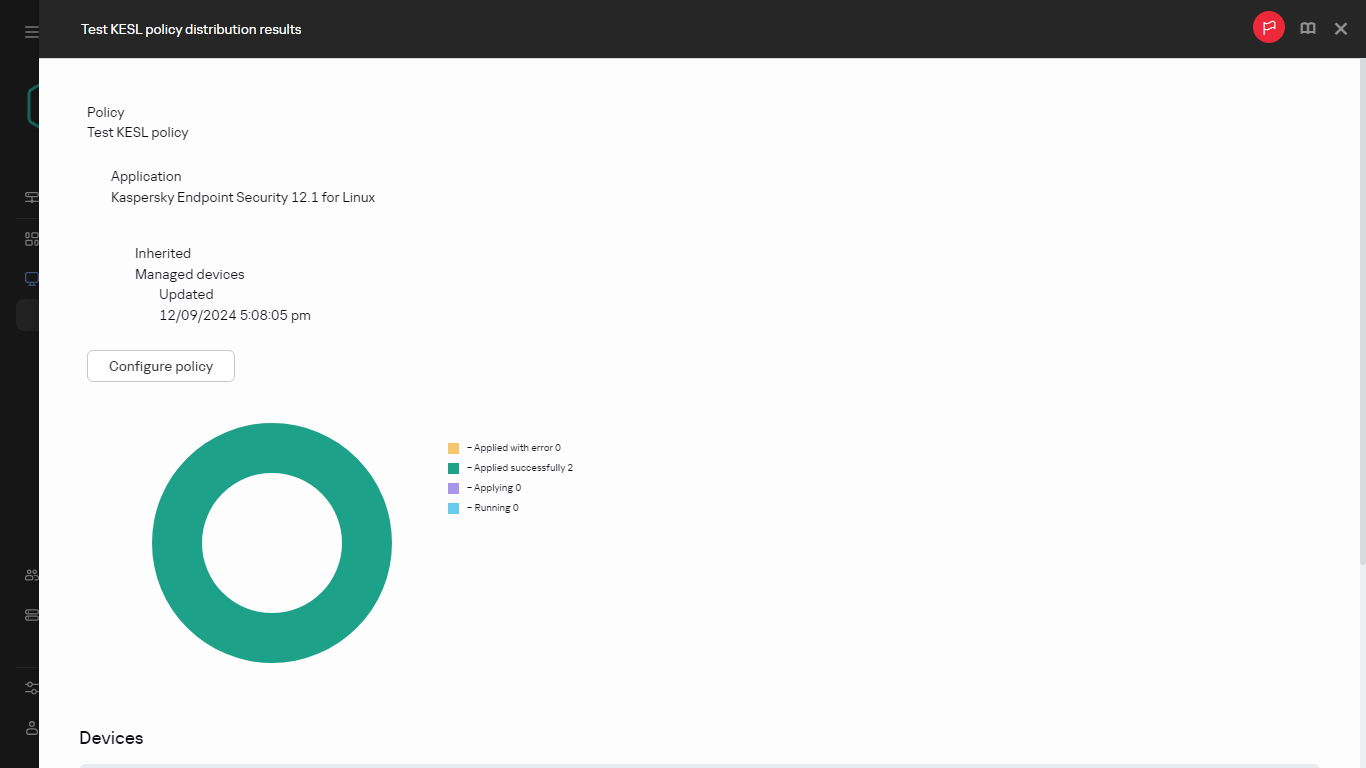
- In the <Policy name> distribution results window that opens, the Status description of the policy is displayed.
You can change number of results displayed in the list with policy distribution. The maximum number of devices is 100,000.
To change the number of devices displayed in the list with policy distribution results:
- In the main menu, go to your account settings, and then select Interface options.
- In the Limit of devices displayed in policy distribution results, enter the number of devices (up to 100,000).
By default, the number is 5000.
- Click Save.
The settings are saved and applied.
Deleting a policy
You can delete a policy if you do not need it anymore. You can delete only a policy that is not inherited in the specified administration group. If a policy is inherited, you can only delete it in the upper-level group for which it was created.
To delete a policy:
- In the main menu, go to Assets (Devices) → Policies & profiles.
- Select the check box next to the policy that you want to delete, and click Delete.
The Delete button becomes unavailable (dimmed) if you select an inherited policy.
- Click OK to confirm the operation.
The policy is deleted together with all its profiles.
Managing policy profiles
This section describes managing policy profiles and provides information about viewing the profiles of a policy, changing a policy profile priority, creating a policy profile, copying a policy profile, creating a policy profile activation rule, and deleting a policy profile.
Viewing the profiles of a policy
To view profiles of a policy:
- In the main menu, go to Assets (Devices) → Policies & profiles.
- Click the name of the policy whose profiles you want to view.
The policy properties window opens with the General tab selected.
- Open the Policy profiles tab.
The list of policy profiles appears in tabular format. If the policy does not have profiles, an empty table appears.
Changing a policy profile priority
To change a policy profile priority:
- Proceed to the list of profiles of a policy that you want.
The list of policy profiles appears.
- On the Policy profiles tab, select the check box next to the policy profile for which you want to change priority.
- Set a new position of the policy profile in the list by clicking Prioritize or Deprioritize.
The higher a policy profile is located in the list, the higher its priority.
- Click the Save button.
Priority of the selected policy profile is changed and applied.
Creating a policy profile
To create a policy profile:
- Proceed to the list of profiles of the policy that you want.
The list of policy profiles appears. If the policy does not have profiles, an empty table appears.
- Click Add.
- If you want, change the default name and default inheritance settings of the profile.
- Select the Application settings tab.
Alternatively, you can click Save and exit. The profile that you have created appears in the list of policy profiles, and you can edit its settings later.
- On the Application settings tab, in the left pane, select the category that you want and in the results pane on the right, edit the settings for the profile. You can edit policy profile settings in each category (section).
When editing the settings, you can click Cancel to cancel the last operation.
- Click Save to save the profile.
The profile will appear in the list of policy profiles.
Copying a policy profile
You can copy a policy profile to the current policy or to another, for example, if you want to have identical profiles for different policies. You can also use copying if you want to have two or more profiles that differ in only a small number of settings.
To copy a policy profile:
- Proceed to the list of profiles of a policy that you want.
The list of policy profiles appears. If the policy does not have profiles, an empty table appears.
- On the Policy profiles tab, select the policy profile that you want to copy.
- Click Copy.
- In the window that opens, select the policy to which you want to copy the profile.
You can copy a policy profile to the same policy or to a policy that you specify.
- Click Copy.
The policy profile is copied to the policy that you selected. The newly copied profile gets the lowest priority. If you copy the profile to the same policy, the name of the newly copied profile will be expanded with the () index, for example: (1), (2).
Later, you can change the settings of the profile, including its name and its priority; the original policy profile will not be changed in this case.
Creating a policy profile activation rule
To create a policy profile activation rule:
- Proceed to the list of profiles of a policy that you want.
The list of policy profiles appears.
- On the Policy profiles tab, click the policy profile for which you need to create an activation rule.
If the list of policy profiles is empty, you can create a policy profile.
- On the Activation rules tab, click the Add button.
The window with policy profile activation rules opens.
- Specify a name for the rule.
- Select the check boxes next to the conditions that must affect activation of the policy profile that you are creating:
- General rules for policy profile activation
For this option, specify at the next step:
- Rules for specific device owner
For this option, specify at the next step:
- Rules for hardware specifications
For this option, specify at the next step:
- Rules for role assignment
For this option, specify at the next step:
- Rules for tag usage
For this option, specify at the next step:
- Rules for Active Directory usage
For this option, specify at the next step:
The number of additional pages of the wizard depends on the settings that you select at the first step. You can modify policy profile activation rules later.
- General rules for policy profile activation
- Check the list of the configured parameters. If the list is correct, click Create.
The profile will be saved. The profile will be activated on the device when activation rules are triggered.
Policy profile activation rules created for the profile are displayed in the policy profile properties on the Activation rules tab. You can modify or remove any policy profile activation rule.
Multiple activation rules can be triggered simultaneously.
Page top
Deleting a policy profile
To delete a policy profile:
- Proceed to the list of profiles of a policy that you want.
The list of policy profiles appears.
- On the Policy profiles tab, select the check box next to the policy profile that you want to delete, and click Delete.
- In the window that opens, click Delete again.
The policy profile is deleted. If the policy is inherited by a lower-level group, the profile remains in that group, but becomes the policy profile of that group. This is done to eliminate significant change in settings of the managed applications installed on the devices of lower-level groups.
Network Agent policy settings
To configure the Network Agent policy:
- In the main menu, go to Assets (Devices) → Policies & profiles.
- Click the name of the Network Agent policy.
The properties window of the Network Agent policy opens. The properties window contains the tabs and settings described below.
See the comparison table detailing how the settings below apply, depending on the type of operating system used.
General
On this tab, you can modify the policy name, policy status, and specify the inheritance of policy settings:
- In the Name field, you can modify the policy name.
- In the Policy status block, you can select one of the following policy modes:
- In the Settings inheritance settings group, you can configure the policy inheritance:
Event configuration
On this tab, you can configure event logging and event notification. Events are distributed according to importance level in the following sections:
- Functional failure
- Warning
- Info
In each section, the list shows the types of events and the default event storage period on the Administration Server (in days). After you click the event type, you can specify the settings of event logging and notifications about events selected in the list. By default, common notification settings specified for the entire Administration Server are used for all event types. However, you can change specific settings for the required event types.
For example, in the Warning section, you can configure the Security issue has occurred event type. Such events may happen, for instance, when the free disk space of a distribution point is less than 2 GB (at least 4 GB are required to install applications and download updates remotely). To configure the Security issue has occurred event, click it and specify where to store the occurred events and how to notify about them.
If the Network Agent detects a security issue, you can manage this issue by using the settings of a managed device.
Application settings
Settings
In the Settings section, you can configure the Network Agent policy:
- Distribute files through distribution points only
- Maximum size of event queue, in MB
- Application is allowed to retrieve policy's extended data on device
- Protect the Network Agent service against unauthorized removal or termination, and prevent changes to the settings
- Use uninstallation password
Repositories
In the Repositories section, you can select the types of objects whose details will be sent from Network Agent to Administration Server:
- Details of installed applications
- Include information about patches
- Details of Windows Update updates
- Details of software vulnerabilities and corresponding updates
- Hardware registry details
If modification of some settings in this section is prohibited by the Network Agent policy, you cannot modify these settings.
Software updates and vulnerabilities
In the Software updates and vulnerabilities section, you can enable scanning of executable files for vulnerabilities:
Restart management
In the Restart management section, you can specify the action to be performed if the operating system of a managed device has to be restarted for correct use, installation, or uninstallation of an application:
- Do not restart the operating system
- Restart the operating system automatically, if necessary
- Prompt user for action
Manage patches and updates
In the Manage patches and updates section, you can configure the download and distribution of updates, as well as the installation of patches, on managed devices:
- Automatically install applicable updates and patches for components that have the Undefined status
- Download updates and anti-virus databases from Administration Server in advance (recommended)
Connectivity
The Connectivity section includes three subsections:
- Network
- Connection profiles
- Connection schedule
In the Network subsection, you can configure the connection to Administration Server, enable the use of a UDP port, and specify the UDP port number.
- In the Connect to Administration Server settings group, you can configure connection to the Administration Server and specify the time interval for synchronization between client devices and the Administration Server:
- Use UDP port
- UDP port number
- Use distribution point to force connection to Administration Server
In the Connection profiles subsection, you can specify the network location settings and enable out-of-office mode when Administration Server is not available:
- Network location settings
- Administration Server connection profiles
- Enable out-of-office mode when Administration Server is not available
In the Connection schedule subsection, you can specify the time intervals during which Network Agent sends data to the Administration Server:
Network polling by distribution points
In the Network polling by distribution points section, you can configure automatic polling of the network. You can use the following options to enable the polling and set its frequency:
Network settings for distribution points
In the Network settings for distribution points section, you can specify the internet access settings:
- Use proxy server
- Address
- Port number
- Bypass proxy server for local addresses
- Proxy server authentication
KSN Proxy (distribution points)
In the KSN Proxy (distribution points) section, you can configure the application to use the distribution point to forward Kaspersky Security Network (KSN) requests from the managed devices:
- Enable KSN Proxy on the distribution point side
- Forward KSN requests to Administration Server
- Access KSN Cloud/KPSN directly over the internet
- TCP port
- UDP port
- HTTPS through port
Updates (distribution points)
In the Updates (distribution points) section, you can enable the downloading diff files feature, so distribution points take updates in the form of diff files from Kaspersky update servers.
Local account management (Linux only)
The Local account management (Linux only) section includes three subsections:
- User certificates management
- Add or edit applicable local administrator groups
- Upload a reference file to protect the sudoers file on the user's device from changes
In the User certificates management subsection, you can specify which root certificates to install. These certificates can be used, for example, to verify the authenticity of websites or web servers.
In the Add or edit applicable local administrator groups subsection, you can manage local administrator groups. These groups are used, for example, when revoking local administrator rights. You can also check the list of privileged user accounts using the Report on privileged device users (Linux only).
In the Upload a reference file to protect the sudoers file on the user's device from changes subsection, you can configure control of the sudoers file. Privileged groups and device users are defined by the sudoers file on the device. The sudoers file is located at /etc/sudoers. You can upload a reference sudoers file to protect the sudoers file from changes. This will prevent unwanted changes to the sudoers file.
An invalid reference sudoers file may cause the user's device to malfunction.
Revision history
On the Revision history tab, you can:
- View and save the history of policy revisions.
- Roll back to a policy revision.
- Add and edit policy revision descriptions.
Usage of Network Agent for Windows, Linux, and macOS: Comparison
The Network Agent usage varies depending on the operating system of the device. The Network Agent policy and installation package settings also differ depending on the operating system. The table below compares Network Agent features and usage scenarios available for Windows, Linux, and macOS operating systems.
Network Agent feature comparison
Network Agent feature |
Windows |
Linux |
macOS |
|---|---|---|---|
Installation |
|||
Installing by cloning an image of the administrator's hard drive with the operating system and Network Agent using third-party tools |
|
|
|
Installing with third-party tools for remote installation of applications |
|
|
|
Installing manually, by running application installers on devices |
|
|
|
Installing Network Agent in silent mode |
|
|
|
Manually connecting a client device to the Administration Server. klmover utility |
|
|
|
Automatic installing of updates and patches for Open Single Management Platform components |
|
|
|
Automatic distributing of a key |
|
|
|
Forced synchronization |
|
|
|
Distribution point |
|||
Using as distribution point |
|
|
|
|
Without using Network Location Awareness (NLA). |
Without using Network Location Awareness (NLA). |
|
Offline model of update download |
|
|
|
Network polling |
|
|
|
Running KSN proxy service on a distribution point side |
|
|
|
Downloading updates via Kaspersky update servers to the distribution points repositories that distribute updates to managed devices |
|
|
(If one or more devices running Linux or macOS are within the scope of the Download updates to the repositories of distribution points task, the task completes with the Failed status, even if it has successfully completed on all Windows devices.) |
Push installation of applications |
|
Restricted: it is not possible to perform push installation on Windows devices by using Linux distribution points. |
Restricted: it is not possible to perform push installation on Windows devices by using macOS distribution points. |
Using as a push server |
|
|
|
Handling third-party applications |
|||
Remote installing of applications on devices |
|
|
|
Configuring operating system updates in a Network Agent policy |
|
|
|
Viewing information about software vulnerabilities |
|
|
|
Scanning applications for vulnerabilities |
|
|
|
Software updates |
|
|
|
Inventory of software installed on devices |
|
|
|
Virtual machines |
|||
Installing Network Agent on a virtual machine |
|
|
|
Optimization settings for virtual desktop infrastructure (VDI) |
|
|
|
Support of dynamic virtual machines |
|
|
|
Other |
|||
Auditing actions on a remote client device by using Windows Desktop Sharing |
|
|
|
Monitoring the anti-virus protection status |
|
|
|
Managing device restarts |
|
|
|
Support of file system rollback |
|
|
|
Using a Network Agent as connection gateway |
|
|
|
Connection Manager |
|
|
|
Network Agent switching from one Administration Server to another (automatically by network location) |
|
|
|
Checking the connection between a client device and the Administration Server. klnagchk utility |
|
|
|
Remotely connecting to the desktop of a client device |
|
|
By using the Virtual Network Computing (VNC) system. |
Downloading a stand-alone installation package through the Migration wizard |
|
|
|
Viewing information about the hardware of client devices |
|
Information about the hardware of Linux devices sent to the Administration Server by Network Agent installed on these devices is limited to the information specified in the description of the managed device settings. |
Information about the hardware of macOS devices sent to the Administration Server by Network Agent installed on these devices is limited to the information specified in the description of the managed device settings. |
Comparison of Network Agent settings by operating systems
The table below shows which Network Agent policy settings are available depending on the operating system of the managed device where Network Agent was installed.
Network Agent settings: comparison by operating systems
Settings section |
Windows |
Linux |
macOS |
|---|---|---|---|
General |
|
|
|
Event configuration |
|
|
|
Settings |
|
The following options are available:
|
|
Repositories |
|
The following options are available:
|
The Hardware registry details option is available. |
Connectivity → Network |
|
Except the Open Network Agent ports in Microsoft Windows Firewall option. |
|
Connectivity → Connection profiles |
|
|
|
Connectivity → Connection schedule |
|
|
|
Network polling by distribution points |
The following options are available:
|
The following options are available:
|
|
Network settings for distribution points |
|
|
|
KSN Proxy (distribution points) |
|
|
|
Updates (distribution points) |
|
|
|
Revision history |
|
|
|
Manual setup of the Kaspersky Endpoint Security policy
This section provides recommendations on how to configure the Kaspersky Endpoint Security policy. You can perform setup in the policy properties window. When you edit a setting, click the lock icon to the right of the relevant group of settings to apply the specified values to a workstation.
Configuring Kaspersky Security Network
Kaspersky Security Network (KSN) is the infrastructure of cloud services that contains information about the reputation of files, web resources, and software. Kaspersky Security Network enables Kaspersky Endpoint Security for Windows to respond faster to different kinds of threats, enhances the performance of the protection components, and decreases the likelihood of false positives. For more information about Kaspersky Security Network, see the Kaspersky Endpoint Security for Windows Help.
To specify recommended KSN settings:
- In the main menu, go to Assets (Devices) → Policies & profiles.
- Click the policy of Kaspersky Endpoint Security for Windows.
The properties window of the selected policy opens.
- In the policy properties, go to Application settings → Advanced Threat Protection → Kaspersky Security Network.
- Make sure that the Kaspersky Security Network option is enabled. Using this option helps to redistribute and optimize traffic on the network.
If you use Managed Detection and Response, you must enable Kaspersky Security Network option for the distribution point and enable extended KSN mode.
- Enable use of KSN servers if the KSN proxy service is not available. KSN servers may be located either on the side of Kaspersky (when KSN is used) or on the side of third parties (when KPSN is used).
- Click OK.
The recommended KSN settings are specified.
Checking the list of the networks protected by Firewall
Make sure that Kaspersky Endpoint Security for Windows Firewall protects all your networks. By default, Firewall protects networks with the following types of connection:
- Public network. Security applications, firewalls, or filters do not protect devices in such a network.
- Local network. Access to files and printers is restricted for devices in this network.
- Trusted network. Devices in such a network are protected from attacks and unauthorized access to files and data.
If you configured a custom network, make sure that Firewall protects it. For this purpose, check the list of the networks in the Kaspersky Endpoint Security for Windows policy properties. The list may not contain all the networks.
For more information about Firewall, see the Kaspersky Endpoint Security for Windows Help.
To check the list of networks:
- In the main menu, go to Assets (Devices) → Policies & profiles.
- Click the policy of Kaspersky Endpoint Security for Windows.
The properties window of the selected policy opens.
- In the policy properties, go to Application settings → Essential Threat Protection → Firewall.
- Under Available networks, click the Network settings link.
TheNetwork connections window opens. This window displays the list of networks.
- If the list has a missing network, add it.
Disabling the scan of network drives
When Kaspersky Endpoint Security for Windows scans network drives, this can place a significant load on them. It is more convenient to perform indirect scanning on file servers.
You can disable scanning of network drives in the Kaspersky Endpoint Security for Windows policy properties. For a description of these policy properties, see the Kaspersky Endpoint Security for Windows Help.
To disable scanning of network drives:
- In the main menu, go to Assets (Devices) → Policies & profiles.
- Click the policy of Kaspersky Endpoint Security for Windows.
The properties window of the selected policy opens.
- In the policy properties, go to Application settings → Essential Threat Protection → File Threat Protection.
- Under Protection scope, disable the All network drives option.
- Click OK.
Scanning of network drives is disabled.
Excluding software details from the Administration Server memory
We recommend that Administration Server does not save information about software modules that are started on the network devices. As a result, the Administration Server memory does not overrun.
You can disable saving this information in the Kaspersky Endpoint Security for Windows policy properties.
To disable saving information about installed software modules:
- In the main menu, go to Assets (Devices) → Policies & profiles.
- Click the policy of Kaspersky Endpoint Security for Windows.
The properties window of the selected policy opens.
- In the policy properties, go to Application settings → General Settings → Reports and Storage.
- Under Data transfer to Administration Server, disable the About started applications check box if it is still enabled in the top-level policy.
When this check box is selected, the Administration Server database saves information about all versions of all software modules on the networked devices. This information may require a significant amount of disk space in the Open Single Management Platform database (dozens of gigabytes).
The information about installed software modules is no longer saved to the Administration Server database.
Configuring access to the Kaspersky Endpoint Security for Windows interface on workstations
If the threat protection on the organization's network must be managed in centralized mode through Open Single Management Platform, specify the interface settings in the Kaspersky Endpoint Security for Windows policy properties, as described below. As a result, you will prevent unauthorized access to Kaspersky Endpoint Security for Windows on workstations and the changing of Kaspersky Endpoint Security for Windows settings.
For a description of these policy properties, see the Kaspersky Endpoint Security for Windows Help.
To specify recommended interface settings:
- In the main menu, go to Assets (Devices) → Policies & profiles.
- Click the policy of Kaspersky Endpoint Security for Windows.
The properties window of the selected policy opens.
- In the policy properties, go to Application settings → General settings → Interface.
- Under Interaction with user, select the Do not display user interface option. This disables the display of the Kaspersky Endpoint Security for Windows user interface on workstations, so their users cannot change the settings of Kaspersky Endpoint Security for Windows.
- Under Password protection, enable the toggle switch. This reduces the risk of unauthorized or unintended changes in the settings of Kaspersky Endpoint Security for Windows on workstations.
The recommended settings for the interface of Kaspersky Endpoint Security for Windows are specified.
Saving important policy events in the Administration Server database
To avoid the Administration Server database overflow, we recommend that you save only important events to the database.
To configure registration of important events in the Administration Server database:
- In the main menu, go to Assets (Devices) → Policies & profiles.
- Click the policy of Kaspersky Endpoint Security for Windows.
The properties window of the selected policy opens.
- In the policy properties, open the Event configuration tab.
- In the Critical section, click Add event and select check boxes next to the following events only:
- End User License Agreement violated
- Application autorun is disabled
- Activation error
- Active threat detected. Advanced Disinfection should be started
- Disinfection impossible
- Previously opened dangerous link detected
- Process terminated
- Network activity blocked
- Network attack detected
- Application startup prohibited
- Access denied (local bases)
- Access denied (KSN)
- Local update error
- Cannot start two tasks at the same time
- Error in interaction with Kaspersky Security Center
- Not all components were updated
- Error applying file encryption / decryption rules
- Error enabling portable mode
- Error disabling portable mode
- Could not load encryption module
- Policy cannot be applied
- Error changing application components
- Click OK.
- In the Functional failure section, click Add event and select check box next to the event Invalid task settings. Settings not applied.
- Click OK.
- In the Warning section, click Add event and select check boxes next to the following events only:
- Self-Defense is disabled
- Protection components are disabled
- Incorrect reserve key
- Legitimate software that can be used by intruders to damage your computer or personal data was detected (local bases)
- Legitimate software that can be used by intruders to damage your computer or personal data was detected (KSN)
- Object deleted
- Object disinfected
- User has opted out of the encryption policy
- File was restored from quarantine on the Kaspersky Anti Targeted Attack Platform server by the administrator
- File was quarantined on the Kaspersky Anti Targeted Attack Platform server by the administrator
- Application startup blockage message to administrator
- Device access blockage message to administrator
- Web page access blockage message to administrator
- Click OK.
- In the Info section, click Add event and select check boxes next to the following events only:
- A backup copy of the object was created
- Application startup prohibited in test mode
- Click OK.
Registration of important events in the Administration Server database is configured.
Manual setup of the group update task for Kaspersky Endpoint Security
The optimal and recommended schedule option for Kaspersky Endpoint Security is When new updates are downloaded to the repository when the Use automatically randomized delay for task starts check box is selected.
Kaspersky Security Network (KSN)
This section describes how to use an online service infrastructure named Kaspersky Security Network (KSN). The section provides the details on KSN, as well as instructions on how to enable KSN, configure access to KSN, and view the statistics of the use of KSN proxy server.
Updates functionality (including providing anti-virus signature updates and codebase updates), as well as KSN functionality may not be available in the software in the U.S.
About KSN
Kaspersky Security Network (KSN) is an online service infrastructure that provides access to the online Knowledge Base of Kaspersky, which contains information about the reputation of files, web resources, and software. The use of data from Kaspersky Security Network ensures faster responses by Kaspersky applications to threats, improves the effectiveness of some protection components, and reduces the risk of false positives. KSN allows you to use Kaspersky reputation databases to retrieve information about applications installed on managed devices.
By participating in KSN, you agree to send to Kaspersky in automatic mode information about the operation of Kaspersky applications installed on client devices that are managed through Open Single Management Platform. Information is transferred in accordance with the current KSN access settings.
Open Single Management Platform supports the following KSN infrastructure solutions:
- Global KSN is a solution that allows you to exchange information with Kaspersky Security Network. If you participate in KSN, you agree to send to Kaspersky, in automatic mode, information about the operation of Kaspersky applications installed on client devices that are managed through Open Single Management Platform. Information is transferred in accordance with the current KSN access settings. Kaspersky analysts additionally analyze received information and include it in the reputation and statistical databases of Kaspersky Security Network. Open Single Management Platform uses this solution by default.
- Kaspersky Private Security Network (KPSN) is a solution that allows users of devices with Kaspersky applications installed to obtain access to reputation databases of Kaspersky Security Network, and other statistical data, without sending data to KSN from their own computers. KPSN is designed for corporate customers who are unable to participate in Kaspersky Security Network for any of the following reasons:
- User devices are not connected to the internet.
- Transmission of any data outside the country or outside the corporate LAN is prohibited by law or restricted by corporate security policies.
You can set up access settings of Kaspersky Private Security Network in the KSN Proxy settings section of the Administration Server properties window.
You can start or stop using KSN at any moment.
You use KSN in accordance with the KSN Statement that you read and accept when you enable KSN. If the KSN Statement is updated, it is displayed to you when you update or upgrade Administration Server. You can accept the updated KSN Statement or decline it. If you decline it, you keep using KSN in accordance with the previous version of KSN Statement that you accepted before.
When KSN is enabled, Open Single Management Platform checks if the KSN servers are accessible. If access to the servers using system DNS is not possible, the application uses public DNS servers. This is necessary to make sure the level of security is maintained for the managed devices.
Client devices managed by the Administration Server interact with KSN through KSN proxy server. KSN proxy server provides the following features:
- Client devices can send requests to KSN and transfer information to KSN even if they do not have direct access to the internet.
- The KSN proxy server caches processed data, thus reducing the load on the outbound channel and the time period spent for waiting for information requested by a client device.
You can configure the KSN proxy server in the KSN Proxy settings section of the Administration Server properties window.
Page top
Setting up access to KSN
You can set up access to Kaspersky Security Network (KSN) on the Administration Server and on a distribution point.
To set up Administration Server access to KSN:
- In the main menu, click the settings icon () next to the name of the required Administration Server.
The Administration Server properties window opens.
- On the General tab, select the KSN Proxy settings section.
- Switch the toggle button to the Enable KSN Proxy on Administration Server Enabled position.
Data is sent from client devices to KSN in accordance with the Kaspersky Endpoint Security policy, which is active on those client devices. If this check box is cleared, no data will be sent to KSN from the Administration Server and client devices through Open Single Management Platform. However, client devices can send data to KSN directly (bypassing Open Single Management Platform), in accordance with their respective settings. The Kaspersky Endpoint Security policy, which is active on client devices, determines which data will be sent directly (bypassing Open Single Management Platform) from those devices to KSN.
- Switch the toggle button to the Use Kaspersky Security Network Enabled position.
If this option is enabled, client devices send patch installation results to Kaspersky. When enabling this option, make sure to read and accept the terms of the KSN Statement.
If you are using
, switch the toggle button to the Use Kaspersky Private Security Network Enabled position and click the Select file with KSN Proxy settings button to download the settings of KPSN (files with the extensions pkcs7 and pem). After the settings are downloaded, the interface displays the provider's name and contacts, as well as the creation date of the file with the settings of KPSN.When you switch the toggle button to the Use Kaspersky Private Security Network Enabled position, a message appears with details about KPSN.
The following Kaspersky applications support KPSN:
- Open Single Management Platform
- Kaspersky Endpoint Security for Linux
- Kaspersky Endpoint Security for Windows
If you enable KPSN in Open Single Management Platform, these applications receive information about supporting KPSN. In the settings window of the application, in the Kaspersky Security Network subsection of the Advanced Threat Protection section, the information about selected KSN provider is displayed — KSN or KPSN.
Open Single Management Platform does not send any statistical data to Kaspersky Security Network if KPSN is configured in the KSN Proxy settings section of the Administration Server properties window.
- If you have the proxy server settings configured in the Administration Server properties, but your network architecture requires that you use KPSN directly, enable the Ignore proxy server settings when connecting to KPSN option. Otherwise, requests from the managed applications cannot reach KPSN.
- Under Connection settings, configure the Administration Server connection to the KSN proxy service:
- The TCP port 13111 is used for connecting to the KSN proxy server. For the root Administration Server, this port number cannot be changed.
- If you want the Administration Server to connect to the KSN proxy server through a UDP port, enable the Use UDP port option. By default, this option is disabled, and TCP port is used. If this option is enabled, the UDP port 15111 is used by default. For the root Administration Server, this port number cannot be changed.
- Switch the toggle button to the Connect secondary Administration Servers to KSN through the primary Administration Server Enabled position.
If this option is enabled, secondary Administration Servers use the primary Administration Server as the KSN proxy server. If this option is disabled, secondary Administration Servers connect to KSN on their own. In this case, managed devices use secondary Administration Servers as KSN proxy servers.
Secondary Administration Servers use the primary Administration Server as a proxy server if in the right pane of the KSN Proxy settings section, in the properties of secondary Administration Servers the toggle button is switched to the Enable KSN Proxy on Administration Server Enabled position.
- Click the Save button.
The KSN access settings will be saved.
You can also set up distribution point access to KSN, for example, if you want to reduce the load on the Administration Server. The distribution point that acts as a KSN proxy server sends KSN requests from managed devices to Kaspersky directly, without using the Administration Server.
To set up distribution point access to Kaspersky Security Network (KSN):
- Make sure that the distribution point is assigned manually.
- In the main menu, click the settings icon () next to the name of the required Administration Server.
The Administration Server properties window opens.
- On the General tab, select the Distribution points section.
- Click the name of the distribution point to open its properties window.
- In the distribution point properties window, in the KSN Proxy section, enable the Enable KSN Proxy on the distribution point side option, and then enable the Access KSN Cloud/KPSN directly over the internet option.
- Click OK.
The distribution point will act as a KSN proxy server.
Please note that the distribution point does not support managed device authentication by using the NTLM protocol.
Page top
Enabling and disabling the usage of KSN
To enable the usage of KSN:
- In the main menu, click the settings icon () next to the name of the required Administration Server.
The Administration Server properties window opens.
- On the General tab, select the KSN Proxy settings section.
- Switch the toggle button to the Enable KSN Proxy on Administration Server Enabled position.
The KSN proxy server is enabled and sends data to KSN to increase the efficiency of Kaspersky Security Center components and improve the performance of Kaspersky applications.
- Depending on the KSN infrastructure solution that you are using, enable the corresponding toggle buttons.
- If you are using Global KSN, switch the toggle button to the Use Kaspersky Security Network Enabled position.
Sending data to KSN is now available. When enabling this option, you have to read and accept the terms of the KSN Statement.
- If you are using KPSN, switch the toggle button to the Use Kaspersky Private Security Network Enabled position, and then click the Select file with KSN Proxy settings button to download the settings of KPSN (files with the extensions pkcs7 and pem). After the settings are downloaded, the interface displays the provider's name and contacts, as well as the creation date of the file with the settings of KPSN.
When you switch the toggle button to the Use Kaspersky Private Security Network Enabled position, a message appears with details about KPSN.
- If you are using Global KSN, switch the toggle button to the Use Kaspersky Security Network Enabled position.
- Click the Save button.
To disable the usage of KSN:
- In the main menu, click the settings icon () next to the name of the required Administration Server.
The Administration Server properties window opens.
- On the General tab, select the KSN Proxy settings section.
- Switch the toggle button to the Enable KSN Proxy on Administration Server Disabled position to disable the KSN proxy service.
- Click the Save button.
Viewing the accepted KSN Statement
When you enable Kaspersky Security Network (KSN), you must read and accept the KSN Statement. You can view the accepted KSN Statement at any time.
To view the accepted KSN Statement:
- In the main menu, click the settings icon () next to the name of the required Administration Server.
The Administration Server properties window opens.
- On the General tab, select the KSN Proxy settings section.
- Click the View Kaspersky Security Network Statement link.
In the window that opens, you can view the text of the accepted KSN Statement.
Page top
Accepting an updated KSN Statement
You use KSN in accordance with the KSN Statement that you read and accept when you enable KSN. If the KSN Statement is updated, it is displayed to you when you upgrade a version of Administration Server. You can accept the updated KSN Statement or decline it. If you decline it, you will continue using KSN in accordance with the version of the KSN Statement that you previously accepted.
After upgrading a version of Administration Server, the updated KSN Statement is displayed automatically. If you decline the updated KSN Statement, you can still view and accept it later.
To view and then accept or decline an updated KSN Statement:
- Click the View notifications link in the upper-right corner of the main application window.
The Notifications window opens.
- Click the View the updated KSN Statement link.
The Kaspersky Security Network Statement update window opens.
- Read the KSN Statement, and then make your decision by clicking one of the following buttons:
- I accept the updated KSN Statement
- Use KSN under the old Statement
Depending on your choice, KSN keeps working in accordance with the terms of the current or updated KSN Statement. You can view the text of the accepted KSN Statement in the properties of Administration Server at any time.
Page top
Checking whether the distribution point works as KSN proxy server
On a managed device assigned to work as a distribution point, you can enable Kaspersky Security Network (KSN) Proxy. A managed device works as the KSN proxy server when the ksnproxy service is running on the device. You can check, turn on, or turn off this service on the device locally.
You can assign a Windows-based or a Linux-based device as a distribution point. The method of distribution point checking depends on the operating system of this distribution point.
To check whether the Linux-based distribution point works as KSN proxy server:
- On the distribution point device, run the
ps auxcommand to display the list of running processes. - In the list of running processes, check whether the
/opt/kaspersky/klnagent64/sbin/ksnproxyprocess is running.
If /opt/kaspersky/klnagent64/sbin/ksnproxy process is running, then Network Agent on the device participates in Kaspersky Security Network and works as the KSN proxy server for the managed devices included in the scope of the distribution point.
To check whether the Windows-based distribution point works as KSN proxy server:
- On the distribution point device, in Windows, open Services (All Programs → Administrative Tools → Services).
- In the list of services, check whether the ksnproxy service is running.
If the ksnproxy service is running, then Network Agent on the device participates in Kaspersky Security Network and works as KSN proxy server for the managed devices included in the scope of the distribution point.
If you want, you may turn off the ksnproxy service. In this case, Network Agent on the distribution point stops participating in Kaspersky Security Network. This requires local administrator rights.
Page top
About tasks
Open Single Management Platform manages Kaspersky security applications installed on devices by creating and running tasks. Tasks are required for installing, launching, and stopping applications, scanning files, updating databases and software modules, and performing other actions on applications.
Tasks for a specific application can be created using OSMP Console only if the management plug-in for that application is installed on OSMP Console Server.
Tasks can be performed on the Administration Server and on devices.
The tasks that are performed on the Administration Server include the following:
- Automatic distribution of reports
- Downloading of updates to the repository
- Backup of Administration Server data
- Maintenance of the database
The following types of tasks are performed on devices:
- Local tasks—Tasks that are performed on a specific device
Local tasks can be modified either by the administrator, using OSMP Console, or by the user of a remote device (for example, through the security application interface). If a local task has been modified simultaneously by the administrator and the user of a managed device, the changes made by the administrator will take effect because they have a higher priority.
- Group tasks—Tasks that are performed on all devices of a specific group
Unless otherwise specified in the task properties, a group task also affects all subgroups of the selected group. A group task also affects (optionally) devices that have been connected to secondary and virtual Administration Servers deployed in the group or any of its subgroups.
- Global tasks—Tasks that are performed on a set of devices, regardless of whether they are included in any group.
For each application, you can create any number of group tasks, global tasks, or local tasks.
You can make changes to the settings of tasks, view the progress of tasks, and copy, export, import, and delete tasks.
A task is started on a device only if the application for which the task was created is running.
Execution results of tasks are saved in the operating system event log on each device, in the operating system event log on the Administration Server, and in the Administration Server database.
Do not include private data in task settings. For example, avoid specifying the domain administrator password.
Page top
About task scope
The scope of a task is the set of devices on which the task is performed. The types of scope are as follows:
- For a local task, the scope is the device itself.
- For an Administration Server task, the scope is the Administration Server.
- For a group task, the scope is the list of devices included in the group.
When creating a global task, you can use the following methods to specify its scope:
- Specifying certain devices manually.
You can use an IP address (or IP range) or DNS name as the device address.
- Importing a list of devices from a .txt file with the device addresses to be added (each address must be placed on an individual line).
If you import a list of devices from a file or create a list manually, and if devices are identified by their names, the list can only contain devices for which information has already been entered into the Administration Server database. Moreover, the information must have been entered when those devices were connected or during device discovery.
- Specifying a device selection.
Over time, the scope of a task changes as the set of devices included in the selection change. A selection of devices can be made on the basis of device attributes, including software installed on a device, and on the basis of tags assigned to devices. Device selection is the most flexible way to specify the scope of a task.
Tasks for device selections are always run on a schedule by the Administration Server. These tasks cannot be run on devices that lack connection to the Administration Server. Tasks whose scope is specified by using other methods are run directly on devices and therefore do not depend on the device connection to the Administration Server.
Tasks for device selections are not run on the local time of a device; instead, they are run on the local time of the Administration Server. Tasks whose scope is specified by using other methods are run on the local time of a device.
Creating a task
To create a task:
- In the main menu, go to Assets (Devices) → Tasks.
- Click Add.
The New task wizard starts. Follow its instructions.
- If you want to modify the default task settings, enable the Open task details when creation is complete option on the Finish task creation page. If you do not enable this option, the task is created with the default settings. You can modify the default settings later, at any time.
- Click the Finish button.
The task is created and displayed in the list of tasks.
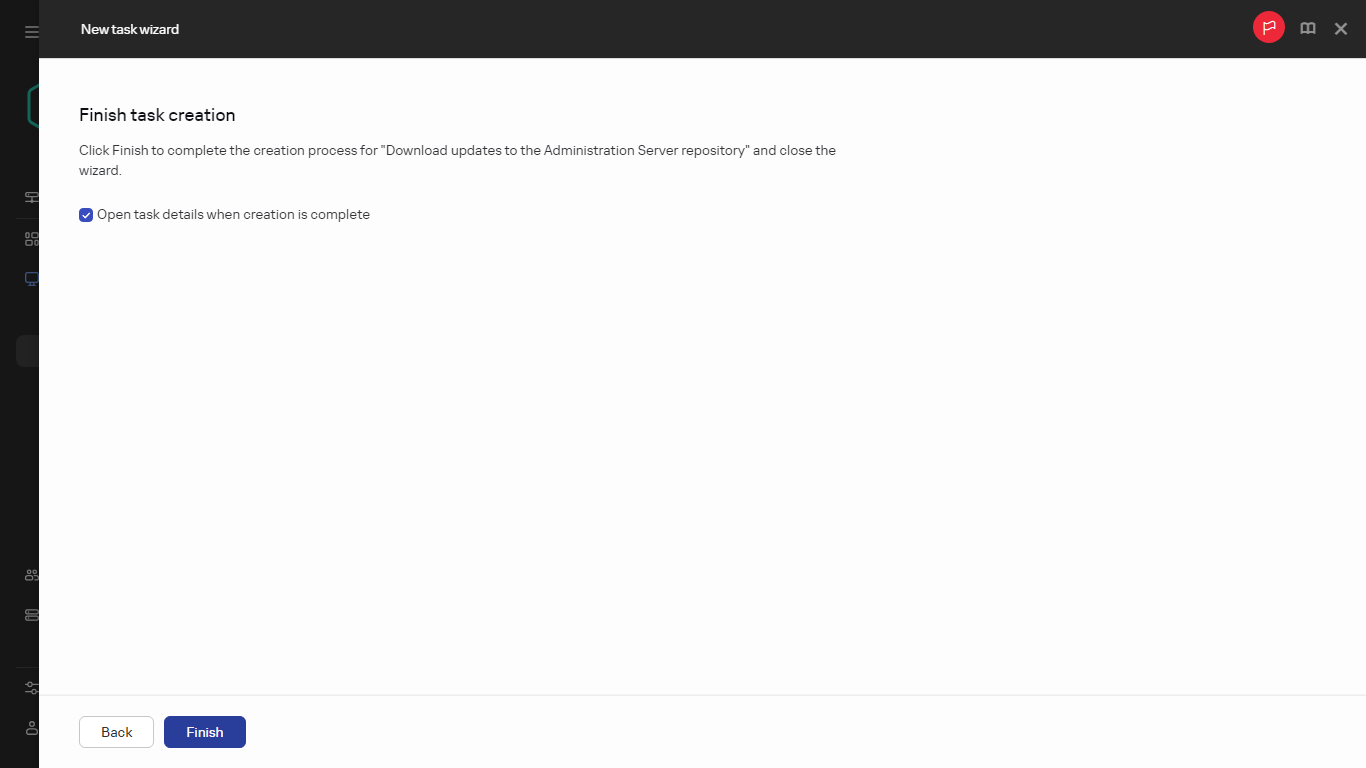
Finishing task creation
To create a new task assigned to the selected devices:
- In the main menu, go to Assets (Devices) → Managed devices.
The list of managed devices is displayed.
- In the list of managed devices, select check boxes next to the devices to run the task for them. You can use the search and filter functions to find the devices you're looking for.
- Click the Run task button, and then select Add a new task.
The New task wizard starts.
On the first step of the wizard, you can remove the devices selected to include in the task scope. Follow the wizard instructions.
- Click the Finish button.
The task is created for the selected devices.
Starting a task manually
The application starts tasks according to the schedule settings specified in the properties of each task. You can start a task manually at any time from the task list. Alternatively, you can select devices in the Managed devices list, and then start an existing task for them.
To start a task manually:
- In the main menu, go to Assets (Devices) → Tasks.
- In the task list, select the check box next to the task that you want to start.
- Click the Start button.
The task starts. You can check the task status in the Status column or by clicking the Result button.
Starting a task for selected devices
You can select one or more client devices in the list of devices, and then launch a previously created task for them. This allows you to run tasks created earlier for a specific set of devices.
This changes the devices to which the task was assigned to the list of devices that you select when you run the task.
To start a task for selected devices:
- In the main menu, go to Assets (Devices) → Managed devices. The list of managed devices is displayed.
- In the list of managed devices, use the check boxes to select the devices to run the task for them. You can use the search and filter functions to find the devices you're looking for.
- Click the Run task button, and then select Apply existing task.
The list of the existing tasks is displayed. - The selected devices are displayed above the task list. If necessary, you can remove a device from this list. You can delete all but one device.
- Select the desired task in the list. You can use the search box above the list to search for the desired task by name. Only one task can be selected.
- Click Save and start task.
The selected task is immediately started for the selected devices. The scheduled start settings in the task are not changed.
Page top
Viewing the task list
You can view the list of tasks that are created in Open Single Management Platform.
To view the list of tasks,
In the main menu, go to Assets (Devices) → Tasks.
The list of tasks is displayed. The tasks are grouped by the names of applications to which they are related. For example, the Install application remotely task is related to the Administration Server, and the Update task refers to Kaspersky Endpoint Security.
To view properties of a task,
Click the name of the task.
The task properties window is displayed with several named tabs. For example, the Task type is displayed on the General tab, and the task schedule—on the Schedule tab.
Page top
General task settings
This section contains the settings that you can view and configure for most of your tasks. The list of settings available depends on the task you are configuring.
Settings specified during task creation
You can specify the following settings when creating a task. Some of these settings can also be modified in the properties of the created task.
- Operating system restart settings:
- Task scheduling settings:
The types of schedule may vary depending on the task.
Some types of schedule may be unavailable for other Kaspersky applications.
- Devices to which the task will be assigned:
- Account settings:
Settings specified after task creation
You can specify the following settings only after a task is created.
- Group task settings:
- Advanced scheduling settings:
- Notification settings:
- Store task history block:
- Notify administrator of task execution results
- Notify of errors only
- Security settings.
- Task scope settings.
Depending on how the task scope is determined, the following settings are present:
- Revision history.
Exporting a task
Open Single Management Platform allows you to save a task and its settings to a KLT file. You can use this KLT file to import the saved task both to Kaspersky Security Center Windows and Kaspersky Security Center Linux.
To export a task:
- In the main menu, go to Assets (Devices) → Tasks.
- Select the check box next to the task that you want to export.
You cannot export multiple tasks at the same time. If you select more than one task, the Export button will be disabled. Administration Server tasks are also unavailable for export.
- Click the Export button.
- In the opened Save as window, specify the task file name and path. Click the Save button.
The Save as window is displayed only if you use Google Chrome, Microsoft Edge, or Opera. If you use another browser, the task file is automatically saved in the Downloads folder.
Importing a task
Open Single Management Platform allows you to import a task from a KLT file. The KLT file contains the exported task and its settings.
To import a task:
- In the main menu, go to Assets (Devices) → Tasks.
- Click the Import button.
- Click the Browse button to choose a task file that you want to import.
- In the opened window, specify the path to the KLT task file, and then click the Open button. Note that you can select only one task file.
The task processing starts.
- After the task is processed successfully, select the devices to which you want to assign the task. To do this, select one of the following options:
- Specify the task scope.
- Click the Complete button to finish the task import.
The notification with the import results appears. If the task is imported successfully, you can click the Details link to view the task properties.
After a successful import, the task is displayed in the task list. The task settings and schedule are also imported. The task will be started according to its schedule.
If the newly imported task has an identical name to an existing task, the name of the imported task is expanded with the (<next sequence number>) index, for example: (1), (2).
Page top
Starting the Change tasks password wizard
For a non-local task, you can specify an account under which the task must be run. You can specify the account during task creation or in the properties of an existing task. If the specified account is used in accordance with security instructions of the organization, these instructions might require changing the account password from time to time. When the account password expires and you set a new one, the tasks will not start until you specify the new valid password in the task properties.
The Change tasks password wizard enables you to automatically replace the old password with the new one in all tasks in which the account is specified. Alternatively, you can change this password manually in the properties of each task.
To start the Change tasks password wizard:
- In the main menu, go to Assets (Devices) → Tasks.
- Click Manage credentials of accounts for starting tasks.
Follow the instructions of the wizard.
Step 1. Specifying credentials
Specify new credentials that are currently valid in your system. When you switch to the next step of the wizard, Open Single Management Platform checks if the specified account name matches the account name in the properties of each non-local task. If the account names match, the password in the task properties will be automatically replaced with the new one.
To specify the new account, select an option:
If you fill in the Previous password (optional; if you want to replace it with the current one) field, Open Single Management Platform replaces the password only for those tasks in which both the account name and the old password are found. The replacement is performed automatically. In all other cases you have to choose an action to take in the next step of the wizard.
Step 2. Selecting an action to take
If you did not specify the previous password in the first step of the wizard or if the specified old password has not matched the passwords in the task properties, you must choose an action to take for the tasks found.
To choose an action for a task:
- Select the check box next to the task for which you want to choose an action.
- Perform one of the following:
- To remove the password in the task properties, click Delete credentials.
The task is switched to run under the default account.
- To replace the password with a new one, click Enforce the password change even if the old password is wrong or not provided.
- To cancel the password change, click No action is selected.
- To remove the password in the task properties, click Delete credentials.
The chosen actions are applied after you move to the next step of the wizard.
Step 3. Viewing the results
On the last step of the wizard, view the results for each of the found tasks. To complete the wizard, click the Finish button.
Viewing task run results stored on the Administration Server
Open Single Management Platform allows you to view the results for group tasks, tasks for specific devices, and Administration Server tasks.
To view the task results:
- In the task properties window, select the General section.
- Click the Results link to open the Task results window.
To view task results for a secondary Administration Server:
- In the task properties window, select the General section.
- Click the Results link to open the Task results window.
- Click Statistics from secondary Servers.
- Select the secondary Server for which you want to display the Task results window.
Manual setup of the group task for scanning a device with Kaspersky Endpoint Security
The quick start wizard creates a group task for scanning a device. If the automatically specified schedule of the group scanning task is not appropriate for your organization, you must manually set up the most convenient schedule for this task based on the workplace rules adopted in the organization.
For example, the task is assigned a Run on Fridays at 7:00 PM schedule with automatic randomization, and the Run missed tasks check box is cleared. This means that if the devices in the organization are shut down on Fridays, for example, at 6:30 PM, the device scan task will never run. In this case you need to set up the group scanning task manually.
General task settings
This section contains the settings that you can view and configure for most of your tasks. The list of settings available depends on the task you are configuring.
Settings specified during task creation
You can specify the following settings when creating a task. Some of these settings can also be modified in the properties of the created task.
- Operating system restart settings:
- Task scheduling settings:
The types of schedule may vary depending on the task.
Some types of schedule may be unavailable for other Kaspersky applications.
- Devices to which the task will be assigned:
- Account settings:
Settings specified after task creation
You can specify the following settings only after a task is created.
- Group task settings:
- Advanced scheduling settings:
- Notification settings:
- Store task history block:
- Notify administrator of task execution results
- Notify of errors only
- Security settings.
- Task scope settings.
Depending on how the task scope is determined, the following settings are present:
- Revision history.
Application tags
Open Single Management Platform enables you to tag the applications from applications registry. A tag is the label of an application that can be used for grouping or finding applications. A tag assigned to applications can serve as a condition in device selections.
For example, you can create the [Browsers] tag and assign it to all browsers such as Microsoft Internet Explorer, Google Chrome, Mozilla Firefox.
Creating an application tag
To create an application tag:
- In the main menu, go to Operations → Third-party applications → Application tags.
- Click Add.
A new tag window opens.
- Enter the tag name.
- Click OK to save the changes.
The new tag appears in the list of application tags.
Renaming an application tag
To rename an application tag:
- In the main menu, go to Operations → Third-party applications → Application tags.
- Select the check box next to the tag that you want to rename, and then click Edit.
A tag properties window opens.
- Change the tag name.
- Click OK to save the changes.
The updated tag appears in the list of application tags.
Assigning tags to an application
To assign one or several tags to an application:
- In the main menu, go to Operations → Third-party applications → Applications registry.
- Click the name of the application to which you want to assign tags.
- Select the Tags tab.
The tab displays all application tags that exist on the Administration Server. For tags assigned to the selected application, the check box in the Tag assigned column is selected.
- For tags that you want to assign, select check boxes in the Tag assigned column.
- Click Save to save the changes.
The tags are assigned to the application.
Removing assigned tags from an application
To remove one or several tags from an application:
- In the main menu, go to Operations → Third-party applications → Applications registry.
- Click the name of the application from which you want to remove tags.
- Select the Tags tab.
The tab displays all application tags that exist on the Administration Server. For tags assigned to the selected application, the check box in the Tag assigned column is selected.
- For tags that you want to remove, clear check boxes in the Tag assigned column.
- Click Save to save the changes.
The tags are removed from the application.
The removed application tags are not deleted. If you want, you can delete them manually.
Deleting an application tag
To delete an application tag:
- In the main menu, go to Operations → Third-party applications → Application tags.
- In the list, select the application tag that you want to delete.
- Click the Delete button.
- In the window that opens, click OK.
The application tag is deleted. The deleted tag is automatically removed from all of the applications to which it was assigned.
Granting offline access to the external device blocked by Device Control
In Device Control component of the Kaspersky Endpoint Security policy, you can manage user access to external devices that are installed on or connected to the client device (for example, hard drives, cameras, or Wi-Fi modules). This lets you protect the client device from infection when such external devices are connected, and prevent loss or leaks of data.
If you need to grant temporary access to the external device blocked by Device Control, but it is not possible to add the device to the list of trusted devices, you can grant temporary offline access to the external device. Offline access means that the client device has no access to the network.
You can grant offline access to the external device blocked by Device Control only if the Allow requests for temporary access option is enabled in the settings of the Kaspersky Endpoint Security policy, in the Application settings → Security Controls → Device Control section.
Granting offline access to the external device blocked by Device Control includes the following stages:
- In the Kaspersky Endpoint Security dialog window, device user who wants to have access to the blocked external device, generates a request access file and sends it to the Open Single Management Platform administrator.
- Getting this request, the Open Single Management Platform administrator creates an access key file and send it to the device user.
- In the Kaspersky Endpoint Security dialog window, the device user activates the access key file and obtains temporary access to the external device.
To grant temporary access to the external device blocked by Device Control:
- In the main menu, go to Assets (Devices) → Managed devices.
The list of managed devices is displayed.
- In this list, select the user's device that requests access to the external device blocked by Device Control.
You can select only one device.
- Above the list of managed devices, click the ellipsis button (), and then click the Grant access to the device in offline mode button.
- In the Application settings window that opens, in the Device Control section, click the Browse button.
- Select the request access file that you have received from the user, and then click the Open button. The file should have the AKEY format.
The details of the locked device to which the user has requested access is displayed.
- Specify the value of the Access duration setting.
This setting defines the length of time for which you grant the user access to the locked device. The default value is the value that was specified by the user when creating the request access file.
- Specify the time period during which the access key can be activated on the device.
This setting defines the time period during which the user can activate access to the blocked device by using the provided access key.
- Click the Save button.
- In the window that opens, select the destination folder in which you want to save the file containing the access key for the blocked device.
- Click the Save button.
As a result, when you send the user the access key file and the user activates it in the Kaspersky Endpoint Security dialog window, the user has temporary access to the blocked device for the specific period.
Registering Kaspersky Industrial CyberSecurity for Networks application in OSMP Console
To start working with the Kaspersky Industrial CyberSecurity for Networks application via OSMP Console, you must first register it in OSMP Console.
To register the Kaspersky Industrial CyberSecurity for Networks application:
- Make sure that the following is done:
- You have downloaded and installed the Kaspersky Industrial CyberSecurity for Networks web plug-in.
You can do it later while waiting for the Kaspersky Industrial CyberSecurity for Networks Server to synchronize with the Administration Server. After the plug-in is downloaded and installed, the KICS for Networks section is displayed in the OSMP Console main menu.
- In the Kaspersky Industrial CyberSecurity for Networks web interface, interaction with Open Single Management Platform is configured and enabled. For details, refer to the Kaspersky Industrial CyberSecurity for Networks Online Help.
- You have downloaded and installed the Kaspersky Industrial CyberSecurity for Networks web plug-in.
- Move the device where Kaspersky Industrial CyberSecurity for Networks Server is installed from the Unassigned devices group to the Managed devices group:
- In the main menu, go to Discovery & deployment → Unassigned devices.
- Select the check box next to the device where the Kaspersky Industrial CyberSecurity for Networks Server is installed.
- Click the Move to group button.
- In the hierarchy of administration groups, select the check box next to the Managed devices group.
- Click the Move button.
- Open the properties window of the device where the Kaspersky Industrial CyberSecurity for Networks Server is installed.
- On the device properties page, in the General section, select the Do not disconnect from the Administration Server option, and then click the Save button.
- On the device properties page, select the Applications section.
- In the Applications section, select Kaspersky Security Center Network Agent.
- If the current status of the application is Stopped, wait until it changes to Running.
This may take up to 15 minutes. If you have not yet installed the Kaspersky Industrial CyberSecurity for Networks web plug-in, you can do it now.
- If you want to view the statistics of Kaspersky Industrial CyberSecurity for Networks, you may add widgets on the dashboard. To add the widgets, do the following:
- In the main menu, go to Monitoring & Reporting → Dashboard.
- On the dashboard, click the Add or restore web widget button.
- In the widget menu that opens, select Other.
- Select the widgets that you want to add:
- KICS for Networks deployment map
- Information about KICS for Networks Servers
- Up-to-date events of KICS for Networks
- Devices with issues in KICS for Networks
- Critical events in KICS for Networks
- Statuses in KICS for Networks
- To proceed to the Kaspersky Industrial CyberSecurity for Networks web interface, do the following:
- In the main menu, go to KICS for Networks → Search.
- Click the Find events or devices button.
- In the Query parameters window that opens, click the Server field.
- Select the Kaspersky Industrial CyberSecurity for Networks Server from the drop-down list of servers that are integrated with Open Single Management Platform, and then click the Find button.
- Click the Go to Server link next to the name of the Kaspersky Industrial CyberSecurity for Networks Server.
The Kaspersky Industrial CyberSecurity for Networks sign-in page is displayed.
To log in to the Kaspersky Industrial CyberSecurity for Networks web interface, you need to provide the application user account credentials.
Managing users and user roles
This section describes users and user roles, and provides instructions for creating and modifying them, for assigning roles and groups to users, and for associating policy profiles with roles.
About user accounts
Open Single Management Platform allows you to manage user accounts and security groups. The application supports two types of accounts:
- Accounts of organization employees. Administration Server retrieves data of the accounts of those local users when polling the organization's network.
- Accounts of internal users of Open Single Management Platform. You can create accounts of internal users. These accounts are used only within Open Single Management Platform.
The kladmins group cannot be used to access OSMP Console in Open Single Management Platform. The kladmins group can only contain accounts that are used to start Open Single Management Platform services.
To view tables of user accounts and security groups:
- In the main menu, go to Users & roles → Users & groups.
- Select the Users or the Groups tab.
The table of users or security groups opens. If you want to view the table with only internal users or groups or with only local users or groups, set the Subtype filter criteria to Internal or Local respectively.
Page top
About user roles
A user role (also referred to as a role) is an object containing a set of rights and privileges. A role can be associated with settings of Kaspersky applications installed on a user device. You can assign a role to a set of users or to a set of security groups at any level in the hierarchy of administration groups, Administration Servers, or at the level of specific objects.
If you manage devices through a hierarchy of Administration Servers that includes virtual Administration Servers, note that you can create, modify, or delete user roles only from a physical Administration Server. Then, you can propagate the user roles to secondary Administration Servers, including virtual ones.
You can associate user roles with policy profiles. If a user is assigned a role, this user gets security settings necessary to perform job functions.
A user role can be associated with users of devices in a specific administration group.
User role scope
A user role scope is a combination of users and administration groups. Settings associated with a user role apply only to devices that belong to users who have this role, and only if these devices belong to groups associated with this role, including child groups.
Advantage of using roles
An advantage of using roles is that you do not have to specify security settings for each of the managed devices or for each of the users separately. The number of users and devices in a company may be quite large, but the number of different job functions that require different security settings is considerably smaller.
Differences from using policy profiles
Policy profiles are properties of a policy that is created for each Kaspersky application separately. A role is associated with many policy profiles created for different applications. Therefore, a role is a method of uniting settings for a certain user type in one place.
Configuring access rights to application features. Role-based access control
Open Single Management Platform provides facilities for role-based access to the features of Open Single Management Platform and managed Kaspersky applications.
You can configure access rights to application features for Open Single Management Platform users in one of the following ways:
- By configuring the rights for each user or group of users individually.
- By creating standard user roles with a predefined set of rights and assigning those roles to users depending on their scope of duties.
Application of user roles is intended to simplify and shorten routine procedures of configuring users' access rights to application features. Access rights within a role are configured in accordance with the standard tasks and the users' scope of duties.
User roles can be assigned names that correspond to their respective purposes. You can create an unlimited number of roles in the application.
You can use the predefined user roles with already configured set of rights, or create new roles and configure the required rights yourself.
Access rights to application features
The table below shows the Open Single Management Platform features with the access rights to manage the associated tasks, reports, settings, and perform the associated user actions.
To perform the user actions listed in the table, a user has to have the right specified next to the action.
Read, Write, and Execute rights are applicable to any task, report, or setting. In addition to these rights, a user has to have the Perform operations on device selections right to manage tasks, reports, or settings on device selections.
The General features: Access objects regardless of their ACLs functional area is intended for audit purposes. When users are granted Read rights in this functional area, they get full Read access to all objects and are able to execute any created tasks on selections of devices connected to the Administration Server via Network Agent with local administrator rights (root for Linux). We recommend granting these rights carefully and to a limited set of users who need them to perform their official duties.
All tasks, reports, settings, and installation packages that are missing in the table belong to the General features: Basic functionality functional area.
Access rights to application features
Functional area |
Right |
User action: right required to perform the action |
Task |
Report |
Other |
|---|---|---|---|---|---|
General features: Management of administration groups |
Write |
|
None |
None |
None |
General features: Access objects regardless of their ACLs |
Read |
Get read access to all objects: Read |
None |
None |
Access is granted regardless of other rights, even if they prohibit read access to specific objects. |
General features: Basic functionality |
|
|
|
|
None |
General features: Deleted objects |
|
|
None |
None |
None |
General features: Event processing |
|
|
None |
None |
Settings:
|
General features: Operations on Administration Server |
|
|
|
None |
None |
General features: Kaspersky software deployment |
|
Approve or decline installation of the patch: Manage Kaspersky patches |
None |
|
Installation package: "Kaspersky" |
General features: Key management |
|
|
None |
None |
None |
General features: Enforced report management |
|
|
None |
None |
None |
General features: Hierarchy of Administration Servers |
Configure hierarchy of Administration Servers |
|
None |
None |
None |
General features: User permissions |
Modify object ACLs |
|
None |
None |
None |
General features: Virtual Administration Servers |
|
|
None |
None |
None |
General features: Encryption Key Management |
Write |
Approval of the launch of the playbook in training mode the encryption keys: Write |
None |
None |
None |
Predefined user roles
User roles assigned to Open Single Management Platform users provide them with sets of access rights to application features.
You can use the predefined user roles with already configured set of rights, or create new roles and configure the required rights yourself. Some of the predefined user roles available in Open Single Management Platform can be associated with specific job positions, for example, Auditor, Security Officer, Supervisor. Access rights of these roles are pre-configured in accordance with the standard tasks and scope of duties of the associated positions. The table below shows how roles can be associated with specific job positions.
Examples of roles for specific job positions
Role |
Description |
Auditor |
Permits all operations with all types of reports, all viewing operations, including viewing deleted objects (grants the Read and Write permissions in the Deleted objects area). Does not permit other operations. You can assign this role to a person who performs the audit of your organization. |
Supervisor |
Permits all viewing operations; does not permit other operations. You can assign this role to a security officer and other managers in charge of the IT security in your organization. |
Security Officer |
Permits all viewing operations, permits reports management; grants limited permissions in the System management: Connectivity area. You can assign this role to an officer in charge of the IT security in your organization. |
The table below shows the access rights assigned to each predefined user role.
Features of the functional areas Mobile Device Management: General and System management are not available in Open Single Management Platform. A user with the roles Vulnerability and patch management administrator/operator or Mobile Device Management Administrator/Operator has access only for rights from the General features: Basic functionality area.
Access rights of predefined user roles
Role |
Description |
|---|---|
Basic roles |
|
Administration Server Administrator |
Permits all operations in the following functional areas:
Grants the Read and Write rights in the General features: Encryption key management functional area. |
Administration Server Operator |
Grants the Read and Execute rights in all of the following functional areas:
|
Auditor |
Permits all operations in the following functional areas, in General features:
You can assign this role to a person who performs the audit of your organization. |
Installation Administrator |
Permits all operations in the following functional areas, in General features:
Grants Read and Execute rights in the General features: Virtual Administration Servers functional area. |
Installation Operator |
Grants the Read and Execute rights in all of the following functional areas, in General features:
|
Kaspersky Endpoint Security Administrator |
Permits all operations in the following functional areas:
Grants the Read and Write rights in the General features: Encryption key management functional area. |
Kaspersky Endpoint Security Operator |
Grants the Read and Execute rights in all of the following functional areas:
|
Main Administrator |
Permits all operations in functional areas, except for the following areas, in General features:
Grants the Read and Write rights in the General features: Encryption key management functional area. |
Main Operator |
Grants the Read and Execute (where applicable) rights in all of the following functional areas:
|
Mobile Device Management Administrator |
Permits all operations in the General features: Basic functionality functional area.
|
Security Officer |
Permits all operations in the following functional areas, in General features:
Grants the Read, Write, Execute, Save files from devices to the administrator's workstation, and Perform operations on device selections rights in the System management: Connectivity functional area. You can assign this role to an officer in charge of the IT security in your organization. |
Self Service Portal User |
Permits all operations in the Mobile Device Management: Self Service Portal functional area. This feature is not supported in Kaspersky Security Center 11 and later version. |
Supervisor |
Grants the Read right in the General features: Access objects regardless of their ACLs and General features: Enforced report management functional areas. You can assign this role to a security officer and other managers in charge of the IT security in your organization. |
XDR roles |
|
Main administrator |
Permits all operations in the XDR functional areas:
|
Tenant administrator |
Permits all operations in the XDR functional areas:
This role corresponds to the Main Administrator role, but it has a restriction. In KUMA, a tenant administrator has limited access to the preset objects. |
SOC administrator |
Grants the following rights in the XDR functional areas:
|
Junior analyst |
Grants the following rights in the XDR functional areas:
|
Tier 2 analyst |
Grants the following rights in the XDR functional areas:
|
Tier 1 analyst |
Grants the following rights in the XDR functional areas:
This role corresponds to the Tier 2 analyst role, but it has a restriction. In KUMA, a Tier 1 analyst can only modify their own objects. |
SOC manager |
Grants the following rights in the XDR functional areas:
|
Approver |
Grants the following rights in the XDR functional areas:
|
Observer |
Grants the following rights in the XDR functional areas:
|
Interaction with NCIRCC |
Grants the following rights in the XDR functional areas:
You can work with XDR incidents, create NCIRCC incidents based on them, and export NCIRCC incidents (without access to critical information infrastructure). |
Service roles |
|
Automatic Threat Responder |
Grants service accounts the right to respond to threats. Access rights are configured automatically in accordance with the role-based access control policies of Kaspersky Security Center Linux and managed Kaspersky applications. You can assign this role only to service accounts. This role cannot be edited.
|
Assigning access rights to specific objects
In addition to assigning access rights at the server level, you can configure access to specific objects, for example, to a specific task. The application allows you to specify access rights to the following object types:
- Administration groups
- Tasks
- Reports
- Device selections
- Event selections
To assign access rights to a specific object:
- Depending on the object type, in the main menu, go to the corresponding section:
- Assets (Devices) → Hierarchy of groups
- Assets (Devices) → Tasks
- Monitoring & reporting → Reports
- Assets (Devices) → Device selections
- Monitoring & reporting → Event selections
- Open the properties of the object to which you want to configure access rights.
To open the properties window of an administration group or a task, click the object name. Properties of other objects can be opened by using the button on the toolbar.
- In the properties window, open the Access rights section.
The user list opens. The listed users and security groups have access rights to the object. By default, if you use a hierarchy of administration groups or Servers, the list and access rights are inherited from the parent administration group or primary Server.
- To be able to modify the list, enable the Use custom permissions option.
- Configure access rights:
- Use the Add and Delete buttons to modify the list.
- Specify access rights for a user or security group. Do one of the following:
- If you want to specify access rights manually, select the user or security group, click the Access rights button, and then specify the access rights.
- If you want to assign a user role to the user or security group, select the user or security group, click the Roles button, and then select the role to assign.
- Click the Save button.
The access rights to the object are configured.
Assigning permissions to users and groups
You can give users and security groups access rights to use different features of Administration Server and of the Kaspersky applications for which you have management plug-ins, for example, Kaspersky Endpoint Security for Windows.
To assign permissions to a user or security group:
- In the main menu, click the settings icon () next to the name of the required Administration Server.
The Administration Server properties window opens.
- On the Access rights tab, select the check box next to the name of the user or the security group to whom to assign rights, and then click the Access rights button.
You cannot select multiple users or security groups at the same time. If you select more than one item, the Access rights button will be disabled.
- Configure the set of rights for the user or group:
- Expand the node with features of Administration Server or other Kaspersky application.
- Select the Allow or Deny check box next to the feature or the access right that you want.
Example 1: Select the Allow check box next to the Application integration node to grant all available access rights to the Application integration feature (Read, Write, and Execute) for a user or group.
Example 2: Expand the Encryption key management node, and then select the Allow check box next to the Write permission to grant the Write access right to the Encryption key management feature for a user or group.
- After you configure the set of access rights, click OK.
The set of rights for the user or group of users will be configured.
The permissions of the Administration Server (or the administration group) are divided into the following areas:
- General features:
- Management of administration groups
- Access objects regardless of their ACLs
- Basic functionality
- Deleted objects
- Encryption Key Management
- Event processing
- Operations on Administration Server
- Device tags
- Kaspersky software deployment
- License key management
- Enforced report management
- Hierarchy of Servers
- User rights
- Virtual Administration Servers
- Mobile Device Management:
- General
- System Management:
- Connectivity
- Hardware inventory
- Network Access Control
- Deploy operating system
- Manage vulnerabilities and patches
- Remote installation
- Software inventory
If neither Allow nor Deny is selected for a permission, then the permission is considered undefined: it is denied until it is explicitly denied or allowed for the user.
The rights of a user are the sum of the following:
- User's own rights
- Rights of all the roles assigned to this user
- Rights of all the security group to which the user belongs
- Rights of all the roles assigned to the security groups to which the user belongs
If at least one of these sets of rights has Deny for a permission, then the user is denied this permission, even if other sets allow it or leave it undefined.
You can also add users and security groups to the scope of a user role to use different features of Administration Server. Settings associated with a user role will only apply to devices that belong to users who have this role, and only if these devices belong to groups associated with this role, including child groups.
Page top
Adding an account of an internal user
To add a new internal user account to Open Single Management Platform:
- In the main menu, go to Users & roles → Users & groups, and then select the Users tab.
- Click Add.
- In the Add user window that opens, specify the settings of the new user account:
- Name.
- Password for the user connection to Open Single Management Platform.
The password must comply with the following rules:
- The password must be 8 to 256 characters long.
- The password must contain characters from at least three of the groups listed below:
- Uppercase letters (A-Z)
- Lowercase letters (a-z)
- Numbers (0-9)
- Special characters (@ # $ % ^ & * - _ ! + = [ ] { } | : ' , . ? / \ ` ~ " ( ) ;)
- The password must not contain any whitespaces, Unicode characters, or the combination of "." and "@", when "." is placed before "@".
To see the characters that you entered, click and hold the Show button.
The number of attempts for entering the password is limited. By default, the maximum number of allowed password entry attempts is 10. You can change the allowed number of attempts to enter a password, as described in "Changing the number of allowed password entry attempts".
If the user enters an invalid password the specified number of times, the user account is blocked for one hour. You can unblock the user account only by changing the password.
- Click Save to save the changes.
A new user account is added to the user list.
Creating a security group
To create a security group:
- In the main menu, go to Users & roles → Users & groups, and then select the Groups tab.
- Click Add.
- In the Create security group window that opens, specify the following settings for the new security group:
- Group name
- Description
- Click Save to save the changes.
A new security group is added to the group list.
Editing an account of an internal user
To edit an internal user account in Open Single Management Platform:
- In the main menu, go to Users & roles → Users & groups, and then select the Users tab.
- Click the name of the user account that you want to edit.
- In the user settings window that opens, on the General tab, change the settings of the user account:
- Description
- Full name
- Email address
- Main phone
- Set new password for the user connection to Open Single Management Platform.
The password must comply with the following rules:
- The password must be 8 to 256 characters long.
- The password must contain characters from at least three of the groups listed below:
- Uppercase letters (A-Z)
- Lowercase letters (a-z)
- Numbers (0-9)
- Special characters (@ # $ % ^ & * - _ ! + = [ ] { } | : ' , . ? / \ ` ~ " ( ) ;)
- The password must not contain any whitespaces, Unicode characters, or the combination of "." and "@", when "." is placed before "@".
To see the entered password, click and hold the Show button.
The number of attempts for entering the password is limited. By default, the maximum number of allowed password entry attempts is 10. You can change the allowed number of attempts; however, for security reasons, we do not recommend that you decrease this number. If the user enters an invalid password the specified number of times, the user account is blocked for one hour. You can unblock the user account only by changing the password.
- If necessary, switch the toggle button to Disabled to prohibit the user from connecting to the application. You can disable an account, for example, after an employee leaves the company.
- On the Authentication security tab, you can specify the security settings for this account.
- On the Groups tab, you can add the user to security groups.
- On the Devices tab, you can assign devices to the user.
- On the Roles tab, you can assign roles to the user.
- Click Save to save the changes.
The updated user account appears in the list of users.
Editing a security group
To edit a security group:
- In the main menu, go to Users & roles → Users & groups, and then select the Groups tab.
- Click the name of the security group that you want to edit.
- In the group settings window that opens, change the settings of the security group:
- On the General tab, you can change the Name and Description settings. These settings are available only for internal security groups.
- On the Users tab, you can add users to the security group. This setting is available only for internal users and internal security groups.
- On the Roles tab, you can assign a role to the security group.
- Click Save to save the changes.
The changes are applied to the security group.
Assigning a role to a user or a security group
To assign a role to a user or a security group:
- In the main menu, go to Users & roles → Users & groups, and then select the Users or the Groups tab.
- Select the name of the user or the security group to whom to assign a role.
You can select multiple names.
- On the menu line, click the Assign role button.
The Role assignment wizard starts.
- Follow the instructions of the wizard: select the role that you want to assign to the selected users or security groups, and then select the scope of role.
A user role scope is a combination of users and administration groups. Settings associated with a user role apply only to devices that belong to users who have this role, and only if these devices belong to groups associated with this role, including child groups.
The role with a set of rights for working with Administration Server is assigned to the user (or users, or the security group). In the list of users or security groups, a check box appears in the Has assigned roles column.
Page top
Adding user accounts to an internal security group
You can add only accounts of internal users to an internal security group.
To add user accounts to an internal security group:
- In the main menu, go to Users & roles → Users & groups, and then select the Users tab.
- Select check boxes next to user accounts that you want to add to a security group.
- Click the Assign group button.
- In the Assign group window that opens, select the security group to which you want to add user accounts.
- Click the Save button.
The user accounts are added to the security group. You can also add internal users to a security group by using the group settings.
Assigning a user as a device owner
For information about assigning a user as a mobile device owner, see Kaspersky Security for Mobile Help.
To assign a user as a device owner:
- If you want to assign an owner of a device connected to a virtual Administration Server, first switch to the virtual Administration Server:
- In the main menu, click the chevron icon () to the right of the current Administration Server name.
- Select the required Administration Server.
- In the main menu, click the chevron icon (
- In the main menu, go to Users & roles → Users & groups, and then select the Users tab.
A user list opens. If you are currently connected to a virtual Administration Server, the list includes users from the current virtual Administration Server and the primary Administration Server.
- Click the name of the user account that you want to assign as a device owner.
- In the user settings window that opens, select the Devices tab.
- Click Add.
- From the device list, select the device that you want to assign to the user.
- Click OK.
The selected device is added to the list of devices assigned to the user.
You can perform the same operation at Assets (Devices) → Managed devices, by clicking the name of the device that you want to assign, and then clicking the Manage device owner link.
Two-step verification
This section describes how you can use two-step verification to reduce the risk of unauthorized access to OSMP Console.
Scenario: Configuring two-step verification for all users
This scenario describes how to enable two-step verification for all users and how to exclude user accounts from two-step verification. If you did not enable two-step verification for your account before you enable it for other users, the application opens the window for enabling two-step verification for your account, first. This scenario also describes how to enable two-step verification for your own account.
If you enabled two-step verification for your account, you may proceed to the stage of enabling of two-step verification for all users.
Prerequisites
Before you start:
- Make sure that your user account has the Modify object ACLs right of the General features: User permissions functional area for modifying security settings for other users' accounts.
- Make sure that the other users of Administration Server install an authenticator app on their devices.
Stages
Enabling two-step verification for all users proceeds in stages:
- Installing an authenticator app on a device
You can install any application that supports the Time-based One-time Password algorithm (TOTP), such as:
- Google Authenticator
- Microsoft Authenticator
- Bitrix24 OTP
- Yandex Key
- Avanpost Authenticator
- Aladdin 2FA
To check if Open Single Management Platform supports the authenticator app that you want to use, enable two-step verification for all users or for a particular user.
One of the steps suggests that you specify the security code generated by the authenticator app. If it succeeds, then Open Single Management Platform supports the selected authenticator.
We strongly do not recommend installing the authenticator app on the same device from which the connection to Administration Server is established.
- Synchronizing the authenticator app time with the time of the device on which Administration Server is installed
Ensure that the time on the device with the authenticator app and the time on the device with the Administration Server are synchronized to UTC, by using external time sources. Otherwise, failures may occur during the authentication and activation of two-step verification.
- Enabling two-step verification for your account and receiving the secret key for your account
After you enable two-step verification for your account, you can enable two-step verification for all users.
- Enabling two-step verification for all users
Users with two-step verification enabled must use it to log in to Administration Server.
- Prohibit new users from setting up two-step verification for themselves
In order to further improve OSMP Console access security, you can prohibit new users from setting up two-step verification for themselves.
- Editing the name of a security code issuer
If you have several Administration Servers with similar names, you may have to change the security code issuer names for better recognition of different Administration Servers.
- Excluding user accounts for which you do not need to enable two-step verification
If required, you can exclude users from two-step verification. Users with excluded accounts do not have to use two-step verification to log in to Administration Server.
- Configuring two-step verification for your own account
If the users are not excluded from two-step verification and two-step verification is not yet configured for their accounts, they need to configure it in the window that opens when they sign in to OSMP Console. Otherwise, they will not be able to access the Administration Server in accordance with their rights.
Results
Upon completion of this scenario:
- Two-step verification is enabled for your account.
- Two-step verification is enabled for all user accounts of the Administration Server, except for user accounts that were excluded.
About two-step verification for an account
Open Single Management Platform provides two-step verification for users of OSMP Console. When two-step verification is enabled for your own account, every time you log in to OSMP Console, you enter your user name, password, and an additional single-use security code. To receive a single-use security code, you must have an authenticator app on the computer or mobile device.
A security code has an identifier referred to as issuer name. The security code issuer name is used as an identifier of the Administration Server in the authenticator app. You can change the name of the security code issuer name. The security code issuer name has a default value that is the same as the name of the Administration Server. The issuer name is used as an identifier of the Administration Server in the authenticator app. If you change the security code issuer name, you must issue a new secret key and pass it to the authenticator app. A security code is single-use and valid for up to 90 seconds (the exact time may vary).
Any user for whom two-step verification is enabled can reissue his or her own secret key. When a user authenticates with the reissued secret key and uses it for logging in, Administration Server saves the new secret key for the user account. If the user enters the new secret key incorrectly, Administration Server does not save the new secret key and leaves the current secret key valid for the further authentication.
Any authentication software that supports the Time-based One-time Password algorithm (TOTP) can be used as an authenticator app, for example, Google Authenticator. In order to generate the security code, you must synchronize the time set in the authenticator app with the time set for Administration Server.
To check if Open Single Management Platform supports the authenticator app that you want to use, enable two-step verification for all users or for a particular user.
One of the steps suggests that you specify the security code generated by the authenticator app. If it succeeds, then Open Single Management Platform supports the selected authenticator.
An authenticator app generates the security code as follows:
- Administration Server generates a special secret key and QR code.
- You pass the generated secret key or QR code to the authenticator app.
- The authenticator app generates a single-use security code that you pass to the authentication window of Administration Server.
We highly recommend that you save the secret key (or QR code) and keep it in a safe place. This will help you to restore access to OSMP Console in case you lose access to the mobile device.
To secure the usage of Open Single Management Platform, you can enable two-step verification for your own account and enable two-step verification for all users.
You can exclude accounts from two-step verification. This can be necessary for service accounts that cannot receive a security code for authentication.
Two-step verification works according to the following rules:
- Only a user account that has the Modify object ACLs right in the General features: User permissions functional area can enable two-step verification for all users.
- Only a user that enabled two-step verification for his or her own account can enable the option of two-step verification for all users.
- Only a user that enabled two-step verification for his or her own account can exclude other user accounts from the list of two-step verification enabled for all users.
- A user can enable two-step verification only for his or her own account.
- A user account that has the Modify object ACLs right in the General features: User permissions functional area and is logged in to OSMP Console by using two-step verification can disable two-step verification: for any other user only if two-step verification for all users is disabled, for a user excluded from the list of two-step verification that is enabled for all users.
- Any user that logged in to OSMP Console by using two-step verification can reissue his or her own secret key.
- You can enable the two-step verification for all users option for the Administration Server you are currently working with. If you enable this option on the Administration Server, you also enable this option for the user accounts of its virtual Administration Servers and do not enable two-step verification for the user accounts of the secondary Administration Servers.
Enabling two-step verification for your own account
You can enable two-step verification only for your own account.
Before you start enabling two-step verification for your account, ensure that an authenticator app is installed on the mobile device. Ensure that the time set in the authenticator app is synchronized with the time set of the device on which Administration Server is installed.
To enable two-step verification for a user account:
- In the main menu, go to Users & roles → Users & groups, and then select the Users tab.
- Click the name of your account.
- In the user settings window that opens, select the Authentication security tab:
- Select the Request user name, password, and security code (two-step verification) option. Click the Save button.
- In the two-step verification window that opens, click View how to set up two-step verification.
Click View QR code.
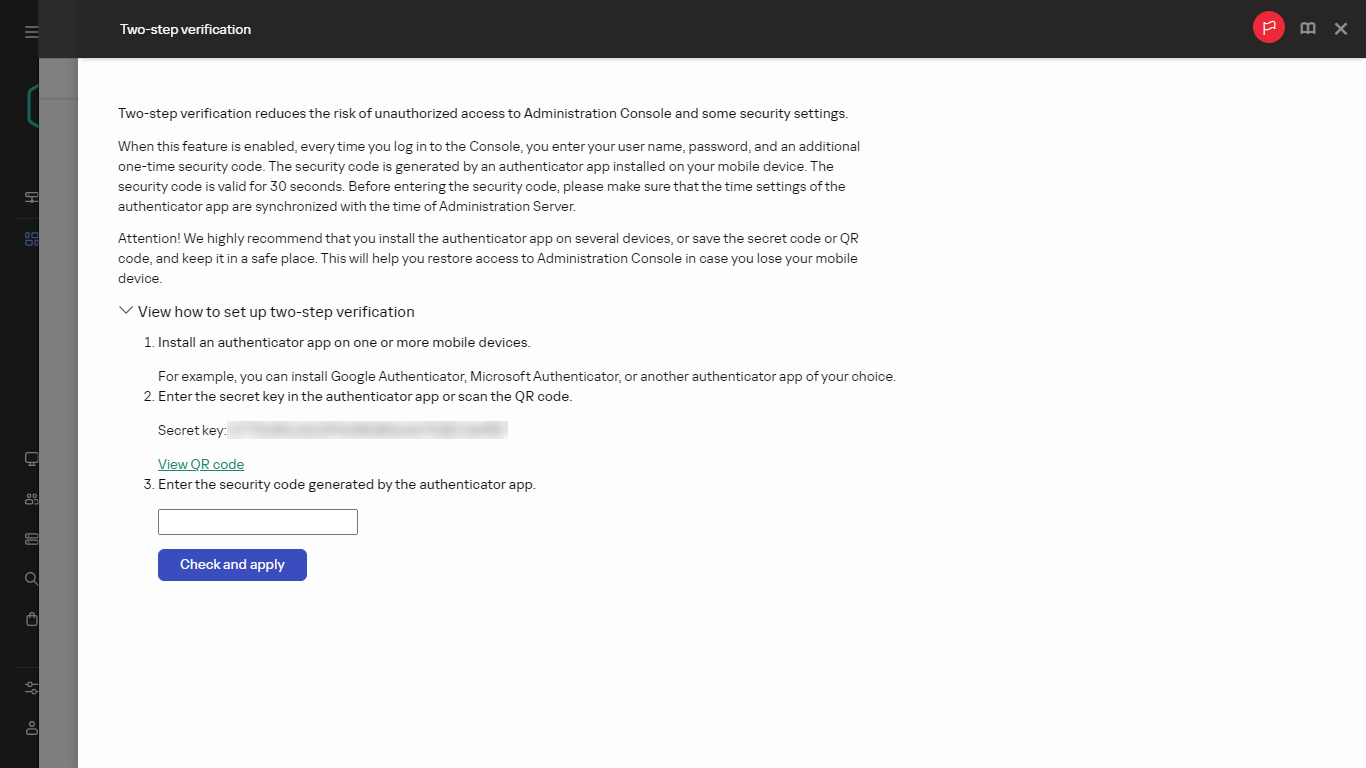
Generating a QR code for the authenticator app
- Scan the QR code by the authenticator app on the mobile device to receive one-time security code.
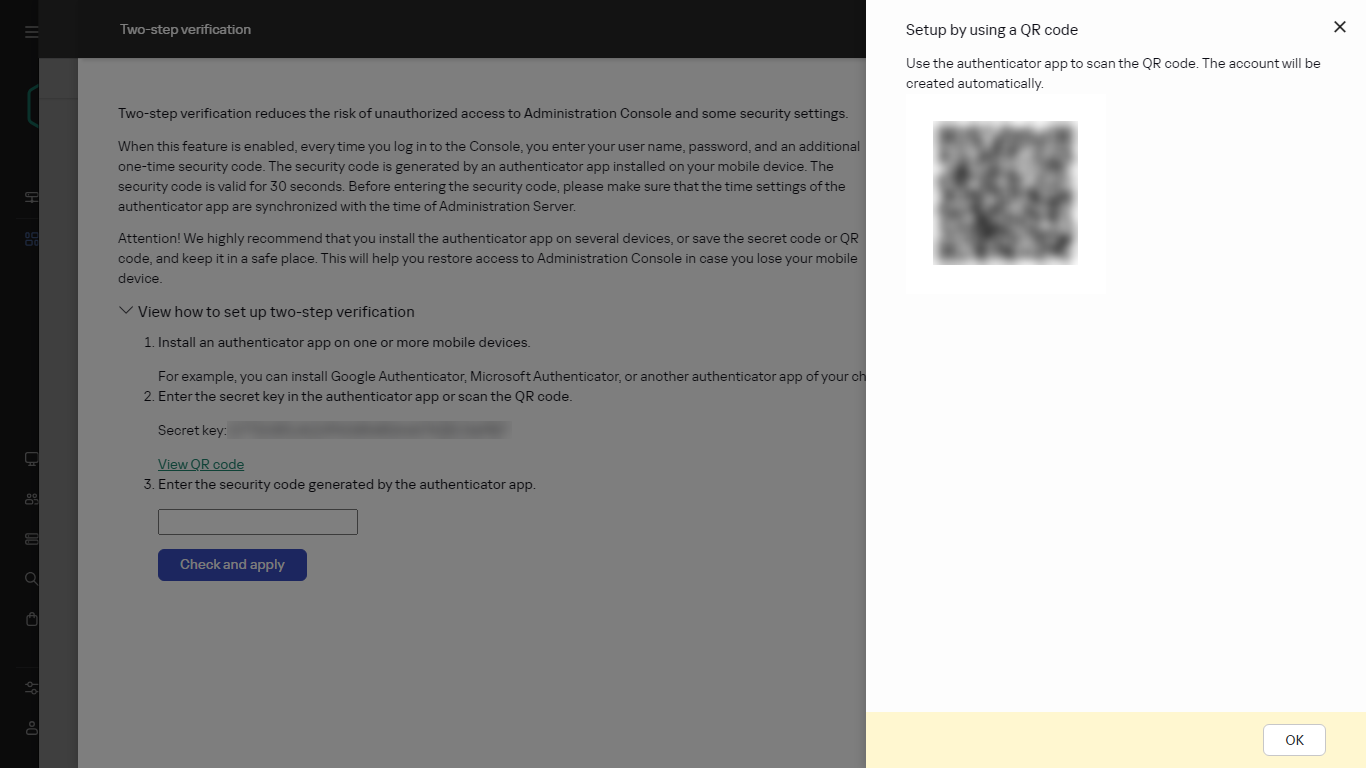
QR code for the authenticator app
- In the two-step verification window, specify the security code generated by the authenticator app, and then click the Check and apply button.
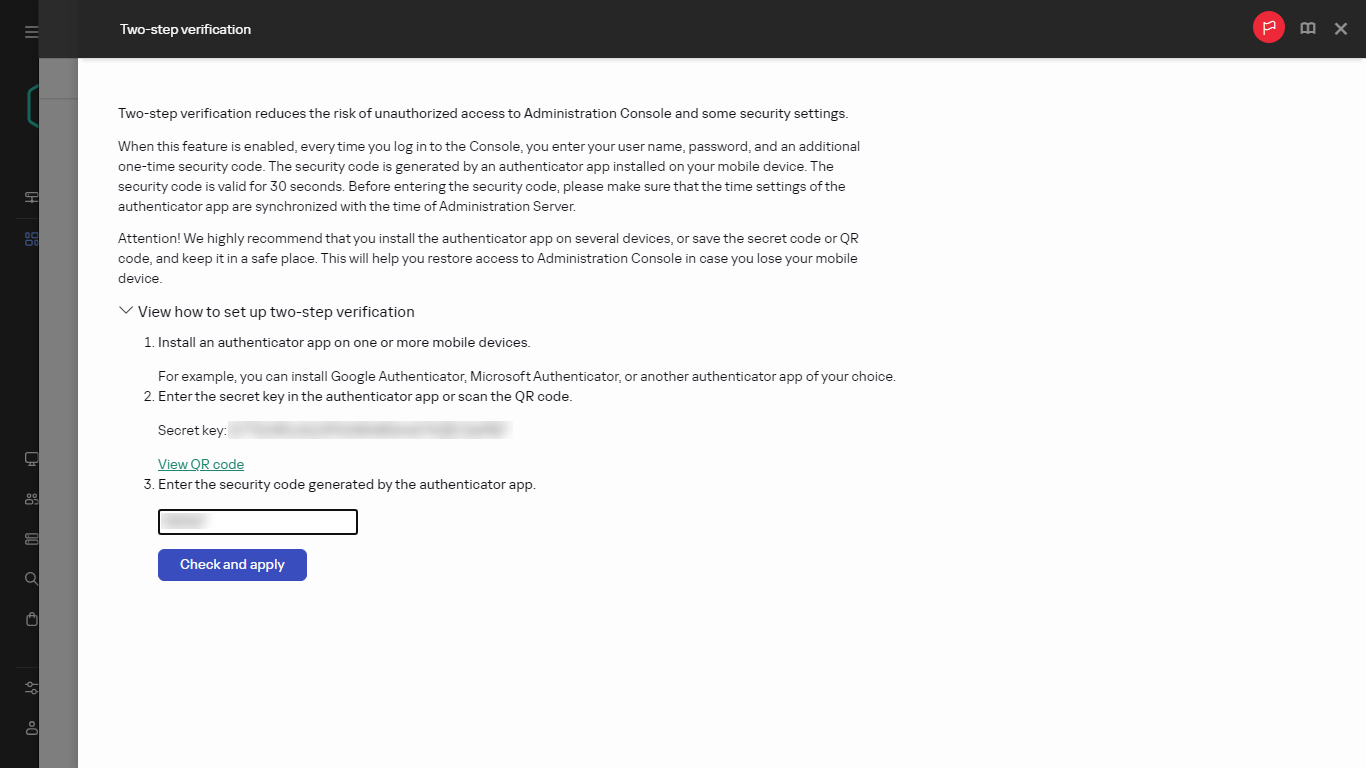
Entering the security code from the authenticator app
- Click the Save button.
Two-step verification is enabled for your account.
Scan the QR code by the authenticator app on the mobile device to receive one-time security code.
Enabling required two-step verification for all users
You can enable two-step verification for all users of Administration Server if your account has the Modify object ACLs right in the General features: User permissions functional area and if you are authenticated by using two-step verification.
To enable two-step verification for all users:
- In the main menu, click the settings icon () next to the name of the required Administration Server.
The Administration Server properties window opens.
- On the Authentication security tab of the properties window, switch the toggle button of the two-step verification for all users option to the enabled position.
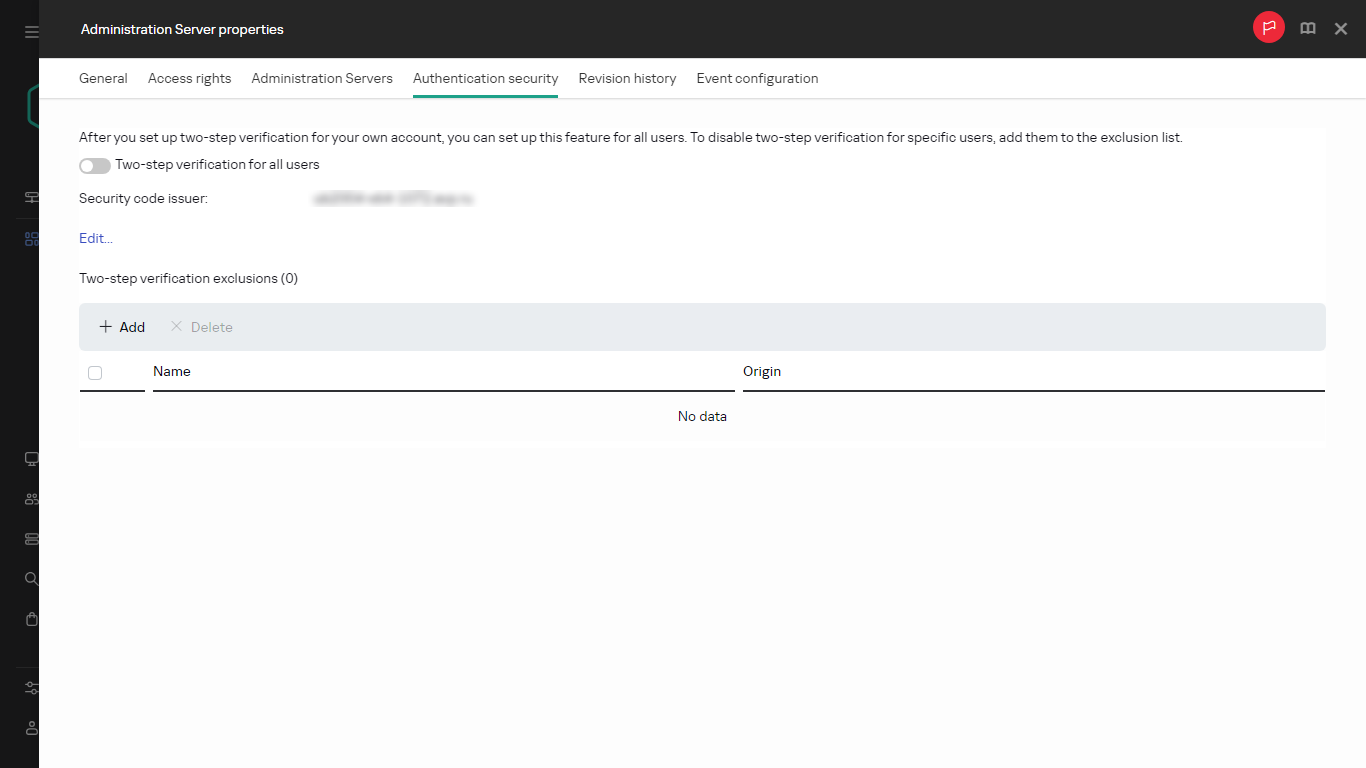
Enabling two-step verification for all users
- If you did not enable two-step verification for your account, the application opens the window for enabling two-step verification for your own account.
- In the two-step verification window, click View how to set up two-step verification.
- Click View QR code.
Generating a QR code for the authenticator application
- Scan the QR code by the authenticator application on the mobile device to receive one-time security code.
The QR code for the authenticator application
Alternatively, enter the secret key in the authenticator application manually.
- In the two-step verification window, specify the security code generated by the authenticator application, and then click the Check and apply button.
Entering the security code from the authenticator application
Two-step verification is enabled for all users. From now on, users of the Administration Server, including the users that were added after enabling two-step verification for all users, have to configure two-step verification for their accounts, except for users that are excluded from two-step verification.
Disabling two-step verification for a user account
You can disable two-step verification for your own account, as well as for an account of any other user.
You can disable two-step verification of another user's account if your account has the Modify object ACLs right in the General features: User permissions functional area and if you are authenticated by using two-step verification.
To disable two-step verification for a user account:
- In the main menu, go to Users & roles → Users & groups, and then select the Users tab.
- Click the name of the internal user account for whom you want to disable two-step verification. This may be your own account or an account of any other user.
- In the user settings window that opens, select the Authentication security tab.
- Select the Request only user name and password option if you want to disable two-step verification for a user account.
- Click the Save button.
Two-step verification is disabled for the user account.
If you want to restore access for a user that cannot log in to OSMP Console by using two-step verification, disable two-step verification for this user account, and then select the Request only user name and password option as described above. After that, log in to OSMP Console under the user account for which you disabled two-step verification, and then enable verification again.
Disabling required two-step verification for all users
You can disable required two-step verification for all users if two-step verification is enabled for your account and your account has the Modify object ACLs right in the General features: User permissions functional area. If two-step verification is not enabled for your account, you must enable two-step verification for your account before disabling it for all users.
To disable two-step verification for all users:
- In the main menu, click the settings icon () next to the name of the required Administration Server.
The Administration Server properties window opens.
- On the Authentication security tab of the properties window, switch the toggle button of the two-step verification for all users option to disabled position.
- Enter the credentials of your account in the authentication window.
Two-step verification is disabled for all users. Disabling two-step verification for all users does not applied to specific accounts for which two-step verification was previously enabled separately.
Excluding accounts from two-step verification
You can exclude user accounts from two-step verification if you have the Modify object ACLs right in the General features: User permissions functional area.
If a user account is excluded from the list of two-step verification for all users, this user does not have to use two-step verification.
Excluding accounts from two-step verification can be necessary for service accounts that cannot pass the security code during authentication.
If you want to exclude some user accounts from two-step verification:
- In the main menu, click the settings icon () next to the name of the required Administration Server.
The Administration Server properties window opens.
- On the Authentication security tab of the properties window, in the two-step verification exclusions table, click the Add button.
- In the window that opens:
- Select the user accounts that you want to exclude.
- Click the OK button.
The selected user accounts are excluded from two-step verification.
Configuring two-step verification for your own account
The first time you sign in to Open Single Management Platform after two-step verification is enabled, the window for configuring two-step verification for your own account opens.
Before you configure two-step verification for your account, ensure that an authenticator app is installed on the mobile device. Ensure that the time on the device with the authenticator app and the time on the device with the Administration Server are synchronized to UTC, by using external time sources.
To configure two-step verification for your account:
- Generate a one-time security code by using the authenticator app on the mobile device. To do this, perform one of the following actions:
- Enter the secret key in the authenticator app manually.
- Click View QR code and scan the QR code by using the authenticator app.
A security code will display on the mobile device.
- In the configure two-step verification window, specify the security code generated by the authenticator app, and then click the Check and apply button.
Two-step verification is configured for your account. You are able to access the Administration Server in accordance with your rights.
Page top
Prohibit new users from setting up two-step verification for themselves
In order to further improve OSMP Console access security, you can prohibit new users from setting up two-step verification for themselves.
If this option is enabled, a user with disabled two-step verification, for example new domain administrator, cannot configure two-step verification for themselves. Therefore, such user cannot be authenticated on Administration Server and cannot sign in to OSMP Console without approval from another Open Single Management Platform administrator who already has two-step verification enabled.
This option is available if two-step verification is enabled for all users.
To prohibit new users from setting up two-step verification for themselves:
- In the main menu, click the settings icon () next to the name of the required Administration Server.
The Administration Server properties window opens.
- On the Authentication security tab of the properties window, switch the toggle button Prohibit new users from setting up two-step verification for themselves to the enabled position.
This option does not affect the user accounts added to the two-step verification exclusions.
In order to grant OSMP Console access to a user with disabled two-step verification, temporary turn off the Prohibit new users from setting up two-step verification for themselves option, ask the user to enable two-step verification, and then turn on the option back.
Page top
Generating a new secret key
You can generate a new secret key for a two-step verification for your account only if you are authorized by using two-step verification.
To generate a new secret key for a user account:
- In the main menu, go to Users & roles → Users & groups, and then select the Users tab.
- Click the name of the user account for whom you want to generate a new secret key for two-step verification.
- In the user settings window that opens, select the Authentication security tab.
- On the Authentication security tab, click the Generate a new secret key link.
- In the two-step verification window that opens, specify a new security key generated by the authenticator app.
- Click the Check and apply button.
A new secret key is generated for the user.
If you lose the mobile device, you can install an authenticator app on another mobile device and generate a new secret key to restore access to OSMP Console.
Page top
Editing the name of a security code issuer
You can have several identifiers (they are called issuers) for different Administration Servers. You can change the name of a security code issuer in case, for example, if the Administration Server already uses a similar name of security code issuer for another Administration Server. By default, the name of a security code issuer is the same as the name of the Administration Server.
After you change the security code issuer name you have to reissue a new secret key and pass it to the authenticator app.
To specify a new name of security code issuer:
- In the main menu, click the settings icon () next to the name of the required Administration Server.
The Administration Server properties window opens.
- In the user settings window that opens, select the Authentication security tab.
- On the Authentication security tab, click the Edit link.
The Edit security code issuer section opens.
- Specify a new security code issuer name.
- Click the OK button.
A new security code issuer name is specified for the Administration Server.
Changing the number of allowed password entry attempts
The Open Single Management Platform user can enter an invalid password a limited number of times. After the limit is reached, the user account is blocked for one hour.
By default, the maximum number of allowed attempts to enter a password is 10. You can change the number of allowed password entry attempts, as described in this section.
To change the number of allowed password entry attempts:
- On the Administration Server device, run a Linux command line.
- For the klscflag utility, run the following command:
sudo /opt/kaspersky/ksc64/sbin/klscflag -fset -pv klserver -n SrvSplPpcLogonAttempts -t d -v Nwhere N is a number of attempts to enter a password.
- To apply the changes, restart the Administration Server service.
The maximum number of allowed password entry attempts is changed.
Page top
Deleting a user or a security group
You can delete only internal users or internal security groups.
To delete a user or a security group:
- In the main menu, go to Users & roles → Users & groups, and then select the Users or the Groups tab.
- Select the check box next to the user or the security group that you want to delete.
- Click Delete.
- In the window that opens, click OK.
The user or the security group is deleted.
Changing the password for a user account
You may need to change the password for your own account or for other user account if the current password is about to expire or you want to change it to a more secure one.
The password must comply with the following rules:
- The password must be 8 to 256 characters long.
- The password must contain characters from at least three of the groups listed below:
- Uppercase letters (A-Z)
- Lowercase letters (a-z)
- Numbers (0-9)
- Special characters (@ # $ % ^ & * - _ ! + = [ ] { } | : ' , . ? / \ ` ~ " ( ) ;)
- The password must not contain any whitespaces, Unicode characters, or the combination of "." and "@", when "." is placed before "@".
Changing the password for your own account
To edit the password for your account:
- In the main menu, go to your account settings, and then select Change password.
- Enter the current password, and then specify the new password for the connection to Open Single Management Platform.
To see the entered password, click
 .
. - If your account is protected against unauthorized modification, you must confirm that you have the permissions to change this account. In the Account protection window, specify the credentials of your own account or the account that has the Modify object ACLs right in the General features: User permissions functional area.
- If two-step verification is enabled for the account that you used in the previous step, enter the security code generated by the authenticator app on the mobile device.
Changing the password for an internal user account
To edit the password for an internal user account:
- In the main menu, go to Users & roles → Users & groups, and then select the Users tab.
- Click the name of the user account that you want to edit.
- In the user settings window that opens, on the General tab, click the Change password button.
- Set a new password for the user connection to Open Single Management Platform.
To see the entered password, click
. - If the user account is protected against unauthorized modification, you must confirm that you have the permissions to change this account. In the Account protection window, specify the credentials of the account that has the Modify object ACLs right in the General features: User permissions functional area.
Configuring the options for changing password by using server flags
You can use the klscflag utility to configure changing password by using the following commands:
- Configuring the password rotation period (the
LP_SplPwdChangePeriodDaysflag)klscflag -fset -pv .core/.independent -s KLLIM -n LP_SplPwdChangePeriodDays -t d -v <rotation_period>Where
<rotation_period>is a period of time in days after which the user password expires. Possible values: 0–730. If the parameter value is 0, the password rotation is disabled. - Configuring the time of the preliminary warning about the need to change the password (the
LP_SplPwdChangeNotificationHoursflag)klscflag -fset -pv .core/.independent -s KLLIM -n LP_SplPwdChangeNotificationHours -t d -v <warning_time>Where
<warning_time>is a period of time in hours before the user password expires. During this time, the notification about the need for the password change is displayed. Possible values: 0–17520. If the parameter value is 0, the warning time is 25 percent of the password rotation period. - Specifying the default value of the User must change password at first sign-in option (the
LP_SplPwdForceChangeflag)klscflag -fset -pv .core/.independent -s KLLIM -n LP_SplPwdForceChange -t d -v <value>Where the possible values of the
<value>flag:1—the User must change password at first sign-in option is enabled.0—the User must change password at first sign-in option is disabled.
To view the current flag value, run the following command:
klscflag -fget -pv .core/.independent -s KLLIM -n <flag> -t d
Where <flag> is the LP_SplPwdChangePeriodDays, LP_SplPwdChangeNotificationHours, or LP_SplPwdForceChange flag.
Creating a user role
To create a user role:
- In the main menu, go to Users & roles → Roles.
- Click Add.
- In the New role name window that opens, enter the name of the new role.
- Click OK to apply the changes.
- In the role properties window that opens, change the settings of the role:
- On the General tab, edit the role name.
You cannot edit the name of a predefined role.
- On the Settings tab, edit the role scope and policies and profiles associated with the role.
- On the Access rights tab, edit the rights for access to Kaspersky applications.
- On the General tab, edit the role name.
- Click Save to save the changes.
The new role appears in the list of user roles.
Editing a user role
To edit a user role:
- In the main menu, go to Users & roles → Roles.
- Click the name of the role that you want to edit.
- In the role properties window that opens, change the settings of the role:
- On the General tab, edit the role name.
You cannot edit the name of a predefined role.
- On the Settings tab, edit the role scope and policies and profiles associated with the role.
- On the Access rights tab, edit the rights for access to Kaspersky applications.
- On the General tab, edit the role name.
- Click Save to save the changes.
The updated role appears in the list of user roles.
Editing the scope of a user role
A user role scope is a combination of users and administration groups. Settings associated with a user role apply only to devices that belong to users who have this role, and only if these devices belong to groups associated with this role, including child groups.
To add users, security groups, and administration groups to the scope of a user role, you can use either of the following methods:
Method 1:
- In the main menu, go to Users & roles → Users & groups, and then select the Users or the Groups tab.
- Select check boxes next to the users or security groups that you want to add to the user role scope.
- Click the Assign role button.
The Role assignment wizard starts. Proceed through the wizard by using the Next button.
- On the Select role step, select the user role that you want to assign.
- On the Define scope step, select the administration group that you want to add to the user role scope.
- Click the Assign role button to close the window.
The selected users or security groups and the selected administration group are added to the scope of the user role.
Method 2:
- In the main menu, go to Users & roles → Roles.
- Click the name of the role for which you want to define the scope.
- In the role properties window that opens, select the Settings tab.
- In the Role scope section, click Add.
The Role assignment wizard starts. Proceed through the wizard by using the Next button.
- On the Define scope step, select the administration group that you want to add to the user role scope.
- On the Select users step, select users and security groups that you want to add to the user role scope.
- Click the Assign role button to close the window.
- Click the Close button () to close the role properties window.
The selected users or security groups and the selected administration group are added to the scope of the user role.
Method 3:
- In the main menu, click the settings icon () next to the name of the required Administration Server.
The Administration Server properties window opens.
- On the Access rights tab, select the check box next to the name of the user or the security group that you want to add to the user role scope, and then click the Roles button.
You cannot select multiple users or security groups at the same time. If you select more than one item, the Roles button will be disabled.
- In the Roles window, select the user role that you want to assign, and then apply and save changes.
The selected users or security groups are added to the scope of the user role.
Deleting a user role
To delete a user role:
- In the main menu, go to Users & roles → Roles.
- Select the check box next to the name of the role that you want to delete.
- Click Delete.
- In the window that opens, click OK.
The user role is deleted.
Associating policy profiles with roles
You can associate user roles with policy profiles. In this case, the activation rule for this policy profile is based on the role: the policy profile becomes active for a user that has the specified role.
For example, the policy bars any GPS navigation software on all devices in an administration group. GPS navigation software is necessary only on a single device in the Users administration group—the device owned by a courier. In this case, you can assign a "Courier" role to its owner, and then create a policy profile allowing GPS navigation software to run only on the devices whose owners are assigned the "Courier" role. All the other policy settings are preserved. Only the user with the role "Courier" will be allowed to run GPS navigation software. Later, if another worker is assigned the "Courier" role, the new worker also can run navigation software on your organization's device. Running GPS navigation software will still be prohibited on other devices in the same administration group.
To associate a role with a policy profile:
- In the main menu, go to Users & roles → Roles.
- Click the name of the role that you want to associate with a policy profile.
The role properties window opens with the General tab selected.
- Select the Settings tab, and scroll down to the Policies & profiles section.
- Click Edit.
- To associate the role with:
- An existing policy profile—Click the chevron icon (
 ) next to the required policy name, and then select the check box next to the profile with which you want to associate the role.
 - A new policy profile:
- Select the check box next to the policy for which you want to create a profile.
- Click New policy profile.
- Specify a name for the new profile and configure the profile settings.
- Click the Save button.
- Select the check box next to the new profile.
- An existing policy profile—Click the chevron icon (
- Click Assign to role.
The profile is associated with the role and appears in the role properties. The profile applies automatically to any device whose owner is assigned the role.
Updating Kaspersky databases and applications
This section describes steps you must take to regularly update the following:
- Kaspersky databases and software modules
- Installed Kaspersky applications, including Open Single Management Platform components and security applications
Updates functionality (including providing anti-virus signature updates and codebase updates), as well as KSN functionality may not be available in the software in the U.S.
Scenario: Regular updating Kaspersky databases and applications
This section provides a scenario for regular updating of Kaspersky databases, software modules, and applications. After you complete the Configuring network protection scenario, you must maintain the reliability of the protection system to make sure that the Administration Servers and managed devices are kept protected against various threats, including viruses, network attacks, and phishing attacks.
Network protection is kept up-to-date by regular updates of the following:
- Kaspersky databases and software modules
- Installed Kaspersky applications, including Open Single Management Platform components and security applications
When you complete this scenario, you can be sure of the following:
- Your network is protected by the most recent Kaspersky software, including Open Single Management Platform components and security applications.
- The anti-virus databases and other Kaspersky databases critical for the network safety are always up-to-date.
Prerequisites
The managed devices must have a connection to the Administration Server. If they do not have a connection, consider updating Kaspersky databases and software modules manually or directly from the Kaspersky update servers.
Administration Server must have a connection to the internet.
Before you start, make sure that you have done the following:
- Deployed the Kaspersky security applications to the managed devices according to the scenario of deploying Kaspersky applications through OSMP Console.
- Created and configured all required policies, policy profiles, and tasks according to the scenario of configuring network protection.
- Assigned an appropriate amount of distribution points in accordance with the number of managed devices and the network topology.
Updating Kaspersky databases and applications proceeds in stages:
- Choosing an update scheme
There are several schemes that you can use to install updates to Open Single Management Platform components and security applications. Choose the scheme or several schemes that meet the requirements of your network best.
- Creating the task for downloading updates to the repository of the Administration Server
Create the Download updates to the Administration Server repository task manually.
This task is required to download updates from Kaspersky update servers to the repository of the Administration Server, as well as to update Kaspersky databases and software modules for Open Single Management Platform. After the updates are downloaded, they can be propagated to the managed devices.
If your network has assigned distribution points, the updates are automatically downloaded from the Administration Server repository to the repositories of the distribution points. In this case the managed devices included in the scope of a distribution point download the updates from the repository of the distribution point instead of the Administration Server repository.
How-to instructions: Creating the task for downloading updates to the repository of the Administration Server
- Creating the task for downloading updates to the repositories of distribution points (optional)
By default, the updates are downloaded to the distribution points from the Administration server. You can configure Open Single Management Platform to download the updates to the distribution points directly from Kaspersky update servers. Download to the repositories of distribution points is preferable if the traffic between the Administration Server and the distribution points is more expensive than the traffic between the distribution points and Kaspersky update servers, or if your Administration Server does not have internet access.
When your network has assigned distribution points and the Download updates to the repositories of distribution points task is created, the distribution points download updates from Kaspersky update servers, and not from the Administration Server repository.
How-to instructions: Creating the task for downloading updates to the repositories of distribution points
- Configuring distribution points
When your network has assigned distribution points, make sure that the Deploy updates option is enabled in the properties of all required distribution points. When this option is disabled for a distribution point, the devices included in the scope of the distribution point download updates from the repository of the Administration Server.
- Optimizing the update process by using the diff files (optional)
You can optimize traffic between the Administration Server and the managed devices by using diff files. When this feature is enabled, the Administration Server or a distribution point downloads diff files instead of entire files of Kaspersky databases or software modules. A diff file describes the differences between two versions of a file of a database or software module. Therefore, a diff file occupies less space than an entire file. This results in decrease in the traffic between the Administration Server or distribution points and the managed devices. To use this feature, enable the Download diff files option in the properties of the Download updates to the Administration Server repository task and/or the Download updates to the repositories of distribution points task.
How-to instructions: Using diff files for updating Kaspersky databases and software modules
- Configuring automatic installation of updates for the security applications
Create the Update tasks for the managed applications to provide timely updates to the software modules and Kaspersky databases, including anti-virus databases. To ensure timely updates, we recommend that you select the When new updates are downloaded to the repository option when configuring the task schedule.
If your network includes IPv6-only devices and you want to regularly update the security applications installed on these devices, make sure that the Administration Server version 13.2 and the Network Agent version 13.2 are installed on managed devices.
If an update requires reviewing and accepting the terms of the End User License Agreement, then you first need to accept the terms. After that the update can be propagated to the managed devices.
- Approving and declining updates of managed Kaspersky applications
By default, the downloaded software updates have the Undefined status. You can change the status to Approved or Declined. The approved updates are always installed. If an update of a managed Kaspersky application requires reviewing and accepting the terms of the End User License Agreement, then you first need to accept the terms. After that the update can be propagated to the managed devices. The updates for which you set Declined status will not be installed on devices. If a declined update for a managed application was previously installed, Open Single Management Platform will try to uninstall the update from all devices.
Approving and declining updates is available only for Network Agent and managed Kaspersky applications installed on Windows-based client devices. Seamless updating of Administration Server, OSMP Console, and management web plug-ins is not supported.
How-to instructions: Approving and declining software updates
Results
Upon completion of the scenario, Open Single Management Platform is configured to update Kaspersky databases after the updates are downloaded to the repository of the Administration Server. You can then proceed to monitoring the network status.
Page top
About updating Kaspersky databases, software modules, and applications
To be sure that the protection of your Administration Servers and managed devices is up-to-date, you must provide timely updates of the following:
- Kaspersky databases and software modules
Before downloading Kaspersky databases and software modules, Open Single Management Platform checks if Kaspersky servers are accessible. If access to the servers using system DNS is not possible, the application uses public DNS servers. This is necessary to make sure anti-virus databases are updated and the level of security is maintained for the managed devices.
- Installed Kaspersky applications, including Open Single Management Platform components and security applications
Open Single Management Platform allows you to update Network Agent and Kaspersky applications installed on Windows-based client devices automatically. Seamless updating of Administration Server, OSMP Console, and management web plug-ins is not supported. To update these components, you have to download the latest versions from the Kaspersky website, and then install them manually.
Depending on the configuration of your network, you can use the following schemes of downloading and distributing the required updates to the managed devices:
- By using a single task: Download updates to the Administration Server repository
- By using two tasks:
- The Download updates to the Administration Server repository task
- The Download updates to the repositories of distribution points task
- Manually through a shared folder or an FTP server
- Directly from Kaspersky update servers to Kaspersky Endpoint Security on the managed devices
- Through a network folder if Administration Server has no internet connection
Using the Download updates to the Administration Server repository task
In this scheme, Open Single Management Platform downloads updates through the Download updates to the Administration Server repository task. In small networks that contain less than 300 managed devices in a single network segment or less than 10 managed devices in each network segment, the updates are distributed to the managed devices directly from the Administration Server repository (see figure below).
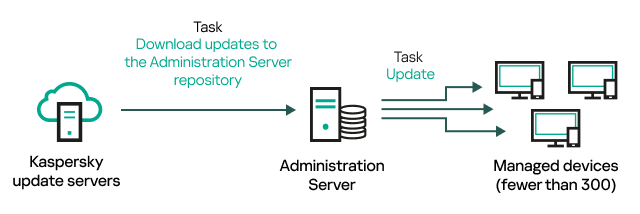
Updating by using the Download updates to the Administration Server repository task without distribution points
As a source of updates, you can use not only Kaspersky update servers, but also a network folder.
By default, the Administration Server communicates with Kaspersky update servers and downloads updates by using the HTTPS protocol. You can configure the Administration Server to use the HTTP protocol instead of HTTPS.
If your network contains 300 managed devices or more in a single network segment or if your network consists of several network segments with more than 9 managed devices in each network segment, we recommend that you use distribution points to propagate the updates to the managed devices (see figure below). Distribution points reduce the load on the Administration Server and optimize traffic between the Administration Server and the managed devices. You can calculate the number and configuration of distribution points required for your network.
In this scheme, the updates are automatically downloaded from the Administration Server repository to the repositories of the distribution points. The managed devices included in the scope of a distribution point download the updates from the repository of the distribution point instead of the Administration Server repository.
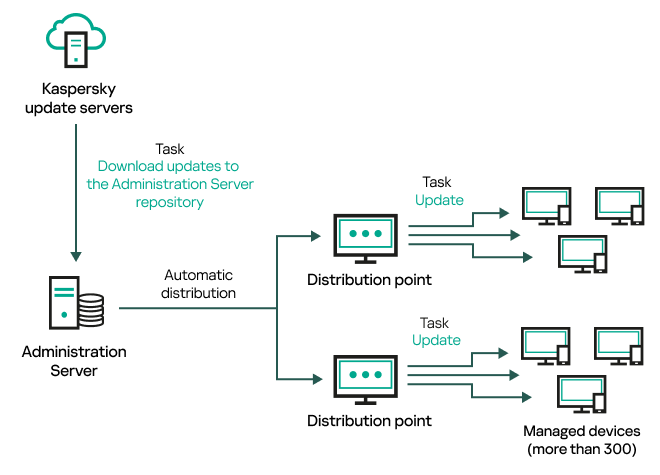
Updating by using the Download updates to the Administration Server repository task with distribution points
When the Download updates to the Administration Server repository task is complete, the updates for Kaspersky databases and software modules for Kaspersky Endpoint Security are downloaded to the Administration Server repository. These updates are installed through the Update task for Kaspersky Endpoint Security.
The Download updates to the repository of the Administration Server task is not available on virtual Administration Servers. The repository of the virtual Administration Server displays updates downloaded to the primary Administration Server.
You can configure the updates to be verified for operability and errors on a set of test devices. If the verification is successful, the updates are distributed to other managed devices.
Each Kaspersky application requests required updates from Administration Server. Administration Server aggregates these requests and downloads only those updates that are requested by any application. This ensures that the same updates are not downloaded multiple times and that unnecessary updates are not downloaded at all. When running the Download updates to the Administration Server repository task, Administration Server sends the following information to Kaspersky update servers automatically in order to ensure the downloading of relevant versions of Kaspersky databases and software modules:
- Application ID and version
- Application setup ID
- Active key ID
- Download updates to the repository of the Administration Server task run ID
None of the transmitted information contains personal or other confidential data. AO Kaspersky Lab protects information in accordance with requirements established by law.
Using two tasks: the Download updates to the Administration Server repository task and the Download updates to the repositories of distribution points task
You can download updates to the repositories of distribution points directly from the Kaspersky update servers instead of the Administration Server repository, and then distribute the updates to the managed devices (see figure below). Download to the repositories of distribution points is preferable if the traffic between the Administration Server and the distribution points is more expensive than the traffic between the distribution points and Kaspersky update servers, or if your Administration Server does not have internet access.
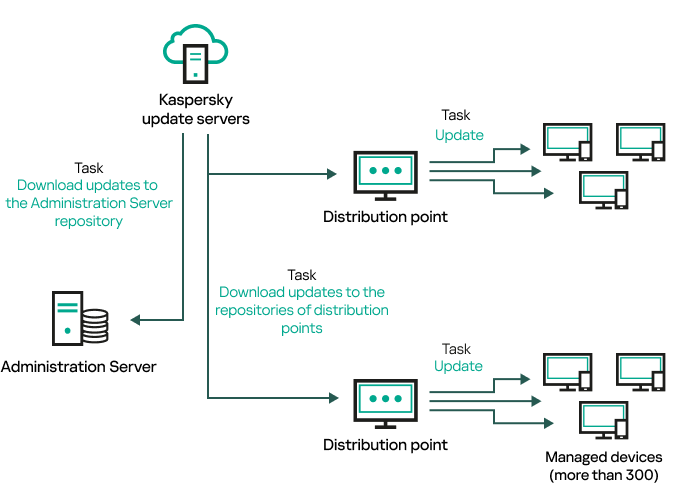
Updating by using the Download updates to the Administration Server repository task and the Download updates to the repositories of distribution points task
By default, the Administration Server and distribution points communicate with Kaspersky update servers and download updates by using the HTTPS protocol. You can configure the Administration Server and/or distribution points to use the HTTP protocol instead of HTTPS.
To implement this scheme, create the Download updates to the repositories of distribution points task in addition to the Download updates to the Administration Server repository task. After that the distribution points will download updates from Kaspersky update servers, and not from the Administration Server repository.
The Download updates to the Administration Server repository task is also required for this scheme, because this task is used to download Kaspersky databases and software modules for Open Single Management Platform.
Manually through a shared folder or an FTP server
If the client devices do not have a connection to the Administration Server, you can use a shared resource as a source for updating Kaspersky databases, software modules, and applications. In this scheme, you need to copy required updates from the Administration Server repository to a removable drive, then copy the updates to the shared resource specified as an update source in the settings of Kaspersky Endpoint Security (see figure below).
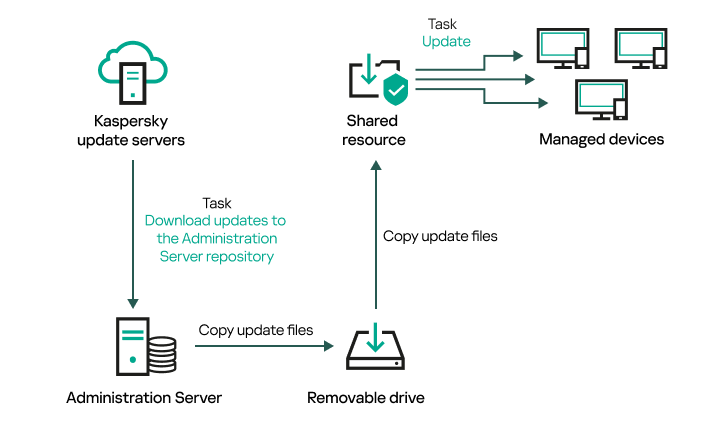
Updating through a shared folder or an FTP server
For more information about sources of updates in Kaspersky Endpoint Security, see the following Helps:
Directly from Kaspersky update servers to Kaspersky Endpoint Security on the managed devices
On the managed devices, you can configure Kaspersky Endpoint Security to receive updates directly from Kaspersky update servers (see figure below).
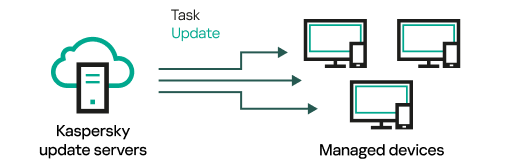
Updating security applications directly from Kaspersky update servers
In this scheme, the security application does not use the repository provided by Open Single Management Platform. To receive updates directly from Kaspersky update servers, specify Kaspersky update servers as an update source in the security application. For more information about these settings, see the following Helps:
Through a network folder if Administration Server has no internet connection
If Administration Server has no internet connection, you can configure the Download updates to the Administration Server repository task to download updates from a network folder. In this case, you must copy the required update files to the specified folder from time to time. For example, you can copy the required update files from one of the following sources:
- Administration Server that has an internet connection (see the figure below)
Because an Administration Server downloads only the updates that are requested by the security applications, the sets of security applications managed by the Administration Servers—the one that has an internet connection and the one that does not—must match.
If the Administration Server that you use to download updates has version 13.2 or earlier, open properties of the Download updates to the Administration Server repository task, and then enable the Download updates by using the old scheme option.
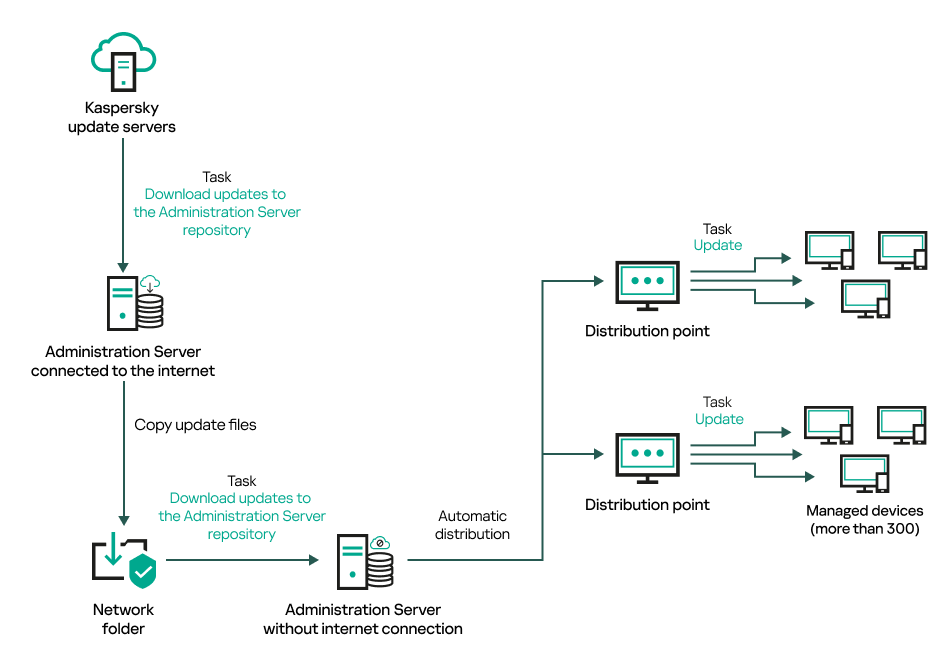
Updating through a network folder if Administration Server has no internet connection
- Kaspersky Update Utility
Because this utility uses the old scheme to download updates, open properties of the Download updates to the Administration Server repository task, and then enable the Download updates by using the old scheme option.
Creating the Download updates to the Administration Server repository task
The Download updates to the Administration Server repository task allows you to download updates of databases and software modules for Kaspersky security applications from Kaspersky update servers to the Administration Server repository. In the list of tasks, there can only be one Download updates to the Administration Server repository task.
After the Download updates to the Administration Server repository task is complete and the updates are downloaded, they can be propagated to the managed devices.
Before you distribute updates to the managed devices, you can run the Update verification task. This allows you to make sure that Administration Server installs the downloaded updates properly and a security level is not decreased because of the updates. To verify them before distributing, configure the Run update verification option in the Download updates to the Administration Server repository task settings.
To create a Download updates to the Administration Server repository task:
- In the main menu, go to Assets (Devices) → Tasks.
- Click Add.
The New task wizard starts. Follow the steps of the wizard.
- For the Open Single Management Platform application, select the Download updates to the Administration Server repository task type.
- Specify the name for the task that you are creating. A task name cannot be more than 100 characters long and cannot include any special characters ("*<>?\:|).
- On the Finish task creation page, you can enable the Open task details when creation is complete option to open the task properties window and modify the default task settings. Otherwise, you can configure task settings later, at any time.
- Click the Finish button.
The task is created and displayed in the list of tasks.
- Click the created task name to open the task properties window.
- In the task properties window, on the Application settings tab, specify the following settings:
- In the task properties window, on the Schedule tab, create a schedule for task start. If necessary, specify the following settings:
- Start task:
- Additional task settings:
- Click the Save button.
The task is created and configured.
When Administration Server performs the Download updates to the Administration Server repository task, updates to databases and software modules are downloaded from the updates source and stored on Administration Server. If you create this task for an administration group, it will only be applied to Network Agents included in the specified administration group.
If you use a proxy server when connecting to the internet, you have to specify the proxy server address in the Administration Server properties. Otherwise, the Download updates to the Administration Server repository task will not work.
Viewing downloaded updates
When Administration Server performs the Download updates to the Administration Server repository task, updates to databases and software modules are downloaded from the updates source and stored on Administration Server. You can view the downloaded updates in the Updates for Kaspersky databases and software modules section.
To view the list of downloaded updates,
In the main menu, go to Operations → Kaspersky applications → Updates for Kaspersky databases and software modules.
A list of available updates appears.
Verifying downloaded updates
Before installing updates to the managed devices, you can first check the updates for operability and errors through the Update verification task. The Update verification task is performed automatically as part of the Download updates to the Administration Server repository task. The Administration Server downloads updates from the source, saves them in the temporary repository, and runs the Update verification task. If the task completes successfully, the updates are copied from the temporary repository to the Administration Server repository. They are distributed to all client devices for which the Administration Server is the source of updates.
If, as a result of the Update verification task, updates located in the temporary repository are incorrect or if the Update verification task completes with an error, such updates are not copied to the Administration Server repository. The Administration Server retains the previous set of updates. Also, the tasks that have the When new updates are downloaded to the repository schedule type are not started then. These operations are performed at the next start of the Download updates to the Administration Server repository task if scanning of the new updates completes successfully.
A set of updates is considered invalid if any of the following conditions is met on at least one test device:
- An update task error occurred.
- The real-time protection status of the security application changed after the updates were applied.
- An infected object was detected during running of the on-demand scan task.
- A runtime error of a Kaspersky application occurred.
If none of the listed conditions is true for any test device, the set of updates is considered valid, and the Update verification task is considered to have completed successfully.
Before you start to create the Update verification task, perform the prerequisites:
- Create an administration group with several test devices. You will need this group to verify the updates.
We recommend using devices with the most reliable protection and the most popular application configuration across the network. This approach increases the quality and probability of virus detection during scans, and minimizes the risk of false positives. If viruses are detected on test devices, the Update verification task is considered unsuccessful.
- Create the update and malware scan tasks for an application supported by Open Single Management Platform, for example, Kaspersky Endpoint Security for Linux. When creating the update and malware scan tasks, specify the administration group with the test devices.
The Update verification task sequentially runs the update and malware scan tasks on test devices to check that all updates are valid. In addition, when creating the Update verification task, you need to specify the update and malware scan tasks.
- Create the Download updates to the Administration Server repository task.
To make Open Single Management Platform verify downloaded updates before distributing them to client devices:
- In the main menu, go to Assets (Devices) → Tasks.
- Click the Download updates to the Administration Server repository task.
- In the task properties window that opens, go to the Application settings tab, and then enable the Run update verification option.
- If the Update verification task exists, click the Select task button. In the window that opens, select the Update verification task in the administration group with test devices.
- If you did not create the Update verification task earlier, do the following:
- Click the New task button.
- In the New task wizard that opens, specify the task name if you want to change the preset name.
- Select the administration group with test devices, which you created earlier.
- First, select the update task of a required application supported by Open Single Management Platform, and then select the malware scan task.
After that, the following options appear. We recommend leaving them enabled:
- Specify an account from which the Update verification task will be run. You can use your account and leave the Default account option enabled. Alternatively, you can specify that the task should be run under another account that has the necessary access rights. To do this, select the Specify account option, and then enter the credentials of that account.
- Click Save to close the properties window of the Download updates to the Administration Server repository task.
The automatic update verification is enabled. Now, you can run the Download updates to the Administration Server repository task, and it will start from update verification.
Creating the task for downloading updates to the repositories of distribution points
You can create the Download updates to the repositories of distribution points task for an administration group. This task will run for distribution points included in the specified administration group.
You can use this task, for example, if traffic between the Administration Server and the distribution point(s) is more expensive than traffic between the distribution point(s) and Kaspersky update servers, or if your Administration Server does not have internet access.
This task is required to download updates from Kaspersky update servers to the repositories of distribution points. The list of updates includes:
- Updates to databases and software modules for Kaspersky security applications
- Updates to Open Single Management Platform components
- Updates to Kaspersky security applications
After the updates are downloaded, they can be propagated to the managed devices.
To create the Download updates to the repositories of distribution points task, for a selected administration group:
- In the main menu, go to Assets (Devices) → Tasks.
- Click the Add button.
The New task wizard starts. Follow the steps of the wizard.
- For the Open Single Management Platform application, in the Task type field select Download updates to the repositories of distribution points.
- Specify the name for the task that you are creating. A task name cannot be more than 100 characters long and cannot include any special characters ("*<>?\:|).
- Select an option button to specify the administration group, the device selection, or the devices to which the task applies.
- At the Finish task creation step, if you want to modify the default task settings, enable the Open task details when creation is complete option. If you do not enable this option, the task is created with the default settings. You can modify the default settings later, at any time.
- Click the Create button.
The task is created and displayed in the list of tasks.
- Click the name of the created task to open the task properties window.
- On the Application settings tab of the task properties window, specify the following settings:
- Create a schedule for task start. If necessary, specify the following settings:
- Click the Save button.
The task is created and configured.
In addition to the settings that you specify during task creation, you can change other properties of a created task.
When the Download updates to the repositories of distribution points task is performed, updates for databases and software modules are downloaded from the update source and stored in the distribution points repository. Downloaded updates will only be used by distribution points that are included in the specified administration group and that have no update download task explicitly set for them.
Adding sources of updates for the Download updates to the Administration Server repository task
When you create or use the task for downloading updates to the Administration Server repository, you can choose the following sources of updates:
- Kaspersky update servers
- Primary Administration Server
This resource applies to tasks created for a secondary or virtual Administration Server.
- Local or network folder
This resource applies to tasks created for a secondary or virtual Administration Server.
- Network folder
In the Download updates to the Administration Server repository task and the Download updates to the repositories of distribution points task, user authentication does not work if you select a password-protected local or network folder as an update source. To resolve this issue, first mount the password-protected folder, and then specify the required credentials, for example, by means of the operating system. After that, you can select this folder as an update source in an update download task. Open Single Management Platform will not require that you enter the credentials.
Kaspersky update servers are used by default, but you can also download updates from a local or network folder. You might want to use the folder if your network does not have access to the internet. In this case, you can manually download updates from Kaspersky update servers and put the downloaded files in the necessary folder.
You can specify only one path to a local or network folder. As a local folder, you must specify a folder on the device where Administration Server is installed. As a network folder, you can use an FTP or HTTP server or an SMB share. If an SMB share requires authentication, it must be mounted in the system with the required credentials in advance. We recommend not using the SMB1 protocol since it is insecure.
If you add both Kaspersky update servers and the local or network folder, updates will be downloaded first from the folder. In the case of an error when downloading, Kaspersky update servers will be used.
In case a shared folder that contains updates is password-protected, enable the Specify account for access to shared folder of the update source (if any) option and enter the account credentials required for access.
To add the sources of updates:
- In the main menu, go to Assets (Devices) → Tasks.
- Click Download updates to the Administration Server repository.
- Go to the Application settings tab.
- On the Sources of updates line, click the Configure button.
- In the window that opens, click the Add button.
- In the update source list, add the necessary sources. If you select the Network folder or Local or network folder check box, specify a path to the folder.
- Click OK, and then close the update source properties window.
- In the update source window, click OK.
- Click the Save button in the task window.
Now updates are downloaded to the Administration Server repository from the specified sources.
Page top
Approving and declining software updates
The settings of an update installation task may require approval of updates that are to be installed. You can approve updates that must be installed and decline updates that must not be installed.
For example, you may want to first check the installation of updates in a test environment and make sure that they do not interfere with the operation of devices, and only then allow the installation of these updates on client devices.
Approving and declining updates is available only for Network Agent and managed applications installed on the Windows-based client devices. Seamless updating of Administration Server, OSMP Console, and management web plug-ins is not supported. To update these components, you have to download the latest versions from the Kaspersky website, and then install them manually.
To approve or decline one or several updates:
- In the main menu, go to Operations → Kaspersky applications → Seamless updates.
A list of available updates appears.
Updates of managed applications may require a specific minimum version of Kaspersky Security Center to be installed. If this version is later than your current version, these updates are displayed but cannot be approved. Also, no installation packages can be created from such updates until you upgrade Kaspersky Security Center. You are prompted to upgrade your Kaspersky Security Center instance to the required minimum version.
- If necessary, accept EULA by clicking the View and accept License Agreements button.
- Select the updates that you want to approve or decline.
- Click Approve to approve the selected updates or Decline to decline the selected updates.
The default value is Undefined.
The updates to which you assign Approved status are placed in a queue for installation.
The updates to which you assign Declined status are uninstalled (if possible) from all devices on which they were previously installed. Also, they will not be installed on other devices in future.
Some updates for Kaspersky applications cannot be uninstalled. If you set Declined status for them, Open Single Management Platform will not uninstall these updates from the devices on which they were previously installed. However, these updates will never be installed on other devices in future.
If you set Declined status for third-party software updates, these updates will not be installed on devices for which they were planned but have not yet been installed. Updates will remain on devices on which they were already installed. If you have to delete the updates, you can manually delete them locally.
Automatic installation of updates for Kaspersky Endpoint Security for Windows
You can configure automatic updates of databases and software modules of Kaspersky Endpoint Security for Windows on client devices.
To configure download and automatic installation of updates of Kaspersky Endpoint Security for Windows on devices:
- In the main menu, go to Assets (Devices) → Tasks.
- Click the Add button.
The New task wizard starts. Follow the steps of the wizard.
- For the Kaspersky Endpoint Security for Windows application, select Update as the task subtype.
- Specify the name for the task that you are creating. A task name cannot be more than 100 characters long and cannot include any special characters ("*<>?\:|).
- Choose the task scope.
- Specify the administration group, the device selection, or the devices to which the task applies.
- At the Finish task creation step, if you want to modify the default task settings, enable the Open task details when creation is complete option. If you do not enable this option, the task is created with the default settings. You can modify the default settings later, at any time.
- Click the Create button.
The task is created and displayed in the list of tasks.
- Click the name of the created task to open the task properties window.
- On the Application settings tab of the task properties window, define the update task settings in local or mobile mode:
- Local mode: Connection is established between the device and the Administration Server.
- Mobile mode: No connection is established between Open Single Management Platform and the device (for example, when the device is not connected to the internet).
- Enable the update sources that you want to use to update databases and application modules for Kaspersky Endpoint Security for Windows. If required, change positions of the sources in the list by using the Move up and Move down buttons. If several update sources are enabled, Kaspersky Endpoint Security for Windows tries to connect to them one after another, starting from the top of the list, and performs the update task by retrieving the update package from the first available source.
- Enable the Install approved application module updates option to download and install software module updates together with the application databases.
If the option is enabled, Kaspersky Endpoint Security for Windows notifies the user about available software module updates and includes software module updates in the update package when running the update task. Kaspersky Endpoint Security for Windows installs only those updates for which you have set the Approved status; they will be installed locally through the application interface or through Open Single Management Platform.
You can also enable the Automatically install critical application module updates option. If any updates are available for software modules, Kaspersky Endpoint Security for Windows automatically installs those that have Critical status; the remaining updates will be installed after you approve them.
If updating the software module requires reviewing and accepting the terms of the License Agreement and Privacy Policy, the application installs updates after the terms of the License Agreement and Privacy Policy have been accepted by the user.
- Select the Copy updates to folder check box in order for the application to save downloaded updates to a folder, and then specify the folder path.
- Schedule the task. To ensure timely updates, we recommend that you select the When new updates are downloaded to the repository option.
- Click Save.
When the Update task is running, the application sends requests to Kaspersky update servers.
Some updates require installation of the latest versions of management plug-ins.
About using diff files for updating Kaspersky databases and software modules
When Open Single Management Platform downloads updates from Kaspersky update servers, it optimizes traffic by using diff files. You can also enable the usage of diff files by devices (Administration Servers, distribution points, and client devices) that take updates from other devices on your network.
About the Downloading diff files feature
A diff file describes the differences between two versions of a file of a database or software module. The usage of diff files saves traffic inside your company's network because diff files occupy less space than entire files of databases and software modules. If the Downloading diff files feature is enabled on Administration Server or a distribution point, the diff files are saved on this Administration Server or distribution point. As a result, devices that take updates from this Administration Server or distribution point can use the saved diff files to update their databases and software modules.
To optimize the usage of diff files, we recommend that you synchronize the update schedule of devices with the update schedule of the Administration Server or distribution point from which the devices take updates. However, the traffic can be saved even if devices are updated several times less often than are the Administration Server or distribution point from which the devices take updates.
Distribution points do not use IP multicasting for automatic distribution of diff files.
Enabling the Downloading diff files feature
Stages
- Enabling the feature on Administration Server
Enable the feature in the settings of a Download updates to the repository of the Administration Server task.
- Enabling the feature for a distribution point
Enable the feature for a distribution point that receives updates by means of a Download updates to the repositories of distribution points task.
Then enable the feature in the Network Agent policy settings for a distribution point that receives updates from Administration Server.
Then enable the feature for a distribution point that receives updates from Administration Server.
The feature is enabled in the Network Agent policy settings and—if the distribution points are assigned manually and if you want to override policy settings—in the Distribution points section of the Administration Server properties.
To check that the Downloading diff files feature is successfully enabled, you can measure the internal traffic before and after you perform the scenario.
Downloading updates by distribution points
Open Single Management Platform allows distribution points to receive updates from the Administration Server, Kaspersky servers, or from a local or network folder.
To configure update download for a distribution point:
- In the main menu, click the settings icon () next to the name of the required Administration Server.
The Administration Server properties window opens.
- On the General tab, select the Distribution points section.
- Click the name of the distribution point through which updates will be delivered to client devices in the group.
- In the distribution point properties window, select the Source of updates section.
- Select an update source for the distribution point:
The distribution point will receive updates from the specified source.
Updating Kaspersky databases and software modules on offline devices
Updating Kaspersky databases and software modules on managed devices is an important task for maintaining protection of the devices against viruses and other threats. Administrators usually configure regular updates through usage of the Administration Server repository.
When you need to update databases and software modules on a device (or a group of devices) that is not connected to the Administration Server (primary or secondary), a distribution point or the internet, you have to use alternative sources of updates, such as an FTP server or a local folder. In this case, you have to deliver the files of the required updates by using a mass storage device, such as a flash drive or an external hard drive.
You can copy the required updates from:
- The Administration Server.
To be sure the Administration Server repository contains the updates required for the security application installed on an offline device, at least one of the managed online devices must have the same security application installed. This application must be configured to receive the updates from the Administration Server repository through the Download updates to the Administration Server repository task.
- Any device that has the same security application installed and configured to receive the updates from the Administration Server repository, a distribution point repository, or directly from the Kaspersky update servers.
Below is an example of configuring updates of databases and software modules by copying them from the Administration Server repository.
To update Kaspersky databases and software modules on offline devices:
- Connect the removable drive to the device where the Administration Server is installed.
- Copy the updates files to the removable drive.
By default, the updates are located at: \\<server name>\KLSHARE\Updates.
Alternatively, you can configure Open Single Management Platform to regularly copy the updates to the folder that you select. For this purpose, use the Copy downloaded updates to additional folders option in the properties of the Download updates to the Administration Server repository task. If you specify a folder located on a flash drive or an external hard drive as a destination folder for this option, this mass storage device will always contain the latest version of the updates.
- On offline devices, configure Kaspersky Endpoint Security to receive updates from a local folder or a shared resource, such as an FTP server or a shared folder.
How-to instructions:
- Copy the updates files from the removable drive to the local folder or the shared resource that you want to use as an update source.
- On the offline device that requires update installation, start the Update task of Kaspersky Endpoint Security for Linux or Kaspersky Endpoint Security for Windows, depending on the operating system of the offline device.
After the update task is complete, the Kaspersky databases and software modules are up-to-date on the device.
Remote diagnostics of client devices
You can use remote diagnostics for remote execution of the following operations on Windows-based and Linux-based client devices:
- Enabling and disabling tracing, changing the tracing level, and downloading the trace file
- Downloading system information and application settings
- Downloading event logs
- Generating a dump file for an application
- Starting diagnostics and downloading diagnostics reports
- Starting, stopping, and restarting applications
You can use event logs and diagnostics reports downloaded from a client device to troubleshoot problems on your own. Also, if you contact Kaspersky Technical Support, a Technical Support specialist might ask you to download trace files, dump files, event logs, and diagnostics reports from a client device for further analysis at Kaspersky.
Opening the remote diagnostics window
To perform remote diagnostics on Windows-based and Linux-based client devices, you first have to open the remote diagnostics window.
To open the remote diagnostics window:
- To select the device for which you want to open the remote diagnostics window, perform one of the following:
- If the device belongs to an administration group, in the main menu, go to Assets (Devices) → Managed devices.
- If the device belongs to the Unassigned devices group, in the main menu, go to Discovery & deployment → Unassigned devices.
- Click the name of the required device.
- In the device properties window that opens, select the Advanced tab.
- In the window that opens, click Remote diagnostics.
This opens the Remote diagnostics window of a client device. If connection between Administration Server and the client device is not established, the error message displays.
Alternatively, if you need to obtain all diagnostic information about a Linux-based client device at once, you can run the collect.sh script on this device.
Enabling and disabling tracing for applications
You can enable and disable tracing for applications, including Xperf tracing.
Enabling and disabling tracing
To enable or disable tracing on a remote device:
- Open the remote diagnostics window of a client device.
- In the remote diagnostics window, select the Kaspersky applications tab.
In the Application management section, the list of Kaspersky applications installed on the device displays.
- In the list of applications, select the application for which you want to enable or disable tracing.
The list of remote diagnostics options opens.
- If you want to enable tracing:
- In the Tracing section, click Enable tracing.
- In the Modify tracing level window that opens, we recommend that you keep the default values of the settings. When required, a Technical Support specialist will guide you through the configuration process. The following settings are available:
- Tracing level
- Rotation-based tracing
This setting is available for Kaspersky Endpoint Security only.
- Click Save.
The tracing is enabled for the selected application. In some cases, the security application and its task must be restarted in order to enable tracing.
On Linux-based client devices, tracing for the Updater of Network Agent component is regulated by the Network Agent settings. Therefore, the Enable tracing and Modify tracing level options are disabled for this component on client devices running Linux.
- If you want to disable tracing for the selected application, click the Disable tracing button.
The tracing is disabled for the selected application.
Enabling Xperf tracing
For Kaspersky Endpoint Security, a Technical Support specialist may ask you to enable Xperf tracing for information about the system performance.
To enable and configure Xperf tracing or disable it:
- Open the remote diagnostics window of a client device.
- In the remote diagnostics window, select the Kaspersky applications tab.
In the Application management section, the list of Kaspersky applications installed on the device displays.
- In the list of applications, select Kaspersky Endpoint Security for Windows.
The list of remote diagnostics options for Kaspersky Endpoint Security for Windows displays.
- In the Xperf tracing section, click Enable Xperf tracing.
If Xperf tracing is already enabled, the Disable Xperf tracing button is displayed instead. Click this button if you want to disable Xperf tracing for Kaspersky Endpoint Security for Windows.
- In the Change Xperf tracing level window that opens, depending on the request from the Technical Support specialist, do the following:
- Select one of the following tracing levels:
- Select one of the following Xperf tracing types:
You may also be asked to enable the Rotation file size, in MB option to prevent excessive increase in the size of the trace file. Then specify the maximum size of the trace file. When the file reaches the maximum size, the oldest tracing information is overwritten with new information.
- Define the rotation file size.
- Click Save.
Xperf tracing is enabled and configured.
- If you want to disable Xperf tracing for Kaspersky Endpoint Security for Windows, click Disable Xperf tracing in the Xperf tracing section.
Xperf tracing is disabled.
Downloading trace files of an application
To download a trace file of an application:
- Open the remote diagnostics window of a client device.
- In the remote diagnostics window, select the Kaspersky applications tab.
In the Application management section, the list of Kaspersky applications installed on the device displays.
- In the list of applications, select the application for which you want to download a trace file.
- In the Tracing section, click the Trace files button.
This opens the Device tracing logs window, where a list of trace files is displayed.
- In the list of trace files, select the file that you want to download.
- Do one of the following:
- Download the selected file by clicking Download. You can select one or several files for downloading.
- Download a portion of the selected file:
- Click Download a portion.
You cannot download portions of several files at the same time. If you select more than one trace file, the Download a portion button will be disabled.
- In the window that opens, specify the name and the file portion to download, according to your needs.
For Linux-based devices, editing the file portion name is not available.
- Click Download.
- Click Download a portion.
The selected file, or its portion, is downloaded to the location that you specify.
Page top
Deleting trace files
You can delete trace files that are no longer needed.
To delete a trace file:
- Open the remote diagnostics window of a client device.
- In the remote diagnostics window that opens, select the Event logs tab.
- In the Trace files section, click Windows Update logs or Remote installation logs, depending on which trace files you want to delete.
The Windows Update logs link is available only for Windows-based client devices.
This opens the Device tracing logs window, where a list of trace files is displayed.
- In the list of trace files, select one or several files that you want to delete.
- Click the Remove button.
The selected trace files are deleted.
Page top
Downloading application settings
To download application settings from a client device:
- Open the remote diagnostics window of a client device.
- In the remote diagnostics window, select the Kaspersky applications tab.
- In the Application settings section, click the Download button to download information about the settings of the applications installed on the client device.
The ZIP archive with information is downloaded to the specified location.
Page top
Downloading system information from a client device
To download system information from a client device:
- Open the remote diagnostics window of a client device.
- In the remote diagnostics window, select the System information tab.
- Click the Download button to download the system information about the client device.
If you obtain system information about a Linux-based device, a dump file for emergency terminated applications is added to the resulting file.
The file with information is downloaded to the specified location.
Page top
Downloading event logs
To download an event log from a remote device:
- Open the remote diagnostics window of a client device.
- In the remote diagnostics window, on the Event logs tab, click All device logs.
- In the All device logs window, select one or several relevant logs.
- Do one of the following:
- Download the selected log by clicking Download entire file.
- Download a portion of the selected log:
- Click Download a portion.
You cannot download portions of several logs at the same time. If you select more than one event log, the Download a portion button will be disabled.
- In the window that opens, specify the name and the log portion to download, according to your needs.
For Linux-based devices, editing the log portion name is not available.
- Click Download.
- Click Download a portion.
The selected event log, or a portion of it, is downloaded to the specified location.
Page top
Starting, stopping, restarting the application
You can start, stop, and restart applications on a client device.
To start, stop, or restart an application:
- Open the remote diagnostics window of a client device.
- In the remote diagnostics window, select the Kaspersky applications tab.
In the Application management section, the list of Kaspersky applications installed on the device displays.
- In the list of applications, select the application that you want to start, stop, or restart.
- Select an action by clicking one of the following buttons:
- Stop application
This button is available only if the application is currently running.
- Restart application
This button is available only if the application is currently running.
- Start application
This button is available only if the application is not currently running.
Depending on the action that you have selected, the required application is started, stopped, or restarted on the client device.
- Stop application
If you restart the Network Agent, a message is displayed stating that the current connection of the device to the Administration Server will be lost.
Page top
Running the remote diagnostics of Kaspersky Security Center Network Agent and downloading the results
To start diagnostics for Kaspersky Security Center Network Agent on a remote device and download the results:
- Open the remote diagnostics window of a client device.
- In the remote diagnostics window, select the Kaspersky applications tab.
In the Application management section, the list of Kaspersky applications installed on the device displays.
- In the list of applications, select Kaspersky Security Center Network Agent.
The list of remote diagnostics options opens.
- In the Diagnostics report section, click the Run diagnostics button.
This starts the remote diagnostics process and generates a diagnostics report. When the diagnostics process is complete, the Download diagnostics report button becomes available.
- Click the Download diagnostics report button to download the report.
The report is downloaded to the specified location.
Page top
Running an application on a client device
You may have to run an application on the client device, if a Kaspersky support specialist requests it. You do not have to install the application on that device.
To run an application on the client device:
- Open the remote diagnostics window of a client device.
- In the remote diagnostics window, select the Running a remote application tab.
- In the Application files section, click the Browse button to select a ZIP archive containing the application that you want to run on the client device.
The ZIP archive must include the utility folder. This folder contains the executable file to be run on a remote device.
You can specify the executable file name and the command-line arguments, if necessary. To do this, fill in the Executable file in an archive to be run on a remote device and Command-line arguments fields.
- Click the Upload and run button to run the specified application on a client device.
- Follow the instructions of the Kaspersky support specialist.
Generating a dump file for an application
An application dump file allows you to view the parameters of the application running on a client device at a point in time. This file also contains information about modules that were loaded for an application.
Obtaining dump files from Linux-based devices is not supported.
To obtain dump files through remote diagnostics, the kldumper utility is used. This utility is designed to obtain the dump files of processes of Kaspersky applications at the request of technical support specialists. Detailed information on the requirements for using the kldumper utility is provided in the Open Single Management Platform Knowledge Base.
To create a dump file for an application:
- Open the remote diagnostics window of a client device.
- In the remote diagnostics window, select the Running a remote application tab.
- In the Generating the process dump file section, specify the executable file of the application for which you want to generate a dump file.
- Click the Download dump file button.
An archive with the dump file for the specified application is downloaded.
If the specified application is not running on the client device, the "result" folder contained in the downloaded archive will be empty.
If the specified application is running, but the downloading fails with an error or the "result" folder contained in the downloaded archive is empty, refer to the Open Single Management Platform Knowledge Base.
Running remote diagnostics on a Linux-based client device
Open Single Management Platform allows you to download the basic diagnostic information from a client device. Alternatively, you can obtain the diagnostic information about a Linux-based device by using the collect.sh script by Kaspersky. This script is run on the Linux-based client device that needs to be diagnosed, and then it generates a file with the diagnostic information, the system information about this device, trace files of applications, device logs, and a dump file for emergency-terminated applications.
We recommend that you use the collect.sh script to obtain all diagnostic information about the Linux-based client device at once. If you download the diagnostic information remotely through Open Single Management Platform, you will need to go through all sections of the remote diagnostics interface. Also the diagnostic information for a Linux-based device will probably not be obtained completely.
If you need to send the generated file with the diagnostic information to the Kaspersky Technical Support, delete all confidential information before sending the file.
To download the diagnostic information from a Linux-based client device by using the collect.sh script:
- Download the collect.sh script packed in the collect.tar.gz archive.
- Copy the downloaded archive to the Linux-based client device that needs to be diagnosed.
- Run the following command to unpack the collect.tar.gz archive:
# tar -xzf collect.tar.gz - Run the following command to specify the script execution rights:
# chmod +x collect.sh - Run the collect.sh script by using an account with administrator rights:
# ./collect.sh
A file with the diagnostic information is generated and saved to the /tmp/$HOST_NAME-collect.tar.gz folder.
Page top
Managing third-party applications and executable files on client devices
This section describes the features of Open Single Management Platform related to the management of third-party applications and executable files run on client devices.
Using Application Control to manage executable files
You can use the Application Control component to allow or block startup of executable files on user devices. The Application Control component supports Windows-based and Linux-based operating systems.
For Linux-based operating systems, Application Control component is available starting from Kaspersky Endpoint Security 11.2 for Linux.
Prerequisites
- Open Single Management Platform is deployed in your organization.
- The policy of Kaspersky Endpoint Security for Linux or Kaspersky Endpoint Security for Windows is created and is active. The Application Control component is enabled in the policy.
Stages
The Application Control usage scenario proceeds in stages:
- Forming and viewing the list of executable files on client devices
This stage helps you find out what executable files are found on managed devices. View the list of executable files and compare it with the lists of allowed and prohibited executable files. The restrictions on executable files usage can be related to the information security polices in your organization.
How-to instructions: Obtaining and viewing a list of executable files stored on client devices
- Creating categories for executable files used in your organization
Analyze the lists of executable files stored on managed devices. Based on the analysis, create categories for executable files. It is recommended to create a "Work applications" category that covers the standard set of executable files that are used at your organization. If different security groups use their own sets of executable files in their work, a separate category can be created for each security group.
Startup of executable files whose settings do not match any of the Application Control rules is regulated by the selected operating mode of the component:
- Denylist. The mode is used if you want to allow the startup of all executable files except those specified in block rules. This mode is selected by default.
- Allowlist. The mode is used if you want to block the startup of all executable files except those specified in allow rules.
The Application Control rules are implemented through categories for executable files. In Open Single Management Platform there are three types of categories for executable files:
- Category with content added manually. You define conditions, for example, file metadata, file hashcode, file certificate, file path, to include executable files in the category.
- Category that includes executable files from selected devices. You specify a device whose executable files are automatically included in the category.
- Category that includes executable files from selected folder. You specify a folder from which executable files are automatically included in the category.
- Configuring Application Control in the Kaspersky Endpoint Security policy
Configure the Application Control component in Kaspersky Endpoint Security for Linux policy using the categories you have created on the previous stage.
How-to instructions: Configuring Application Control in the Kaspersky Endpoint Security for Windows policy
- Turning on Application Control component in test mode
To ensure that Application Control rules do not block executable files required for user's work, it is recommended to enable testing of Application Control rules and analyze their operation after creating new rules. When testing is enabled, Kaspersky Endpoint Security for Windows will not block executable files whose startup is forbidden by Application Control rules, but will instead send notifications about their startup to the Administration Server.
When testing Application Control rules, it is recommended to perform the following actions:
- Determine the testing period. Testing period can vary from several days to two months.
- Examine the events resulting from testing the operation of Application Control.
How-to instructions for OSMP Console: Configuring Application Control component in the Kaspersky Endpoint Security for Windows policy. Follow this instruction and enable the Test Mode option in configuration process.
- Changing the settings of Application Control component
If necessary, make changes to the Application Control settings. Based on the test results, you can add executable files related to events of the Application Control component to a category with content added manually.
How-to instructions: OSMP Console: Adding event-related executable files to the application category
- Applying the rules of Application Control in operation mode
After Application Control rules are tested and configuration of categories is complete, you can apply the rules of Application Control in operation mode.
How-to instructions for OSMP Console: Configuring Application Control component in the Kaspersky Endpoint Security for Windows policy. Follow this instruction and disable the Test Mode option in configuration process.
- Verifying Application Control configuration
Be sure that you have done the following:
- Created categories for executable files.
- Configured Application Control using the categories.
- Applied the rules of Application Control in operation mode.
Results
When the scenario is complete, startup of executable files on managed devices is controlled. The users can run only those executable files that are allowed in your organization and cannot run executable files that are prohibited in your organization.
For detailed information about Application Control, refer to the Kaspersky Endpoint Security for Linux Help and Kaspersky Endpoint Security for Windows Help.
Page top
Application Control modes and categories
The Application Control component monitors users' attempts to start executable files. You can use Application Control rules to control the startup of executable files.
Application Control component is available for Kaspersky Endpoint Security 11.2 for Linux and later versions.
Startup of executable files whose settings do not match any of the Application Control rules is regulated by the selected operating mode of the component:
- Denylist. The mode is used if you want to allow the startup of all executable files except those specified in block rules. This mode is selected by default.
- Allowlist. The mode is used if you want to block the startup of all executable files except those specified in allow rules.
The Application Control rules are implemented through categories for executable files. In Open Single Management Platform there are three types of categories:
- Category with content added manually. You define conditions, for example, file metadata, file hashcode, file certificate, file path, to include executable files in the category.
- Category that includes executable files from selected devices. You specify a device whose executable files are automatically included in the category.
- Category that includes executable files from selected folder. You specify a folder from which executable files are automatically included in the category.
For detailed information about Application Control, refer to the Kaspersky Endpoint Security for Linux Help and Kaspersky Endpoint Security for Windows Help.
Page top
Obtaining and viewing a list of applications installed on client devices
Open Single Management Platform inventories all software installed on managed client devices running Linux and Windows.
Network Agent compiles a list of applications installed on a device, and then transmits this list to Administration Server. It takes about 10-15 minutes for the Network Agent to update the application list.
For Windows-based client devices, Network Agent receives most of the information about installed applications from the Windows registry. For Linux-based client devices, package managers provide information about installed applications to Network Agent.
To view the list of applications installed on managed devices:
- In the main menu, go to Operations → Third-party applications → Applications registry.
The page displays a table with the applications that are installed on managed devices. Select the application to view its properties, for example, vendor name, version number, list of executable files, list of devices on which the application is installed, list of available software updates, and list of detected software vulnerabilities.
- You can group and filter the data of the table with installed applications as follows:
- Click the settings icon () in the upper-right corner of the table.
In the invoked Columns settings menu, select the columns to be displayed in the table. To view the operating system type of the client devices on which the application is installed, select the Operating system type column.
- Click the filter icon () in the upper-right corner of the table, and then specify and apply the filter criterion in the invoked menu.
The filtered table of installed applications is displayed.
- Click the settings icon (
To view the list of applications installed on a specific managed device,
In the main menu, go to Devices → Managed devices → <device name> → Advanced → Applications registry. In this menu, you can export the list of applications to a CSV file or TXT file.
For detailed information about Application Control, refer to the Kaspersky Endpoint Security for Linux Help and Kaspersky Endpoint Security for Windows Help.
Obtaining and viewing a list of executable files stored on client devices
You can obtain the list of executable files stored on client devices in one of the following ways:
- Enabling notifications about applications startup in Kaspersky Endpoint Security policy.
- Creating an inventory task.
Enabling notifications about applications startup in Kaspersky Endpoint Security policy
To enable notifications about applications startup:
- Open the Kaspersky Endpoint Security policy settings, and then go to General settings → Reports and Storage.
- In the Data transfer to Administration Server settings group, select the About started applications check box, and save the changes.
When a user attempts to start executable files, information about these files is added to the list of executable files on a client device. Kaspersky Endpoint Security sends this information to Network Agent, and then Network Agent sends it to Administration Server.
Creating an inventory task
For Kaspersky Endpoint Security for Linux, the feature of inventorying executable files is available since no earlier that version 11.2.
You can reduce load on the database while obtaining information about the installed applications. To save database space, run an inventory task on reference devices on which a standard set of software is installed. The preferable number of devices is 1-3.
To create an inventory task for executable files on client devices:
- In the main menu, go to Assets (Devices) → Tasks.
The list of tasks is displayed.
- Click the Add button.
The New task wizard starts. Follow the steps of the wizard.
- On the New task settings page, from the Application drop-down list, select Kaspersky Endpoint Security for Linux or Kaspersky Endpoint Security for Windows, depending on the operating system of the client devices.
- From the Task type drop-down list, select Inventory.
- On the Finish task creation page, click the Finish button.
After the New task wizard has finished, the Inventory task is created and configured. If you want, you can change the settings for the created task. The newly created task is displayed in the list of tasks.
For a detailed description of the inventory task, see the Kaspersky Endpoint Security for Linux Help and the Kaspersky Endpoint Security for Windows Help.
After the Inventory task is performed, the list of executable files stored on managed devices is formed, and you can view the list.
During inventory, executable files in the following formats can be detected (depending on the option that you select in the inventory task properties): MZ, COM, PE, NE, SYS, CMD, BAT, PS1, JS, VBS, REG, MSI, CPL, DLL, JAR, and HTML.
Viewing the list of executable files stored on managed devices
To view the list of executable files stored on client devices:
In the main menu, go to Operations → Third-party applications → Executable files.
The page displays the list of executable files stored on client devices.
If necessary, you can send the executable file of the managed device to the device where your OSMP Console is open.
To send an executable file:
- In the main menu, go to Operations → Third-party applications → Executable files.
- Click the link of the executable file that you want to send.
- In the window that opens, go to the Devices section, and then select the check box of the managed device from which you want to send the executable file.
Before you send the executable file, make sure that the managed device has a direct connection to the Administration Server, by selecting the Do not disconnect from the Administration Server check box.
- Click the Send button.
The selected executable file is downloaded for further sending to the device where your OSMP Console is open.
Creating an application category with content added manually
You can specify a set of criteria as a template of executable files for which you want to allow or block a start in your organization. On the basis of executable files corresponding to the criteria, you can create an application category and use it in the Application Control component configuration.
To create an application category with content added manually:
- In the main menu, go to Operations → Third-party applications → Application categories.
The page with a list of application categories is displayed.
- Click the Add button.
The New category wizard starts. Proceed through the wizard by using the Next button.
- On the Select category creation method step, specify the application category name and select the Category with content added manually. Data of executable files is manually added to the category option.
- On the Conditions step, click the Add button to add a condition criterion to include files in the creating category.
- On the Condition criteria step, select a rule type for the creation of category from the list:
- From KL category
- Select certificate from repository
- Specify path to application (masks supported)
- Removable drive
- Hash, metadata, or certificate:
The selected criterion is added to the list of conditions.
You can add as many criteria for the creating application category as you need.
- On the Exclusions step, click the Add button to add an exclusive condition criterion to exclude files from the category that is being created.
- On the Condition criteria step, select a rule type from the list, in the same way that you selected a rule type for category creation.
When the wizard finishes, the application category is created. It is displayed in the list of application categories. You can use the created application category when you configure Application Control.
For detailed information about Application Control, refer to the Kaspersky Endpoint Security for Linux Help and Kaspersky Endpoint Security for Windows Help.
Creating an application category that includes executable files from selected devices
You can use executable files from selected devices as a template of executable files that you want to allow or block. Based on executable files from selected devices, you can create an application category and use it in the Application Control component configuration.
Make sure that the following prerequisites are met:
- The Application Control component is enabled in the Kaspersky Endpoint Security policy.
- A list of executable files stored on managed devices has been obtained.
To create application category that includes executable files from selected devices:
- In the main menu, go to Operations → Third-party applications → Application categories.
The page with a list of categories of executable files is displayed.
- Click the Add button.
The New category wizard starts. Proceed through the wizard by using the Next button.
- On the Select category creation method step, specify the category name and select the Category that includes executable files from selected devices. These executable files are processed automatically and their metrics are added to the category option.
- Click Add.
- In the window that opens, select a device or devices whose executable files will be used to create the application category.
- Specify the following settings:
When the wizard finishes, the category of executable files is created. It is displayed in the list of categories. You can use the created category when you configure Application Control.
Creating an application category that includes executable files from selected folder
You can use executable files from a selected folder as a standard of executable files that you want to allow or block in your organization. On the basis of executable files from the selected folder, you can create an application category and use it in the Application Control component configuration.
To create a category that includes executable files from the selected folder:
- In the main menu, go to Operations → Third-party applications → Application categories.
The page with a list of categories is displayed.
- Click the Add button.
The New category wizard starts. Proceed through the wizard by using the Next button.
- On the Select category creation method step, specify the category name and select the Category that includes executable files from a specific folder. Executable files of applications copied to the specified folder are automatically processed and their metrics are added to the category option.
- Specify the folder whose executable files will be used to create the category.
- Define the following settings:
- Include dynamic-link libraries (DLL) in this category
- Include script data in this category
- Hash value computing algorithm: Calculate SHA256 for files in this category (supported by Kaspersky Endpoint Security 10 Service Pack 2 for Windows and later versions) / Calculate MD5 for files in this category (supported by versions earlier than Kaspersky Endpoint Security 10 Service Pack 2 for Windows)
- Force folder scan for changes
When the wizard finishes, the category of executable files is created. It is displayed in the list of categories. You can use the category at Application Control configuration.
For detailed information about Application Control, refer to the Kaspersky Endpoint Security for Linux Help and Kaspersky Endpoint Security for Windows Help.
Viewing the list of application categories
You can view the list of configured categories of executable files and the settings of each category.
To view the list of application categories,
In the main menu, go to Operations → Third-party applications → Application categories.
The page with a list of categories is displayed.
To view properties of an application category,
Click the name of the category.
The properties window of the category is displayed. The properties are grouped on several tabs.
Configuring Application Control in the Kaspersky Endpoint Security for Windows policy
After you create Application Control categories, you can use them for configuring Application Control in Kaspersky Endpoint Security for Windows policies.
To configure Application Control in the Kaspersky Endpoint Security for Windows policy:
- In the main menu, go to Assets (Devices) → Policies & profiles.
A page with a list of policies is displayed.
- Click the Kaspersky Endpoint Security for Windows policy.
The policy settings window opens.
- Go to Application settings → Security Controls → Application Control.
The Application Control window with Application Control settings is displayed.
- The Application Control option is enabled by default. Switch the toggle button Application Control DISABLED to disable the option.
- In the Application Control Settings block settings, enable the operation mode to apply the Application Control rules and allow Kaspersky Endpoint Security for Windows to block startup of applications.
If you want to test the Application Control rules, in the Application Control Settings section, enable the test mode. In the test mode, Kaspersky Endpoint Security for Windows does not block startup of applications, but logs information about triggered rules in the report. Click the View report link to view this information.
- Enable the Control DLL modules load option if you want Kaspersky Endpoint Security for Windows to monitor the loading of DLL modules when applications are started by users.
Information about the module and the application that loaded the module will be saved to a report.
Kaspersky Endpoint Security for Windows monitors only the DLL modules and drivers loaded after the Control DLL modules load option is selected. Restart the device after selecting the Control DLL modules load option if you want Kaspersky Endpoint Security for Windows to monitor all DLL modules and drivers, including those loaded before Kaspersky Endpoint Security for Windows is started.
- (Optional) In the Message templates block, change the template of the message that is displayed when an application is blocked from starting and the template of the email message that is sent to you.
- In the Application Control Mode block settings, select the Denylist or Allowlist mode.
By default, the Denylist mode is selected.
- Click the Rules Lists Settings link.
The Denylists and allowlists window opens to let you add an application category. By default, the Denylist tab is selected if the Denylist mode is selected, and the Allowlist tab is selected if the Allowlist mode is selected.
- In the Denylists and allowlists window, click the Add button.
The Application Control rule window opens.
- Click the Please choose a category link.
The Application Category window opens.
- Add the application category (or categories) that you created earlier.
You can edit the settings of a created category by clicking the Edit button.
You can create a new category by clicking the Add button.
You can delete a category from the list by clicking the Delete button.
- After the list of application categories is complete, click the OK button.
The Application Category window closes.
- In the Application Control rule window, in the Subjects and their rights section, create a list of users and groups of users to apply the Application Control rule.
- Click the OK button to save the settings and to close the Application Control rule window.
- Click the OK button to save the settings and to close the Denylists and allowlists window.
- Click the OK button to save the settings and to close the Application Control window.
- Close the window with the Kaspersky Endpoint Security for Windows policy settings.
Application Control is configured. After the policy is propagated to the client devices, the startup of executable files is managed.
For detailed information about Application Control, refer to the Kaspersky Endpoint Security for Linux Help and Kaspersky Endpoint Security for Windows Help.
Adding event-related executable files to the application category
After you configure Application Control in the Kaspersky Endpoint Security policies, the following events will be displayed in the list of events:
- Application startup prohibited (Critical event). This event is displayed if you have configured Application Control to apply rules.
- Application startup prohibited in test mode (Info event). This event is displayed if you have configured Application Control to test rules.
- Message to administrator about application startup prohibition (Warning event). This event is displayed if you have configured Application Control to apply rules and a user has requested access to the application that is blocked at startup.
It is recommended to create event selections to view events related to Application Control operation.
You can add executable files related to Application Control events to an existing application category or to a new application category. You can add executable files only to an application category with content added manually.
To add executable files related to Application Control events to an application category:
- In the main menu, go to Monitoring & reporting → Event selections.
The list of event selections is displayed.
- Select the event selection to view events related to Application Control and start this event selection.
If you have not created event selection related to Application Control, you can select and start a predefined selection, for example, Recent events.
The list of events is displayed.
- Select the events whose associated executable files you want to add to the application category, and then click the Assign to category button.
The New category wizard starts. Proceed through the wizard by using the Next button.
- On the wizard page, specify the relevant settings:
- In the Action on executable file related to the event section, select one of the following options:
- In the Rule type section, select one of the following options:
- Rules for adding to inclusions
- Rules for adding to exclusions
- In the Parameter used as a condition section, select one of the following options:
- Click OK.
When the wizard finishes, executable files related to the Application Control events are added to the existing application category or to a new application category. You can view settings of the application category that you have modified or created.
For detailed information about Application Control, refer to the Kaspersky Endpoint Security for Linux Help and Kaspersky Endpoint Security for Windows Help.
About the license
A license is a time-limited right to use Open Single Management Platform, granted under the terms of the signed License Contract (End User License Agreement).
The scope of services and validity period depend on the license under which the application is used.
The following license types are provided:
- Trial
A free license intended for trying out the application. A trial license usually has a short term.
When a trial license expires, all Open Single Management Platform features become disabled. To continue using the application, you need to purchase a commercial license.
You can use the application under a trial license for only one trial period.
- Commercial
A paid license.
When a commercial license expires, key features of the application become disabled. To continue using Open Single Management Platform, you must renew your commercial license. After a commercial license expires, you cannot continue using the application and must remove it from your device.
We recommend renewing your license before it expires, to ensure uninterrupted protection against all security threats.
Monitoring, reporting, and audit
This section describes the monitoring and reporting capabilities of Open Single Management Platform. These capabilities give you an overview of your infrastructure, protection statuses, and statistics.
After Open Single Management Platform deployment or during the operation, you can configure the monitoring and reporting features to best suit your needs.
Scenario: Monitoring and reporting
This section provides a scenario for configuring the monitoring and reporting feature in Open Single Management Platform.
Prerequisites
After you deploy Open Single Management Platform in an organization's network, you can start to monitor it and generate reports on its functioning.
Monitoring and reporting in an organization's network proceeds in stages:
- Configuring the switching of device statuses
Get acquainted with the settings for device statuses depending on specific conditions. By changing these settings, you can change the number of events with Critical or Warning importance levels. When configuring the switching of device statuses, be sure of the following:
- New settings do not conflict with the information security policies of your organization.
- You are able to react to important security events in your organization's network in a timely manner.
- Configuring notifications about events on client devices
How-to instructions:
- Performing recommended actions for Critical and Warning notifications
How-to instructions:
- Reviewing the security status of your organization's network
How-to instructions:
- Locating client devices that are not protected
How-to instructions:
- Checking protection of client devices
How-to instructions:
- Evaluating and limiting the event load on the database
Information about events that occur during operation of managed applications is transferred from a client device and registered in the Administration Server database. To reduce the load on the Administration Server, evaluate and limit the maximum number of events that can be stored in the database.
How-to instructions:
- Reviewing license information
How-to instructions:
Results
Upon completion of the scenario, you are informed about protection of your organization's network and, thus, can plan actions for further protection.
Page top
About types of monitoring and reporting
Information on security events in an organization's network is stored in the Administration Server database. Based on the events, OSMP Console provides the following types of monitoring and reporting in your organization's network:
- Dashboard
- Reports
- Event selections
- Notifications
Dashboard
The dashboard allows you to monitor security trends on your organization's network by providing you with a graphical display of information.
Reports
The Reports feature allows you to get detailed numerical information about the security of your organization's network, save this information to a file, send it by email, and print it.
Event selections
Event selections provide an onscreen view of named sets of events that are selected from the Administration Server database. These sets of events are grouped according to the following categories:
- By importance level—Critical events, Functional failures, Warnings, and Info events
- By time—Recent events
- By type—User requests and Audit events
You can create and view user-defined event selections based on the settings available, in the OSMP Console interface, for configuration.
Notifications
Notifications alert you about events and help you to speed up your responses to these events by performing recommended actions or actions you consider as appropriate.
Page top
Triggering of rules in Smart Training mode
This section provides information about the detections performed by the Adaptive Anomaly Control rules in Kaspersky Endpoint Security for Windows on client devices.
The rules detect anomalous behavior on client devices and may block it. If the rules work in Smart Training mode, they detect anomalous behavior and send reports about every such occurrence to Administration Server. You can view the reports about detected anomalous behavior in Operations → Repositories → Rule triggers in Smart Training state. You can confirm detections as correct or add them as exclusions, so that this type of behavior is not considered anomalous anymore.
Information about detections is stored in the event log on the Administration Server (along with other events) and in the Adaptive Anomaly Control report.
For more information about Adaptive Anomaly Control, the rules, their modes and statuses, refer to Kaspersky Endpoint Security for Windows Help.
Viewing and confirming detections performed using Adaptive Anomaly Control rules
To view the list of detections performed by Adaptive Anomaly Control rules:
- In the main menu, go to Operations → Repositories → Rule triggers in Smart Training state.
The list displays the following information about detections performed using Adaptive Anomaly Control rules:
To view the properties of a detection:
- In the main menu, go to Operations → Repositories → Rule triggers in Smart Training state.
- Do one of the following:
- In the Name column, click the link with the name of the detection you want to view.
- In the list of detections, select the check box next to the detection you want to view, and then click the Properties button.
The properties window of the selected detection opens, displaying information about it.
You can confirm any detection from the list of detections of Adaptive Anomaly Control rules or from the properties window of a selected detection.
To confirm a detection:
- Select one or several detections in the list of detections, and then click the Confirm button.
- Open the properties window of a selected detection, and then click the Confirm button.
The status of the detection is changed to Confirming. The detection will disappear from the list of detections after the next synchronization of the client device with the Administration Server.
Your confirmation will contribute to the statistics used by the rules. For more information, refer to Kaspersky Endpoint Security for Windows Help.
Page top
Adding exclusions from the Adaptive Anomaly Control rules
The Add to Adaptive Anomaly Control exclusions wizard allows you to add exclusions from the Adaptive Anomaly Control rules for Kaspersky Endpoint Security.
To add exclusions from the Adaptive Anomaly Control rules by using the wizard:
- Start the wizard in one of the following ways:
- In the main menu, go to Operations → Repositories → Rule triggers in Smart Training state, select one or several detections, and then click the Exclude button.
You can add up to 1000 exclusions at a time.
Before adding a detection to exclusions, you can view the properties of the detection by clicking the detection name or the Properties button. In the detection properties window that opens, you can also click the Exclude button.
- In the main menu, go to Monitoring & reporting → Event selections, click the link with the event selection you need, select the check box next to the detection you want to exclude, and then click the Exclude from Adaptive Anomaly Control button.
The Add to Adaptive Anomaly Control exclusions wizard starts. Proceed through the wizard by using the Next button.
- In the main menu, go to Operations → Repositories → Rule triggers in Smart Training state, select one or several detections, and then click the Exclude button.
- Select the policies and profiles to which you want to add exclusions.
Inherited policies cannot be updated. If you do not have the rights to modify a policy, the policy will not be updated.
- Click Done to close the wizard.
The status of the detection is changed to Excluding. The detection disappears from the list of detections after the next synchronization of the client device with the Administration Server. The exclusion from the Adaptive Anomaly Control rules is configured and applied.
Page top
Dashboard and widgets
This section contains information about the dashboard and the widgets that the dashboard provides. The section includes instructions on how to manage widgets and configure widget settings.
Using the dashboard
The dashboard allows you to monitor security trends on your organization's network by providing you with a graphical display of information.
The dashboard is available in the OSMP Console, in the Monitoring & reporting → Dashboard section.
The dashboard provides widgets that can be customized. You can choose a large number of different widgets, presented as pie charts or donut charts, tables, graphs, bar charts, and lists. The information displayed in the widgets is automatically updated, the update period is from one to two minutes. The interval between updates varies for different widgets. You can refresh data on a widget manually at any time by using the settings menu.
The dashboard includes the Administration and protection and Detection and response tabs, to which you can add widgets.
The Administration and protection tab
The Administration and protection tab can contain widgets that display information about all events stored in the database of Administration Server.
In the Administration and protection tab, the widgets of the following groups are available:
- Protection status
- Deployment
- Updating
- Threat statistics
- Other
The Detection and response tab
The Detection and response tab can contain widgets that display information about detected and registered alerts and incidents, and the response actions to them. You can view data only for those tenants to which you have access.
In the Detection and response tab, the widgets of the following groups are available:
- Events
- Active lists
- Alerts
- Assets
- Incidents
- Event sources
- Users
- Playbooks
Administration and protection widgets
When configuring the Administration and protection tab of the dashboard, you can add widgets, hide widgets, change the size or appearance of widgets, move widgets, and change their settings.
Some widgets have text information with links. You can view detailed information by clicking the link.
The following widget groups and widgets are available on the Administration and protection tab of the dashboard:
- Protection status
The group includes the following widgets:
- History of software vulnerabilities
- Number of vulnerable devices
- Distribution of devices by severity level of vulnerabilities
- Status of selected device
- Protection status
- Deployment
This group includes the New devices widget.
- Updating
This group includes the following widgets:
- Statistics about Windows Update updates
- Distribution of anti-virus databases
- Active alerts
- Statistics of update installation results by update category
- Statistics of update installation statuses by update category
- Statistics of update installation statuses
- Threat statistics
This group includes the following widgets:
- Detection of threats by a specified application component distributed by disinfection result
- Detection of threats by application components
- Prohibited applications
- Types of network attacks
- Types of detected viruses and disinfection results
- Quarantine history
- History of detection of probably infected objects
- History of network attacks
- History of threat activity sorted by application type
- Threat activity
- Users of the 10 most heavily infected devices
- Most heavily infected devices
- Virtual Administration Servers infected most frequently
- Most frequent threats
- Windows domains infected most frequently
- Groups infected most frequently
- Alerts
- Other
This group includes the following widgets:
- License key usage
- Notifications by selected severity level
- Top 10 most frequent events in database
- Current status of selected Administration Server task
- Task history
Adding widgets to the dashboard
To add widgets to the dashboard:
- In the main menu, go to Monitoring & reporting → Dashboard.
- Click the Add or restore web widget button.
- In the list of available widgets, select the widgets that you want to add to the dashboard.
Widgets are grouped by category. To view the list of widgets included in a category, click the chevron icon (
) next to the category name. - Click the Add button.
The selected widgets are added at the end of the dashboard.
You can now edit the representation and parameters of the added widgets.
Hiding a widget from the dashboard
To hide a displayed widget from the dashboard:
- In the main menu, go to Monitoring & reporting → Dashboard.
- Click the settings icon () next to the widget that you want to hide.
- Select Hide web widget.
- In the Warning window that opens, click OK.
The selected widget is hidden. Later, you can add this widget to the dashboard again.
Moving a widget on the dashboard
To move a widget on the dashboard:
- In the main menu, go to Monitoring & reporting → Dashboard.
- Click the settings icon () next to the widget that you want to move.
- Select Move.
- Click the place to which you want to move the widget. You can select only another widget.
The places of the selected widgets are swapped.
Changing the widget size or appearance
For widgets that display a graph, you can change its representation—a bar chart or a line chart. For some widgets, you can change their size: compact, medium, or maximum.
To change the widget representation:
- In the main menu, go to Monitoring & reporting → Dashboard.
- Click the settings icon () next to the widget that you want to edit.
- Do one of the following:
- To display the widget as a bar chart, select Chart type: Bars.
- To display the widget as a line chart, select Chart type: Lines.
- To change the area occupied by the widget, select one of the values:
- Compact
- Compact (bar only)
- Medium (donut chart)
- Medium (bar chart)
- Maximum
The representation of the selected widget is changed.
Changing widget settings
To change settings of a widget:
- In the main menu, go to Monitoring & reporting → Dashboard.
- Click the settings icon () next to the widget that you want to change.
- Select Show settings.
- In the widget settings window that opens, change the widget settings as required.
- Click Save to save the changes.
The settings of the selected widget are changed.
The set of settings depends on the specific widget. Below are some of the common settings:
- Web widget scope (the set of objects for which the widget displays information)—for example, an administration group or device selection.
- Select task (the task for which the widget displays information).
- Time interval (the time interval during which the information is displayed in the widget)—between the two specified dates; from the specified date to the current day; or from the current day minus the specified number of days to the current day.
- Set to Critical if these are specified and Set to Warning if these are specified (the rules that determine the color of a traffic light).
After you change the widget settings, you can refresh data on the widget manually.
To refresh data on a widget:
- In the main menu, go to Monitoring & reporting → Dashboard.
- Click the settings icon () next to the widget that you want to move.
- Select Refresh.
The data on the widget is refreshed.
Detection and response widgets
On the Detection and response tab, you can add, configure, and delete widgets.
A selection of widgets used in the Detection and response tab is called a layout. All widgets must be placed in layouts. Kaspersky Next XDR Expert allows you to create, edit, and delete layouts. Preconfigured layouts are also available. You can edit widget settings in the preconfigured layouts as necessary. By default, the Alerts Overview layout is selected on the Detection and response tab.
The widget displays data for the period selected in the widget or layout settings only for the tenants that are selected in the widget or layout settings.
By clicking the link with the name of the widget about events, alerts, incidents, or active lists, you can go to the corresponding section of the Kaspersky Next XDR Expert interface. Note that this option is not available for some widgets.
The following widget groups and widgets are available on the Detection and response tab of the dashboard:
- Events. Widget for creating analytics based on events.
- Active lists. Widget for creating analytics based on active lists of correlators.
- Alerts. Group for analytics related to alerts. Includes information about alerts and incidents that is provided by Kaspersky Next XDR Expert.
The group includes the following widgets:
- Active alerts. Number of alerts that have not been closed.
- Active alerts by tenant. Number of unclosed alerts for each tenant.
- Alerts by tenant. Number of alerts of all statuses for each tenant.
- Unassigned alerts. Number of alerts that have no assignee.
- Alerts by status. Number of alerts that have the New, Opened, Assigned, or Escalated status. The grouping is by status.
- Latest alerts. Table with information about the last 10 unclosed alerts belonging to the tenants selected in the layout.
- Alerts distribution. Number of alerts created during the period configured for the widget.
- Alerts by assignee. Number of alerts with the Assigned status. The grouping is by account name.
- Alerts by severity. Number of unclosed alerts grouped by their severity.
- Alerts by rule. Number of unclosed alerts grouped by correlation rule.
- Assets. Group for analytics related to assets from processed events. This group includes the following widgets:
- Affected assets in alerts. Table with the names of assets and related tenants, and the number of unclosed alerts that are associated with these assets. The moving from the widget to the section with the asset list is not available.
- Affected asset categories. Categories of assets linked to unclosed alerts.
- Number of assets. Number of assets that were added to Kaspersky Next XDR Expert.
- Assets in incidents by tenant. Number of assets associated with unclosed incidents. The grouping is by tenant.
- Assets in alerts by tenant. Number of assets associated with unclosed alerts, grouped by tenant.
- Incidents. Group for analytics related to incidents.
The group includes the following widgets:
- Active incidents. Number of incidents that have not been closed.
- Unassigned incidents. Number of incidents that have the Opened status.
- Incidents distribution. Number of incidents created during the period configured for the widget.
- Incidents by status. Number of incidents grouped by status.
- Incidents by type. Number of incidents in any status grouped by type.
- Active incidents by tenant. Number of unclosed incidents grouped by tenant available to the user account.
- All incidents. Number of incidents of all statuses.
- All incidents by tenant. Number of incidents of all statuses, grouped by tenant.
- Affected assets categories in incidents. Asset categories associated with unclosed incidents.
- Latest incidents. Table with information about the last 10 unclosed incidents belonging to the tenants selected in the layout.
- Incidents by assignee. Number of incidents with the Assigned status. The grouping is by user account name.
- Incidents by severity. Number of unclosed incidents grouped by their severity.
- Affected assets in incidents. Number of assets associated with unclosed incidents. The moving from the widget to the section with the asset list is not available.
- Affected users in incidents. Users associated with incidents. The moving from the widget to the section with the user list is not available.
- Event sources. Group for analytics related to sources of events. The group includes the following widgets:
- Top event sources by alerts number. Number of unclosed alerts grouped by event source.
- Top event sources by convention rate. Number of events associated with unclosed alerts. The grouping is by event source.
In some cases, the number of alerts generated by sources may be inaccurate. To obtain accurate statistics, it is recommended to specify the Device Product event field as unique in the correlation rule, and enable storage of all base events in a correlation event. However, correlation rules with these settings consume more resources.
- Users. Group for analytics related to users from processed events. The group includes the following widgets:
- Affected users in alerts. Number of accounts related to unclosed alerts. The moving from the widget to the section with the user list is not available.
- Number of AD users. Number of Active Directory accounts received via LDAP during the period configured for the widget.
In the events table, in the event details area, in the alert window, and in the widgets, the names of assets, accounts, and services are displayed instead of the IDs as the values of the SourceAssetID, DestinationAssetID, DeviceAssetID, SourceAccountID, DestinationAccountID, and ServiceID fields. When exporting events to a file, the IDs are saved, but columns with names are added to the file. The IDs are also displayed when you point the mouse over the names of assets, accounts, or services.
Searching for fields with IDs is only possible using IDs.
- Playbooks. Group for analytics related to playbooks.
To view widgets in this group, you must have one of the following XDR roles: Main administrator, Tenant Administrator, SOC Administrator, SOC Manager, Junior analyst, Tier 1 analyst, Tier 2 analyst, Approver, Observer.
The group includes the following widgets:
- Statistics MTTR. Changes of the time to first response to alerts and incidents for the specified period of time (by default for 30 days). The widget displays a column chart.
The following configuration parameters of the Statistics MTTR widget are available:
- MTTR type:
- Mean. Changes of the mean time to first response to alerts and incidents.
- Minimum. Changes of the minimum time to first response to alerts and incidents.
- Maximum. Changes of the maximum time to first response to alerts and incidents.
- Response mode:
- Manual. Changes of the time only to manual first responses.
- Automatic. Changes of the time only to automatic first responses.
- All. Changes of the time to all first responses.
- Scope:
- Alerts. Changes of the time to first response only to alerts.
- Incidents. Changes of the time to first response only to incidents.
- All. Changes of the time to first response to alerts and incidents.
- MTTR type:
- Automatic and manual launches of playbooks. The total number of automatic and manual launches of playbooks for a certain period. The widget displays a column chart.
The Launch type parameter of the widget specifies whether to show only the number of automatic, only the number of manual, or the total number of playbook launches for a certain period.
For the Statistics MTTR and Automatic and manual launches of playbooks widgets, you can also set the Period segments length parameter. This parameter specifies a time interval within which data will be grouped. You can group data for every hour, every 4 hours, or every 24 hours. On the column chart, the Period segments length parameter specifies the column width.
- Coverage of alerts and incidents with playbooks. Number of active alerts and incidents. You can select what components to display: incidents, alerts or all.
The donut chart displays alerts/incidents in the following sectors:
- Alerts/incidents for which a playbook in Auto operation mode was launched.
- Alerts/incidents for which a playbook in Training operation mode was launched.
- All other alerts/incidents.
- Time saved by using playbooks. Time saved by launching all the playbooks that have Success or Warning action status.
The widget is not displayed by default.
You can view the full playbook list by clicking the name of any playbook widget.
- Statistics MTTR. Changes of the time to first response to alerts and incidents for the specified period of time (by default for 30 days). The widget displays a column chart.
Creating a widget
You can create a widget in a dashboard layout while creating or editing the layout.
To create a widget:
- In the main menu, go to Monitoring & reporting → Dashboard, and the select the Detection and response tab.
- Create a layout or switch to editing mode for the selected layout.
- Click Add widget.
- Select a widget type from the drop-down list.
This opens the widget settings window.
- Edit the widget settings.
- If you want to see how the data will be displayed in the widget, click Preview.
- Click Add.
The widget appears in the dashboard layout.
Page top
Editing a widget
To edit widget:
- In the main menu, go to Monitoring & reporting → Dashboard, and the select the Detection and response tab.
- Expand the list in the upper right corner of the window.
- Hover the mouse cursor over the relevant layout.
- Click the edit button ().
The Customizing layout window opens.
- In the widget you want to edit, click the settings icon ().
- Select Edit.
This opens the widget settings window.
- Edit the widget settings.
- Click Save in the widget settings window.
- Click Save in the Customizing layout window.
The widget is edited.
Page top
Deleting a widget
To delete a widget:
- In the main menu, go to Monitoring & reporting → Dashboard, and the select the Detection and response tab.
- Expand the list in the upper right corner of the window.
- Hover the mouse cursor over the relevant layout.
- Click the edit button ().
The Customizing layout window opens.
- In the widget you want to delete, click the settings icon ().
- Select Delete.
- In the opened confirmation window, click OK.
- Click the Save button.
The widget is deleted.
Page top
Creating a dashboard layout
To create a layout:
- In the main menu, go to Monitoring & reporting → Dashboard, and the select the Detection and response tab.
- Open the drop-down list in the top right corner of the window and select Create layout.
The New layout window opens.
- In the Tenants drop-down list, select the tenants that will own the created layout and whose data will be used to fill the widgets of the layout.
The selection of tenants in this drop-down list does not matter if you want to create a universal layout (step 8).
- In the Time period drop-down list, select the time period from which you require analytics:
- 1 hour
- 1 day (this value is selected by default)
- 7 days
- 30 days
- In period—receive analytics for the custom time period. The time period is set using the calendar that is displayed when this option is selected.
The upper boundary of the period is not included in the time slice defined by it. In other words, to receive analytics for a 24-hour period, you should configure the period as Day 1, 00:00:00 – Day 2, 00:00:00 instead of Day 1, 00:00:00 – Day 1, 23:59:59.
- In the Refresh every drop-down list, select how often data should be updated in layout widgets:
- 1 minute
- 5 minutes
- 15 minutes
- 1 hour (this value is selected by default)
- 24 hours
- In the Add widget drop-down list, select the required widget and configure its settings.
You can add multiple widgets to the layout.
You can also drag widgets around the window and resize them using the
button that appears when you hover the mouse over a widget.You can edit or delete widgets added to the layout. To do this, click the settings icon (
) and select Edit to change their configuration or Delete to delete them from the layout. - In the Layout name field, enter a unique name for this layout. Must contain 1 to 128 Unicode characters.
- If necessary, click the settings icon () on the right of the layout name field, and then select the check box next to the Universal setting.
The layout widgets display data from tenants that you select in the Selected tenants section in the menu on the left. This means that the data in the layout widgets will change based on your selected tenants without having to edit the layout settings. For universal layouts, tenants selected in the Tenants drop-down list are not taken into account.
If the check box is cleared, layout widgets display data from the tenants that are selected in the Tenants drop-down list in the layout settings. If any of the tenants selected in the layout are not available to you, their data will not be displayed in the layout widgets.
You cannot use the Active Lists widget in universal layouts.
Universal layouts can only be created and edited by a user who has been assigned the Main administrator role. Such layouts can be viewed by all users. - Click Save.
The new layout is created and is displayed on the Detection and response tab of the dashboard.
Page top
Selecting a dashboard layout
To select a dashboard layout:
- In the main menu, go to Monitoring & reporting → Dashboard, and the select the Detection and response tab.
- Expand the list in the upper right corner of the window.
- Select the relevant layout.
The selected layout is displayed on the Detection and response tab of the dashboard.
Page top
Selecting a dashboard layout as the default
To set a dashboard layout as the default:
- In the main menu, go to Monitoring & reporting → Dashboard, and the select the Detection and response tab.
- Expand the list in the upper right corner of the window.
- Hover the mouse cursor over the relevant layout.
- Click the star icon ().
The selected layout is displayed on the Detection and response tab of the dashboard by default.
Page top
Editing a dashboard layout
To edit a dashboard layout:
- In the main menu, go to Monitoring & reporting → Dashboard, and the select the Detection and response tab.
- Expand the list in the upper right corner of the window.
- Hover the mouse cursor over the relevant layout.
- Click the edit icon ().
The Customizing layout window opens.
- Edit the dashboard layout. The settings that are available for editing are the same as the settings available when creating a layout.
- Click Save.
The dashboard layout is edited and displayed on the Detection and response tab.
If the layout is deleted or assigned to a different tenant while you are editing it, an error is displayed when you click Save. The layout is not saved. Refresh the Kaspersky Next XDR Expert interface page to see the list of available layouts in the drop-down list.
Page top
Deleting a dashboard layout
To delete layout:
- In the main menu, go to Monitoring & reporting → Dashboard, and the select the Detection and response tab.
- Expand the list in the upper right corner of the window.
- Hover the mouse cursor over the relevant layout.
- Click the delete icon () and confirm this action.
The layout is deleted.
Page top
Enabling and disabling TV mode
For convenient information presentation of the Detection and response tab, you can enable TV mode. This mode lets you view the Detection and response tab of the dashboard in full-screen mode in FullHD resolution. In TV mode, you can also configure a slide show display for the selected layouts.
It is recommended to create a separate user with the minimum required set of right to display analytics in TV mode.
To enable TV mode:
- In the main menu, go to Monitoring & reporting → Dashboard, and the select the Detection and response tab.
- Click the settings icon () in the upper-right corner.
The Settings window opens.
- Move the TV mode toggle switch to the Enabled position.
- To configure the slideshow display of the layouts, do the following:
- Move the Slideshow toggle switch to the Enabled position.
- In the Timeout field, specify how many seconds to wait before switching layouts.
- In the Queue drop-down list, select the layouts to view. If no layout is selected, the slideshow mode displays all layouts available to the user one after another.
- If necessary, change the order in which the layouts are displayed using the button to drag and drop them.
- Click Save.
TV mode will be enabled. To return to working with the Kaspersky Next XDR Expert interface, disable TV mode.
To disable TV mode:
- In the main menu, go to Monitoring & reporting → Dashboard, and the select the Detection and response tab.
- Click the settings icon () in the upper-right corner.
The Settings window opens.
- Move the TV mode toggle switch to the Disabled position.
- Click Save.
TV mode will be disabled. The left part of the screen shows a pane containing sections of the Kaspersky Next XDR Expert interface.
When you make changes to the layouts selected for the slideshow, those changes will automatically be applied to the active slideshow sessions.
Page top
Preconfigured dashboard layouts
Kaspersky Next XDR Expert includes a set of predefined layouts that contain the following widgets:
- Alerts Overview layout (Alert overview):
- Active alerts—number of alerts that have not been closed.
- Unassigned alerts—number of alerts that have no assignee.
- Latest alerts—table with information about the last 10 unclosed alerts belonging to the tenants selected in the layout.
- Alerts distribution—number of alerts created during the period configured for the widget.
- Alerts by priority—number of unclosed alerts grouped by their priority.
- Alerts by assignee—number of alerts with the Assigned status. The grouping is by account name.
- Alerts by status—number of alerts that have the New, Opened, Assigned, or Escalated status. The grouping is by status.
- Affected users in alerts—number of users associated with alerts that have the New, Assigned, or Escalated status. The grouping is by account name.
- Affected assets—table with information about the level of importance of assets and the number of unclosed alerts they are associated with.
- Affected assets categories—categories of assets associated with unclosed alerts.
- Top event source by alerts number—number of alerts with the New, Assigned, or Escalated status, grouped by alert source (DeviceProduct event field).
The widget displays up to 10 event sources.
- Alerts by rule—number of alerts with the New, Assigned, or Escalated status, grouped by correlation rules.
- Incidents Overview layout (Incidents overview):
- Active incidents—number of incidents that have not been closed.
- Unassigned incidents—number of incidents that have the Opened status.
- Latest incidents—table with information about the last 10 unclosed incidents belonging to the tenants selected in the layout.
- Incidents distribution—number of incidents created during the period configured for the widget.
- Incidents by priority—number of unclosed incidents grouped by their priority.
- Incidents by assignee—number of incidents with the Assigned status. The grouping is by user account name.
- Incidents by status—number of incidents grouped by their status.
- Affected assets in incidents—number of assets associated with unclosed incidents.
- Affected users in incidents—users associated with incidents.
- Affected asset categories in incidents—categories of assets associated with unclosed incidents.
- Active incidents by tenant—number of incidents of all statuses, grouped by tenant.
- Network Overview layout (Network activity overview):
- Netflow top internal IPs—total volume of netflow traffic received by the asset, in bytes. The data is grouped by internal IP addresses of assets.
The widget displays up to 10 IP addresses.
- Netflow top external IPs—total volume of netflow traffic received by the asset, in bytes. The data is grouped by external IP addresses of assets.
- Netflow top hosts for remote control—number of events associated with access attempts to one of the following ports: 3389, 22, 135. The data is grouped by asset name.
- Netflow total bytes by internal ports—number of bytes sent to internal ports of assets. The data is grouped by port number.
- Top Log Sources by Events count—top 10 sources from which the greatest number of events was received.
- Netflow top internal IPs—total volume of netflow traffic received by the asset, in bytes. The data is grouped by internal IP addresses of assets.
The default refresh period for predefined layouts is Never. You can edit these layouts as needed.
Page top
About the Dashboard-only mode
You can configure the Dashboard-only mode for employees who do not manage the network but who want to view the network protection statistics in Open Single Management Platform (for example, a top manager). When a user has this mode enabled, only a dashboard with a predefined set of widgets is displayed to the user. Thus, he or she can monitor the statistics specified in the widgets, for example, the protection status of all managed devices, the number of recently detected threats, or the list of the most frequent threats in the network.
When a user works in the Dashboard-only mode, the following restrictions are applied:
- The main menu is not displayed to the user, so he or she cannot change the network protection settings.
- The user cannot perform any actions with widgets, for example, add or hide them. Therefore, you need to put all widgets required for the user on the dashboard and configure them, for instance, set the rule of counting objects or specify the time interval.
You cannot assign the Dashboard-only mode to yourself. If you want to work in this mode, contact a system administrator, Managed Service Provider (MSP), or a user with the Modify object ACLs right in the General features: User permissions functional area.
Configuring the Dashboard-only mode
Before you begin to configure the Dashboard-only mode, make sure that the following prerequisites are met:
- You have the Modify object ACLs right in the General features: User permissions functional area. If you do not have this right, the tab for configuring the mode will be missing.
- The user has the Read right in the General features: Basic functionality functional area.
If a hierarchy of Administration Servers is arranged in your network, for configuring the Dashboard-only mode go to the Server where the user account is available on the Users tab of the Users & roles → Users & groups section. It can be a primary server or physical secondary server. It is not possible to adjust the mode on a virtual server.
To configure the Dashboard-only mode:
- In the main menu, go to Users & roles → Users & groups, and then select the Users tab.
- Click the user account name for which you want to adjust the dashboard with widgets.
- In the account settings window that opens, select the Dashboard tab.
On the tab that opens, the same dashboard is displayed for you as for the user.
- If the Display the console in Dashboard-only mode option is enabled, switch the toggle button to disable it.
When this option is enabled, you are also unable to change the dashboard. After you disable the option, you can manage widgets.
- Configure the dashboard appearance. The set of widgets prepared on the Dashboard tab is available for the user with the customizable account. He or she cannot change any settings or size of the widgets, add, or remove any widgets from the dashboard. Therefore, adjust them for the user, so he or she can view the network protection statistics. For this purpose, on the Dashboard tab you can perform the same actions with widgets as in the Monitoring & reporting → Dashboard section:
- Add new widgets to the dashboard.
- Hide widgets that the user doesn't need.
- Move widgets into a specific order.
- Change the size or appearance of widgets.
- Change the widget settings.
- Switch the toggle button to enable the Display the console in Dashboard-only mode option.
After that, only the dashboard is available for the user. He or she can monitor statistics but cannot change the network protection settings and dashboard appearance. As the same dashboard is displayed for you as for the user, you are also unable to change the dashboard.
If you keep the option disabled, the main menu is displayed for the user, so he or she can perform various actions in Open Single Management Platform, including changing security settings and widgets.
- Click the Save button when you finish configuring the Dashboard-only mode. Only after that will the prepared dashboard be displayed to the user.
- If the user wants to view statistics of supported Kaspersky applications and needs access rights to do so, configure the rights for the user. After that, Kaspersky applications data is displayed for the user in the widgets of these applications.
Now the user can log in to Open Single Management Platform under the customized account and monitor the network protection statistics in the Dashboard-only mode.
Page top
Reports
This section describes how to use reports, manage custom report templates, use report templates to generate new reports, and create report delivery tasks.
Using reports
The Reports feature allows you to get detailed numerical information about the security of your organization's network, save this information to a file, send it by email, and print it.
Reports are available in the OSMP Console, in the Monitoring & reporting section, by clicking Reports.
By default, reports include information for the last 30 days.
Open Single Management Platform has a default set of reports for the following categories:
- Protection status
- Deployment
- Updating
- Threat statistics
- Other
You can create custom report templates, edit report templates, and delete them.
You can create reports that are based on existing templates, export reports to files, and create tasks for report delivery.
Creating a report template
To create a report template:
- In the main menu, go to Monitoring & reporting → Reports.
- Click Add.
The New report template wizard starts. Proceed through the wizard by using the Next button.
- Enter the report name and select the report type.
- On the Scope step of the wizard, select the set of client devices (administration group, device selection, selected devices, or all networked devices) whose data will be displayed in reports that are based on this report template.
- On the Reporting period step of the wizard, specify the report period. Available values are as follows:
- Between the two specified dates
- From the specified date to the report creation date
- From the report creation date, minus the specified number of days, to the report creation date
This page may not appear for some reports.
- Click OK to close the wizard.
- Do one of the following:
- Click the Save and run button to save the new report template and to run a report based on it.
The report template is saved. The report is generated.
- Click the Save button to save the new report template.
The report template is saved.
- Click the Save and run button to save the new report template and to run a report based on it.
You can use the new template for generating and viewing reports.
Viewing and editing report template properties
You can view and edit basic properties of a report template, for example, the report template name or the fields displayed in the report.
To view and edit properties of a report template:
- In the main menu, go to Monitoring & reporting → Reports.
- Select the check box next to the report template whose properties you want to view and edit.
As an alternative, you can first generate the report, and then click the Edit button.
- Click the Open report template properties button.
The Editing report <Report name> window opens with the General tab selected.
- Edit the report template properties:
- General tab:
- Report template name
- Maximum number of entries to display
- Group
Click the Settings button to change the set of client devices for which the report is created. For some types of the reports, the button may be unavailable. The actual settings depend on the settings specified during creation of the report template.
- Time interval
Click the Settings button to modify the report period. For some types of the reports, the button may be unavailable. Available values are as follows:
- Between the two specified dates
- From the specified date to the report creation date
- From the report creation date, minus the specified number of days, to the report creation date
- Include data from secondary and virtual Administration Servers
- Up to nesting level
- Data wait interval (min)
- Cache data from secondary Administration Servers
- Cache update frequency (h)
- Transfer detailed information from secondary Administration Servers
- Fields tab
Select the fields that will be displayed in the report, and use the Move up button and Move down button to change the order of these fields. Use the Add button or Edit button to specify whether the information in the report must be sorted and filtered by each of the fields.
In the Filters of Details fields section, you can also click the Convert filters button to start using the extended filtering format. This format enables you to combine filtering conditions specified in various fields by using the logical OR operation. After you click the button, the Convert filters panel opens on the right. Click the Convert filters button to confirm conversion. You can now define a converted filter with conditions from the Details fields section that are applied by using the logical OR operation.
Conversion of a report to the format supporting complex filtering conditions will make the report incompatible with the previous versions of Kaspersky Security Center (11 and earlier). Also, the converted report will not contain any data from secondary Administration Servers running such incompatible versions.
- General tab:
- Click Save to save the changes.
- Close the Editing report <Report name> window.
The updated report template appears in the list of report templates.
Page top
Exporting a report to a file
You can save one or multiple reports as XML, HTML, or PDF. Open Single Management Platform allows you to export up to 10 reports to files of the specified format at the same time.
PDF format is available only if you are connected to the secondary Administration Server in OSMP Console.
To export a report to a file:
- In the main menu, go to Monitoring & reporting → Reports.
- Choose the reports that you want to export.
If you choose more than 10 reports, the Export report button will be disabled.
- Click the Export report button.
- In the window that opens, specify the following export parameters:
- File name.
If you select one report to export, specify the report file name.
If you select more than one report, the report file names will coincide with the name of the selected report templates.
- Maximum number of entries.
Specify the maximum number of entries included in the report file. The default value is 10,000.
You can export a report with an unlimited number of entries. Note that if your report contains a large number of entries, the time required for generating and exporting the report increases.
- File format.
Select the report file format: XML, HTML, or PDF. If you export multiple reports, all selected reports are saved in the specified format as separate files.
PDF format is available only if you are connected to the secondary Administration Server in OSMP Console.
The wkhtmltopdf tool is required to convert a report to PDF. When you select the PDF option, secondary Administration Server checks whether the wkhtmltopdf tool is installed on the device. If the tool is not installed, the application displays a message about the necessity to install the tool on the Administration Server device. Install the tool manually, and then proceed to the next step.
- File name.
- Click the Export report button.
The report is saved to a file in the specified format.
Page top
Generating and viewing a report
To create and view a report:
- In the main menu, go to Monitoring & reporting → Reports.
- Click the name of the report template that you want to use to create a report.
A report using the selected template is generated and displayed.
Report data is displayed according to the localization set for the Administration Server.
In the generated reports, some fonts may be displayed incorrectly on the diagrams. To resolve this issue, install the fontconfig library. Also, please check that the fonts corresponding to your operating system locale are installed in the operating system.
The report displays the following data:
- On the Summary tab:
- The name and type of report, a brief description and the reporting period, as well as information about the group of devices for which the report is generated.
- Graph chart showing the most representative report data.
- Consolidated table with calculated report indicators.
- On the Details tab, a table with detailed report data is displayed.
Creating a report delivery task
You can create a task that will deliver selected reports.
To create a report delivery task:
- In the main menu, go to Monitoring & reporting → Reports.
- Select the check boxes next to the report templates for which you want to create a report delivery task.
- Click the Create delivery task button.
The New task wizard starts. Proceed through the wizard by using the Next button.
- At the New task settings step of the wizard, enter the task name.
The default name is Deliver reports. If a task with this name already exists, a sequence number (<N>) is added to the task name.
- At the Report configuration step of the wizard, specify the following settings:
- Report templates to be delivered by the task.
- The report format: HTML, XLS, or PDF.
The wkhtmltopdf tool is required to convert a report to PDF. When you select the PDF option, Administration Server checks whether the wkhtmltopdf tool is installed on the device. If the tool is not installed, the application displays a message about the necessity to install the tool on the Administration Server device. Install the tool manually, and then proceed to the next step.
- Whether the reports are to be sent by email, together with email notification settings.
You can specify up to 20 email addresses. To separate email addresses, press Enter. You can also paste a comma-separated list of email addresses, and then press Enter.
- Whether the reports are to be saved to a folder, together with the corresponding settings.
After you enable the Save to a folder option, you must specify a POSIX path to the folder. If you want to save the reports to a shared folder, you also have to select the Specify account for access to shared folder check box, and then specify the user account and password for accessing this folder.
If you select to save the reports to a shared folder, you have to ensure the access to this folder from the device with Administration Server installed. The ways to ensure the access and the tools used depend on your infrastructure.
When saving the reports to a local folder, credentials are usually not needed since the account under which the Administration Server is running has the access to this folder. If necessary, you can specify the user credentials at the Selecting an account to run the task step of the wizard.
Regardless of the folder choice, you can also select the Overwrite older reports of the same type check box if you want the new report file to overwrite the file that was saved in the reports folder at the previous task startup.
- At the Configure task schedule step of the wizard, select the task start schedule.
The following task schedule options are available:
- At this step of the wizard, configure other task schedule settings:
- In the Task schedule section, check or reconfigure the previously selected schedule and set the time interval, days of the month or week, set the virus outbreak condition or completing another task as a trigger to start the task. A start time can also be specified in this section if an applicable schedule is selected.
- In the Additional settings section, specify the following settings:
- At the Selecting an account to run the task step of the wizard, specify the credentials of the user account that is used to run the task.
- If you want to modify other task settings after the task is created, at the Finish task creation step of the wizard, enable the Open task details when creation is complete option (by default, this option is enabled).
- Click the Finish button to create the task and close the wizard.
The report delivery task is created. If the Open task details when creation is complete option is enabled, the task settings window opens.
Page top
Deleting report templates
To delete one or several report templates:
- In the main menu, go to Monitoring & reporting → Reports.
- Select check boxes next to the report templates that you want to delete.
- Click the Delete button.
- In the window that opens, click OK to confirm your selection.
The selected report templates are deleted. If these report templates were included in the report delivery tasks, they are also removed from the tasks.
Events and event selections
This section provides information about events and event selections, about the types of events that occur in Open Single Management Platform components, and about managing frequent events blocking.
About events in Open Single Management Platform
Open Single Management Platform allows you to receive information about events that occur during the operation of Administration Server and Kaspersky applications installed on managed devices. Information about events is saved in the Administration Server database.
Events by type
In Open Single Management Platform, there are the following types of events:
- General events. These events occur in all managed Kaspersky applications. An example of a general event is Virus outbreak. General events have strictly defined syntax and semantics. General events are used, for instance, in reports and dashboards.
- Managed Kaspersky applications-specific events. Each managed Kaspersky application has its own set of events.
Events by source
You can view the full list of the events that can be generated by an application on the Event configuration tab in the application policy. For Administration Server, you can additionally view the event list in the Administration Server properties.
Events can be generated by the following applications:
- Open Single Management Platform components:
- Managed Kaspersky applications
For details about the events generated by Kaspersky managed applications, please refer to the documentation of the corresponding application.
Events by importance level
Each event has its own importance level. Depending on the conditions of its occurrence, an event can be assigned various importance levels. There are four importance levels of events:
- A critical event is an event that indicates the occurrence of a critical problem that may lead to data loss, an operational malfunction, or a critical error.
- A functional failure is an event that indicates the occurrence of a serious problem, error, or malfunction that occurred during operation of the application or while performing a procedure.
- A warning is an event that is not necessarily serious, but nevertheless indicates a potential problem in the future. Most events are designated as warnings if the application can be restored without loss of data or functional capabilities after such events occur.
- An info event is an event that occurs for the purpose of informing about successful completion of an operation, proper functioning of the application, or completion of a procedure.
Each event has a defined storage term, during which you can view or modify it in Open Single Management Platform. Some events are not saved in the Administration Server database by default because their defined storage term is zero. Only events that will be stored in the Administration Server database for at least one day can be exported to external systems.
Events of Open Single Management Platform components
Each Open Single Management Platform component has its own set of event types. This section lists types of events that occur in Kaspersky Security Center Administration Server and Network Agent. Types of events that occur in Kaspersky applications are not listed in this section.
For each event that can be generated by an application, you can specify notification settings and storage settings on the Event configuration tab in the application policy. For Administration Server, you can additionally view and configure the event list in the Administration Server properties. If you want to configure notification settings for all the events at once, configure general notification settings in the Administration Server properties.
Data structure of event type description
For each event type, its display name, identifier (ID), alphabetic code, description, and the default storage term are provided.
- Event type display name. This text is displayed in Open Single Management Platform when you configure events and when they occur.
- Event type ID. This numerical code is used when you process events by using third-party tools for event analysis.
- Event type (alphabetic code). This code is used when you browse and process events by using public views that are provided in the Open Single Management Platform database and when events are exported to a SIEM system.
- Description. This text contains the situations when an event occurs and what you can do in such a case.
- Default storage term. This is the number of days during which the event is stored in the Administration Server database and is displayed in the list of events on Administration Server. After this period elapses, the event is deleted. If the event storage term value is 0, such events are detected but are not displayed in the list of events on Administration Server. If you configured to save such events to the operating system event log, you can find them there.
You can change the storage term for events: Setting the storage term for an event
Administration Server events
This section contains information about the events related to the Administration Server.
Administration Server critical events
The table below shows the events of Kaspersky Security Center Administration Server that have the Critical importance level.
For each event that can be generated by an application, you can specify notification settings and storage settings on the Event configuration tab in the application policy. For Administration Server, you can additionally view and configure the event list in the Administration Server properties. If you want to configure notification settings for all the events at once, configure general notification settings in the Administration Server properties.
Administration Server critical events
Event type display name |
Event type ID |
Event type |
Description |
Default storage term |
|---|---|---|---|---|
License limit has been exceeded |
4099 |
KLSRV_EV_LICENSE_CHECK_MORE_110 |
Once a day Open Single Management Platform checks whether a licensing limit is exceeded. Events of this type occur when Administration Server detects that some licensing limits are exceeded by Kaspersky applications installed on client devices and if the number of currently used licensing units covered by a single license exceeds 110% of the total number of units covered by the license. Even when this event occurs, client devices are protected. You can respond to the event in the following ways:
Open Single Management Platform determines the rules to generate events when a licensing limit is exceeded. |
180 days |
Device has become unmanaged |
4111 |
KLSRV_HOST_OUT_CONTROL |
Events of this type occur if a managed device is visible on the network but has not connected to Administration Server for a specific period. Find out what prevents the proper functioning of Network Agent on the device. Possible causes include network issues and removal of Network Agent from the device. |
180 days |
Device status is Critical |
4113 |
KLSRV_HOST_STATUS_CRITICAL |
Events of this type occur when a managed device is assigned the Critical status. You can configure the conditions under which the device status is changed to Critical. |
180 days |
The key file has been added to the denylist |
4124 |
KLSRV_LICENSE_BLACKLISTED |
Events of this type occur when Kaspersky has added the activation code or key file that you use to the denylist. Contact Technical Support for more details. |
180 days |
License expires soon |
4129 |
KLSRV_EV_LICENSE_SRV_EXPIRE_SOON |
Events of this type occur when the commercial license expiration date is approaching. Once a day Open Single Management Platform checks whether a license expiration date is approaching. Events of this type are published 30 days, 15 days, 5 days, and 1 day before the license expiration date. This number of days cannot be changed. If the Administration Server is turned off on the specified day before the license expiration date, the event will not be published until the next day. When the commercial license expires, Open Single Management Platform provides only basic functionality. You can respond to the event in the following ways:
|
180 days |
Certificate has expired |
4132 |
KLSRV_CERTIFICATE_EXPIRED |
Events of this type occur when the Administration Server certificate for Mobile Device Management expires. You need to update the expired certificate. |
180 days |
Administration Server certificate has expired. |
6129 |
KLSRV_EV_SRV_CERT_EXPIRED_DN |
Events of this type occur when the Administration Server certificate expires. You need to update the expired certificate. |
180 days |
Audit: Export to SIEM failed |
5130 |
KLAUD_EV_SIEM_EXPORT_ERROR |
Events of this type occur when exporting events to the SIEM system failed due to a connection error with the SIEM system. |
180 days |
Limited functionality mode |
4130 |
KLSRV_EV_LICENSE_SRV_LIMITED_MODE |
Events of this type occur when Open Single Management Platform starts to operate with basic functionality, without Vulnerability and patch management and without Mobile Device Management features. Following are causes of, and appropriate responses to, the event:
|
180 days |
Updates for Kaspersky application modules have been revoked |
4142 |
KLSRV_SEAMLESS_UPDATE_REVOKED |
Events of this type occur if seamless updates have been revoked (Revoked status is displayed for these updates) by Kaspersky technical specialists; for example, they must be updated to a newer version. The event concerns Open Single Management Platform patches and does not concern modules of managed Kaspersky applications. The event provides the reason that the seamless updates are not installed. |
180 days |
Virus outbreak |
|
GNRL_EV_VIRUS_OUTBREAK |
Events of this type occur when the number of malicious objects detected on several managed devices exceeds the threshold within a short period. You can respond to the event in the following ways:
|
|
Administration Server functional failure events
The table below shows the events of Kaspersky Security Center Administration Server that have the Functional failure importance level.
For each event that can be generated by an application, you can specify notification settings and storage settings on the Event configuration tab in the application policy. For Administration Server, you can additionally view and configure the event list in the Administration Server properties. If you want to configure notification settings for all the events at once, configure general notification settings in the Administration Server properties.
Administration Server functional failure events
Event type display name |
Event type ID |
Event type |
Description |
Default storage term |
|---|---|---|---|---|
Runtime error
|
4125
|
KLSRV_RUNTIME_ERROR
|
Events of this type occur because of unknown issues. Most often these are DBMS issues, network issues, and other software and hardware issues. Details of the event can be found in the event description.
|
180 days
|
Failed to copy the updates to the specified folder |
4123 |
KLSRV_UPD_REPL_FAIL |
Events of this type occur when software updates are copied to an additional shared folder(s). You can respond to the event in the following ways:
|
180 days |
No free disk space |
4107 |
KLSRV_DISK_FULL |
Events of this type occur when the hard drive of the device on which Administration Server is installed runs out of free space. Free up disk space on the device. |
180 days |
Shared folder is not available |
4108 |
KLSRV_SHARED_FOLDER_UNAVAILABLE |
Events of this type occur if the shared folder of Administration Server is not available. You can respond to the event in the following ways:
|
180 days |
The Administration Server database is unavailable |
4109 |
KLSRV_DATABASE_UNAVAILABLE |
Events of this type occur if the Administration Server database becomes unavailable. You can respond to the event in the following ways:
|
180 days |
No free space in the Administration Server database |
4110 |
KLSRV_DATABASE_FULL |
Events of this type occur when there is no free space in the Administration Server database. Administration Server does not function when its database has reached its capacity and when further recording to the database is not possible. Following are the causes of this event, depending on the DBMS that you use, and appropriate responses to the event:
Review the information on DBMS selection. |
180 days |
Failed to poll the cloud segment |
4143 |
KLSRV_KLCLOUD_SCAN_ERROR |
Events of this type occur when Administration Server fails to poll a network segment in a cloud environment. Read the details in the event description and respond accordingly. |
Not stored |
Administration Server warning events
The table below shows the events of Kaspersky Security Center Administration Server that have the Warning importance level.
For each event that can be generated by an application, you can specify notification settings and storage settings on the Event configuration tab in the application policy. For Administration Server, you can additionally view and configure the event list in the Administration Server properties. If you want to configure notification settings for all the events at once, configure general notification settings in the Administration Server properties.
Administration Server warning events
Event type display name |
Event type ID |
Event type |
Description |
Default storage term |
|---|---|---|---|---|
Frequent events have been detected |
|
KLSRV_EVENT_SPAM_EVENTS_DETECTED |
Events of this type occur when Administration Server detects a frequent event on a managed device. Refer to the following section for details: Blocking frequent events. |
90 days |
License limit has been exceeded |
4098 |
KLSRV_EV_LICENSE_CHECK_100_110 |
Once a day Open Single Management Platform checks whether a licensing limit is exceeded. Events of this type occur when Administration Server detects that some licensing limits are exceeded by Kaspersky applications installed on client devices and if the number of currently used licensing units covered by a single license constitute 100% to 110% of the total number of units covered by the license. Even when this event occurs, client devices are protected. You can respond to the event in the following ways:
Open Single Management Platform determines the rules to generate events when a licensing limit is exceeded. |
90 days |
Device has remained inactive on the network for a long time |
4103 |
KLSRV_EVENT_HOSTS_NOT_VISIBLE |
Events of this type occur when a managed device shows inactivity for some time. Most often, this happens when a managed device is decommissioned. You can respond to the event in the following ways:
|
90 days |
Conflict of device names |
4102 |
KLSRV_EVENT_HOSTS_CONFLICT |
Events of this type occur when Administration Server considers two or more managed devices as a single device. Most often this happens when a cloned hard drive was used for software deployment on managed devices and without switching the Network Agent to the dedicated disk cloning mode on a reference device. To avoid this issue, switch Network Agent to the disk cloning mode on a reference device before cloning the hard drive of this device. |
90 days |
Device status is Warning
|
4114
|
KLSRV_HOST_STATUS_WARNING
|
Events of this type occur when a managed device is assigned the Warning status. You can configure the conditions under which the device status is changed to Warning.
|
90 days
|
Certificate has been requested |
4133 |
KLSRV_CERTIFICATE_REQUESTED |
Events of this type occur when a certificate for Mobile Device Management fails to be automatically reissued. Following might be the causes and appropriate responses to the event:
|
90 days |
Certificate has been removed |
4134 |
KLSRV_CERTIFICATE_REMOVED |
Events of this type occur when an administrator removes any type of certificate (General, Mail, VPN) for Mobile Device Management. After removing a certificate, mobile devices connected via this certificate will fail to connect to Administration Server. This event might be helpful when investigating malfunctions associated with the management of mobile devices. |
90 days |
Certificate is expiring |
6128 |
KLSRV_EV_SRV_CERT_EXPIRES_SOON |
Events of this type occur when the Administration Server certificate is expiring in 30 days or sooner, and there is no reserve certificate. |
90 days |
APNs certificate has expired |
4135 |
KLSRV_APN_CERTIFICATE_EXPIRED |
Events of this type occur when an APNs certificate expires. You need to manually renew the APNs certificate and install it on an iOS MDM Server. |
Not stored |
APNs certificate expires soon |
4136 |
KLSRV_APN_CERTIFICATE_EXPIRES_SOON |
Events of this type occur when there are fewer than 14 days left before the APNs certificate expires. When the APNs certificate expires, you need to manually renew the APNs certificate and install it on an iOS MDM Server. We recommend that you schedule the APNs certificate renewal in advance of the expiration date. |
Not stored |
Failed to send the FCM message to the mobile device |
4138 |
KLSRV_GCM_DEVICE_ERROR |
Events of this type occur when Mobile Device Management is configured to use Google Firebase Cloud Messaging (FCM) for connecting to managed mobile devices with an Android operating system and FCM Server fails to handle some of the requests received from Administration Server. It means that some of the managed mobile devices will not receive a push notification. Read the HTTP code in the details of the event description and respond accordingly. For more information on the HTTP codes received from FCM Server and related errors, please refer to the Google Firebase service documentation (see chapter "Downstream message error response codes"). |
90 days |
HTTP error sending the FCM message to the FCM server |
4139 |
KLSRV_GCM_HTTP_ERROR |
Events of this type occur when Mobile Device Management is configured to use Google Firebase Cloud Messaging (FCM) for connecting managed mobile devices with the Android operating system and FCM Server reverts to the Administration Server a request with a HTTP code other than 200 (OK). Following might be the causes and appropriate responses to the event:
|
90 days |
Failed to send the FCM message to the FCM server |
4140 |
KLSRV_GCM_GENERAL_ERROR |
Events of this type occur due to unexpected errors on the Administration Server side when working with the Google Firebase Cloud Messaging HTTP protocol. Read the details in the event description and respond accordingly. If you cannot find the solution to an issue on your own, we recommend that you contact Kaspersky Technical Support. |
90 days |
Little free space on the hard drive |
4105 |
KLSRV_NO_SPACE_ON_VOLUMES |
Events of this type occur when the hard drive of the device on which Administration Server is installed almost runs out of free space. Free up disk space on the device. |
90 days |
No free space in the Administration Server database |
4106 |
KLSRV_NO_SPACE_IN_DATABASE |
Events of this type occur if space in the Administration Server database is too limited. If you do not remedy the situation, soon the Administration Server database will reach its capacity and Administration Server will not function. Following are the causes of this event, depending on the DBMS that you use, and the appropriate responses to the event.
Review the information on DBMS selection. |
90 days |
Connection to the secondary Administration Server has been interrupted |
4116 |
KLSRV_EV_SLAVE_SRV_DISCONNECTED |
Events of this type occur when a connection to the secondary Administration Server is interrupted. Read the operating system log on the device where the secondary Administration Server is installed and respond accordingly. |
90 days |
Connection to the primary Administration Server has been interrupted |
4118 |
KLSRV_EV_MASTER_SRV_DISCONNECTED |
Events of this type occur when a connection to the primary Administration Server is interrupted. Read the operating system log on the device where the primary Administration Server is installed and respond accordingly. |
90 days |
New updates for Kaspersky application modules have been registered |
4141 |
KLSRV_SEAMLESS_UPDATE_REGISTERED |
Events of this type occur when Administration Server registers new updates for the Kaspersky software installed on managed devices that require approval to be installed. Approve or decline the updates by using Kaspersky Security Center Web Console. |
90 days |
The limit on the number of events in the database is exceeded, deletion of events has started |
4145 |
KLSRV_EVP_DB_TRUNCATING |
Events of this type occur when deletion of old events from the Administration Server database has started after the Administration Server database capacity is reached. You can respond to the event in the following ways: |
Not stored |
The limit on the number of events in the database is exceeded, the events have been deleted |
4146 |
KLSRV_EVP_DB_TRUNCATED |
Events of this type occur when old events have been deleted from the Administration Server database after the Administration Server database capacity is reached. You can respond to the event in the following ways: |
Not stored |
Failed to download file to device |
4165 |
KLSRV_FILE_DOWNLOAD_FAILED |
This event occurs in the following cases:
|
90 days |
Audit: Test connection to SIEM server failed |
5120 |
KLAUD_EV_SIEM_TEST_FAILED |
Events of this type occur when an automatic connection test to the SIEM server failed. |
90 days |
Administration Server informational events
The table below shows the events of Kaspersky Security Center Administration Server that have the Info importance level.
For each event that can be generated by an application, you can specify notification settings and storage settings on the Event configuration tab in the application policy. For Administration Server, you can additionally view and configure the event list in the Administration Server properties. If you want to configure notification settings for all the events at once, configure general notification settings in the Administration Server properties.
Administration Server informational events
Event type display name |
Event type ID |
Event type |
Description |
Default storage term |
|---|---|---|---|---|
Over 90% of the license key is used up |
4097 |
KLSRV_EV_LICENSE_CHECK_90 |
Events of this type occur when Administration Server detects that some licensing limits are close to being exceeded by Kaspersky applications installed on client devices and if the number of currently used licensing units covered by a single license constitute over 90% of the total number of units covered by the license. Even when a licensing limit is exceeded, client devices are protected. You can respond to the event in the following ways:
Open Single Management Platform determines the rules to generate events when a licensing limit is exceeded. |
30 days |
New device has been detected |
4100 |
KLSRV_EVENT_HOSTS_NEW_DETECTED |
Events of this type occur when new networked devices have been discovered. |
30 days |
Device has been automatically added to the group |
4101 |
KLSRV_EVENT_HOSTS_NEW_REDIRECTED |
Events of this type occur when devices have been assigned to a group according to device moving rules. |
30 days |
Device has been automatically moved according to a rule |
1074 |
KLSRV_HOST_MOVED_WITH_RULE_EX |
Events of this type occur when devices have been moved to administration groups by using device moving rules. |
30 days |
Device has been removed from the group: inactive on the network for a long time
|
4104
|
KLSRV_INVISIBLE_HOSTS_REMOVED
|
Events of this type occur when devices have been automatically removed from a group for inactivity.
|
30 days
|
FCM Instance ID has changed on this mobile device |
4137 |
KLSRV_GCM_DEVICE_REGID_CHANGED |
Events of this type occur when the Firebase Cloud Messaging token has changed on the device. For information on the FCM token rotation, please refer to the Firebase service documentation. |
30 days |
Updates have been successfully copied to the specified folder |
4122 |
KLSRV_UPD_REPL_OK |
Events of this type occur when the Download updates to the Administration Server repository task finishes copying files to a specified folder. |
30 days |
Connection to the secondary Administration Server has been established |
4115 |
KLSRV_EV_SLAVE_SRV_CONNECTED |
Refer to the following topic for details: Creating a hierarchy of Administration Servers: adding a secondary Administration Server. |
30 days |
Connection to the primary Administration Server has been established |
4117 |
KLSRV_EV_MASTER_SRV_CONNECTED |
|
30 days |
Files have been found to send to Kaspersky for analysis |
4131 |
KLSRV_APS_FILE_APPEARED |
|
30 days |
Databases have been updated |
4144 |
KLSRV_UPD_BASES_UPDATED |
Events of this type occur when the Download updates to the Administration Server repository task finishes updating databases. |
30 days |
Audit: Connection to the Administration Server has been established |
4147 |
KLAUD_EV_SERVERCONNECT |
Events of this type occur when a user connects to Administration Server by using Web Console. These events include information about the IP address of the device where the Administration Server is installed. |
30 days |
Audit: Object has been modified |
4148 |
KLAUD_EV_OBJECTMODIFY |
This event tracks changes in the following objects:
|
30 days |
Audit: Object status has changed |
4150 |
KLAUD_EV_TASK_STATE_CHANGED |
For example, this event occurs when a task has failed with an error. |
30 days |
Audit: Group settings have been modified |
4149 |
KLAUD_EV_ADMGROUP_CHANGED |
Events of this type occur when a security group has been edited. |
30 days |
Audit: Connection to Administration Server has been terminated |
4151 |
KLAUD_EV_SERVERDISCONNECT |
|
30 days |
Audit: Object properties have been modified |
4152 |
KLAUD_EV_OBJECTPROPMODIFIED |
This event tracks changes in the following properties:
|
30 days |
Audit: User permissions have been modified |
4153 |
KLAUD_EV_OBJECTACLMODIFIED |
This event occurs when user permissions have been modified |
30 days |
File uploaded to Administration Server |
4162 |
KLSRV_FILE_UPLOADED |
This event occurs when a file has been uploaded to Administration Server. |
30 days |
File deleted from Administration Server |
4163 |
KLSRV_FILE_REMOVED |
This event occurs when a file has been deleted from Administration Server. |
30 days |
File downloaded to device |
4164 |
KLSRV_FILE_DOWNLOADED |
This event occurs in the following cases:
|
30 days |
Audit: Encryption keys imported/exported |
5100 |
KLAUD_EV_DPEKEYSEXPORT |
For example, this event occurs during migration. |
30 days |
Audit: Test connection to SIEM server succeeded |
5110 |
KLAUD_EV_SIEM_TEST_SUCCESS |
This event occurs when a test connection to the SIEM server succeeded. |
30 days |
Reserve certificate created |
6126 |
KLSRV_EV_SRV_CERT_RESERVE_CREATED |
This event occurs when an Administration Server certificate has been created. |
30 days |
Certificate renewing |
6127 |
KLSRV_EV_SRV_CERT_RENEWED |
This event occurs when the Administration Server certificate has been renewed. |
30 days |
Network Agent events
This section contains information about the events related to Network Agent.
Network Agent warning events
The table below shows the events of Network Agent that have the Warning severity level.
For each event that can be generated by an application, you can specify notification settings and storage settings on the Event configuration tab in the application policy. If you want to configure notification settings for all the events at once, configure general notification settings in the Administration Server properties.
Network Agent warning events
Event type display name |
Event type ID |
Event type |
Description |
Default storage term |
|---|---|---|---|---|
Security issue has occurred |
549 |
GNRL_EV_APP_INCIDENT_OCCURED |
Events of this type occur when an incident has been found on a device. For example, this event occurs when the device has low disk space. |
30 days |
KSN Proxy has started. Failed to check KSN for availability |
7718 |
KSNPROXY_STARTED_CON_CHK_FAILED |
Events of this type occur when test connection fails for the configured KSN proxy connection. |
30 days |
Third-party software update installation has been postponed |
7698 |
KLNAG_EV_3P_PATCH_INSTALL_SLIPPED |
For example, events of this type occur when EULA for a third-party update installation is declined. |
30 days |
Third-party software update installation has completed with a warning |
7696 |
KLNAG_EV_3P_PATCH_INSTALL_WARNING |
Download the trace files and check the KLRI_PATCH_RES_DESC field value for details. |
30 days |
Warning has been returned during installation of the software module update |
7701 |
KLNAG_EV_PATCH_INSTALL_WARNING |
Download the trace files and check the KLRI_PATCH_RES_DESC field value for details. |
30 days |
User management: warnings |
7722 |
KLNAG_EV_USR_MNG_WRN |
General warning event. |
30 days |
Sudoers file found doesn't match reference value |
7724 |
KLNAG_EV_SUDOER_DIFFERENT |
Events of this type occur when there is a mismatch between the sudoers file and the reference file. |
30 days |
Network Agent informational events
The table below shows the events of Network Agent that have the Info severity level.
For each event that can be generated by an application, you can specify notification settings and storage settings on the Event configuration tab in the application policy. If you want to configure notification settings for all the events at once, configure general notification settings in the Administration Server properties.
Network Agent informational events
Event type display name |
Event type ID |
Event type |
Default storage term |
|---|---|---|---|
Application has been installed |
7703 |
KLNAG_EV_INV_APP_INSTALLED |
30 days |
Application has been uninstalled |
7704 |
KLNAG_EV_INV_APP_UNINSTALLED |
30 days |
Monitored application has been installed |
7705 |
KLNAG_EV_INV_OBS_APP_INSTALLED |
30 days |
Monitored application has been uninstalled |
7706 |
KLNAG_EV_INV_OBS_APP_UNINSTALLED |
30 days |
New device has been added |
7708 |
KLNAG_EV_DEVICE_ARRIVAL |
30 days |
Device has been removed |
7709 |
KLNAG_EV_DEVICE_REMOVE |
30 days |
New device has been detected |
7710 |
KLNAG_EV_NAC_DEVICE_DISCOVERED |
30 days |
Device has been authorized |
7711 |
KLNAG_EV_NAC_HOST_AUTHORIZED |
30 days |
KSN Proxy has started. KSN availability check has completed successfully |
7719 |
KSNPROXY_STARTED_CON_CHK_OK |
30 days |
KSN Proxy has stopped |
7720 |
KSNPROXY_STOPPED |
30 days |
Third-party application has been installed |
7707 |
KLNAG_EV_INV_CMPTR_APP_INSTALLED |
30 days |
Third-party software update has been installed successfully |
7694 |
KLNAG_EV_3P_PATCH_INSTALLED_SUCCESSFULLY |
30 days |
Third-party software update installation has started |
7695 |
KLNAG_EV_3P_PATCH_INSTALL_STARTING |
30 days |
Installation of the software module update has started |
7700 |
KLNAG_EV_PATCH_INSTALL_STARTING |
30 days |
Windows Desktop Sharing: Application has been started |
7714 |
KLUSRLOG_EV_PROCESS_LAUNCHED |
30 days |
Windows Desktop Sharing: File has been modified |
7713 |
KLUSRLOG_EV_FILE_MODIFIED |
30 days |
Windows Desktop Sharing: File has been read |
7712 |
KLUSRLOG_EV_FILE_READ |
30 days |
Windows Desktop Sharing: Started |
7715 |
KLUSRLOG_EV_WDS_BEGIN |
30 days |
Windows Desktop Sharing: Stopped |
7716 |
KLUSRLOG_EV_WDS_END |
30 days |
Sudoers file successfully restored to reference value |
7725 |
KLNAG_EV_SUDOER_RESTORED |
30 days |
Root certificates installed |
7727 |
KLNAG_EV_ROOT_CERT_INSTALLED |
30 days |
Root certificates removed |
7729 |
KLNAG_EV_ROOT_CERT_REMOVED |
30 days |
Web Server started on host |
|
WEB_SERVER_STARTED |
30 days |
Web Server stopped on host |
|
WEB_SERVER_STOPPED |
30 days |
Using event selections
Event selections provide an onscreen view of named sets of events that are selected from the Administration Server database. These sets of events are grouped according to the following categories:
- By importance level—Critical events, Functional failures, Warnings, and Info events
- By time—Recent events
- By type—User requests and Audit events
You can create and view user-defined event selections based on the settings available, in the OSMP Console interface, for configuration.
Event selections are available in the OSMP Console, in the Monitoring & reporting section, by clicking Event selections.
By default, event selections include information for the last seven days.
Open Single Management Platform has a default set of event (predefined) selections:
- Events with different importance levels:
- Critical events
- Functional failures
- Warnings
- Informational messages
- User requests (events of managed applications)
- Recent events (over the last week)
- Audit events.
In Kaspersky Next XDR Expert, audit events related to service operations in your OSMP Console are displayed. These events are conditioned by actions of Kaspersky specialists. These events, for example include the following: logging in to Administration Server; Administration Server ports changing; Administration Server database backup; creation, modification, and deletion of user accounts.
You can also create and configure additional user-defined selections. In user-defined selections, you can filter events by the properties of the devices they originated from (device names, IP ranges, and administration groups), by event types and severity levels, by application and component name, and by time interval. It is also possible to include task results in the search scope. You can also use a simple search field where a word or several words can be typed. All events that contain any of the typed words anywhere in their attributes (such as event name, description, component name) are displayed.
Both for predefined and user-defined selections, you can limit the number of displayed events or the number of records to search. Both options affect the time it takes Open Single Management Platform to display the events. The larger the database is, the more time-consuming the process can be.
You can do the following:
- Edit properties of event selections
- Generate event selections
- View details of event selections
- Delete event selections
- Delete events from the Administration Server database
Creating an event selection
To create an event selection:
- In the main menu, go to Monitoring & reporting → Event selections.
- Click Add.
- In the New event selection window that opens, specify the settings of the new event selection. Do this in one or more of the sections in the window.
- Click Save to save the changes.
The confirmation window opens.
- To view the event selection result, keep the Go to selection result check box selected.
- Click Save to confirm the event selection creation.
If you kept the Go to selection result check box selected, the event selection result is displayed. Otherwise, the new event selection appears in the list of event selections.
Editing an event selection
To edit an event selection:
- In the main menu, go to Monitoring & reporting → Event selections.
- Select the check box next to the event selection that you want to edit.
- Click the Properties button.
An event selection settings window opens.
- Edit the properties of the event selection.
For predefined event selections, you can edit only the properties on the following tabs: General (except for the selection name), Time, and Access rights.
For user-defined selections, you can edit all properties.
- Click Save to save the changes.
The edited event selection is shown in the list.
Viewing a list of an event selection
To view an event selection:
- In the main menu, go to Monitoring & reporting → Event selections.
- Select the check box next to the event selection that you want to start.
- Do one of the following:
- If you want to configure sorting in the event selection result, do the following:
- Click the Reconfigure sorting and start button.
- In the displayed Reconfigure sorting for event selection window, specify the sorting settings.
- Click the name of the selection.
- Otherwise, if you want to view the list of events as they are sorted on the Administration Server, click the name of the selection.
- If you want to configure sorting in the event selection result, do the following:
The event selection result is displayed.
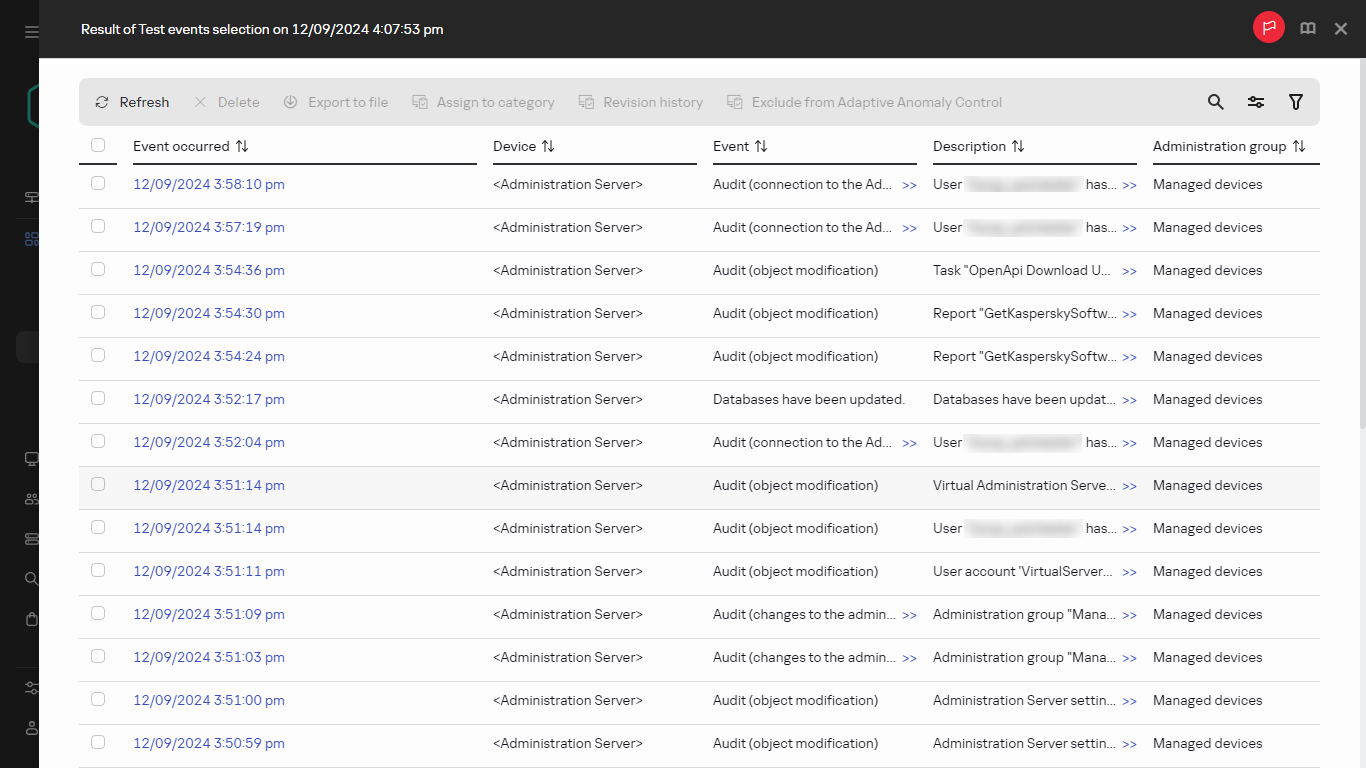
The event selection result
Exporting an event selection
Open Single Management Platform allows you to save an event selection and its settings to a KLO file. You can use this KLO file to import the saved event selection both to Kaspersky Security Center Windows and Kaspersky Security Center Linux.
Note that you can export only user-defined event selections. Event selections from the default set of Open Single Management Platform (predefined selections) cannot be saved to a file.
To export an event selection:
- In the main menu, go to Monitoring & reporting → Event selections.
- Select the check box next to the event selection that you want to export.
You cannot export multiple event selections at the same time. If you select more than one selection, the Export button will be disabled.
- Click the Export button.
- In the opened Save as window, specify the event selection file name and path, and then click the Save button.
The Save as window is displayed only if you use Google Chrome, Microsoft Edge, or Opera. If you use another browser, the event selection file is automatically saved in the Downloads folder.
Importing an event selection
Open Single Management Platform allows you to import an event selection from a KLO file. The KLO file contains the exported event selection and its settings.
To import an event selection:
- In the main menu, go to Monitoring & reporting → Event selections.
- Click the Import button, and then choose an event selection file that you want to import.
- In the opened window, specify the path to the KLO file, and then click the Open button. Note that you can select only one event selection file.
The event selection processing starts.
The notification with the import results appears. If the event selection is imported successfully, you can click the View import details link to view the event selection properties.
After a successful import, the event selection is displayed in the selection list. The settings of the event selection are also imported.
If the newly imported event selection has a name identical to that of an existing event selection, the name of the imported selection is expanded with the (<next sequence number>) index, for example: (1), (2).
Page top
Viewing details of an event
To view details of an event:
- Start an event selection.
- Click the time of the required event.
The Event properties window opens.
- In the displayed window, you can do the following:
- View the information about the selected event
- Go to the next event and the previous event in the event selection result
- Go to the device on which the event occurred
- Go to the administration group that includes the device on which the event occurred
- For an event related to a task, go to the task properties
Exporting events to a file
To export events to a file:
- Start an event selection.
- Select the check box next to the required event.
- Click the Export to file button.
The selected event is exported to a file.
Viewing an object history from an event
From an event of creation or modification of an object that supports revision management, you can switch to the revision history of the object.
To view an object history from an event:
- Start an event selection.
- Select the check box next to the required event.
- Click the Revision history button.
The revision history of the object is opened.
Deleting events
To delete one or several events:
- Start an event selection.
- Select the check boxes next to the required events.
- Click the Delete button.
The selected events are deleted and cannot be restored.
Deleting event selections
You can delete only user-defined event selections. Predefined event selections cannot be deleted.
To delete one or several event selections:
- In the main menu, go to Monitoring & reporting → Event selections.
- Select the check boxes next to the event selections that you want to delete.
- Click Delete.
- In the window that opens, click OK.
The event selection is deleted.
Setting the storage term for an event
Open Single Management Platform allows you to receive information about events that occur during the operation of Administration Server and Kaspersky applications installed on managed devices. Information about events is saved in the Administration Server database. You might need to store some events for a longer or shorter period than specified by default values. You can change the default settings of the storage term for an event.
If you are not interested in storing some events in the database of Administration Server, you can disable the appropriate setting in the Administration Server policy and Kaspersky application policy, or in the Administration Server properties (only for Administration Server events). This will reduce the number of event types in the database.
The longer the storage term for an event, the faster the database reaches its maximum capacity. However, a longer storage term for an event lets you perform monitoring and reporting tasks for a longer period.
To set the storage term for an event in the database of Administration Server:
- In the main menu, go to Assets (Devices) → Policies & profiles.
- Do one of the following:
- To configure the storage term of the events of Network Agent or of a managed Kaspersky application, click the name of the corresponding policy.
The policy properties page opens.
- To configure Administration Server events, in the main menu, click the settings icon () next to the name of the required Administration Server.
If you have a policy for the Administration Server, you can click the name of this policy instead.
The Administration Server properties page (or the Administration Server policy properties page) opens.
- To configure the storage term of the events of Network Agent or of a managed Kaspersky application, click the name of the corresponding policy.
- Select the Event configuration tab.
A list of event types related to the Critical section is displayed.
- Select the Functional failure, Warning, or Info section.
- In the list of event types in the right pane, click the link for the event whose storage term you want to change.
In the Event registration section of the window that opens, the Store in the Administration Server database for (days) option is enabled.
- In the edit box below this toggle button, enter the number of days to store the event.
- If you do not want to store an event in the Administration Server database, disable the Store in the Administration Server database for (days) option.
If you configure Administration Server events in Administration Server properties window and if event settings are locked in the Kaspersky Security Center Administration Server policy, you cannot redefine the storage term value for an event.
- Click OK.
The properties window of the policy is closed.
From now on, when Administration Server receives and stores the events of the selected type, they will have the changed storage term. Administration Server does not change the storage term of previously received events.
Page top
Blocking frequent events
This section provides information about managing frequent events blocking and about removing blocking of frequent events.
About blocking frequent events
A managed application, for example, Kaspersky Endpoint Security for Linux, installed on a single or several managed devices can send a lot of events of the same type to the Administration Server. Receiving frequent events may overload the Administration Server database and overwrite other events. Administration Server starts blocking the most frequent events when the number of all the received events exceeds the specified limit for the database.
Administration Server blocks the frequent events from receiving automatically. You cannot block the frequent events yourself, or choose which events to block.
If you want to find out if an event is blocked, you can view the notification list or you can check if this event is present in the Blocking frequent events section of the Administration Server properties. If the event is blocked, you can do the following:
- If you want to prevent overwriting the database, you can continue blocking such type of events from receiving.
- If you want, for example, to find the reason of sending the frequent events to the Administration Server, you can unblock frequent events and continue receiving the events of this type anyway.
- If you want to continue receiving the frequent events until they become blocked again, you can remove from blocking the frequent events.
Managing frequent events blocking
Administration Server blocks the automatic receiving of frequent events, but you can unblock and continue to receive frequent events. You can also block receiving frequent events that you unblocked before.
To manage frequent events blocking:
- In the main menu, click the settings icon () next to the name of the required Administration Server.
The Administration Server properties window opens.
- On the General tab, select the Blocking frequent events section.
- In the Blocking frequent events section:
- If you want to unblock the receiving of frequent events:
- Select the frequent events you want to unblock, and then click the Exclude button.
- Click the Save button.
- If you want to block receiving frequent events:
- Select the frequent events you want to block, and then click the Block button.
- Click the Save button.
- If you want to unblock the receiving of frequent events:
Administration Server receives the unblocked frequent events and does not receive the blocked frequent events.
Page top
Removing blocking of frequent events
You can remove blocking for frequent events and start receiving them until Administration Server blocks these frequent events again.
To remove blocking for frequent events:
- In the main menu, click the settings icon () next to the name of the required Administration Server.
The Administration Server properties window opens.
- On the General tab, select the Blocking frequent events section.
- In the Blocking frequent events section, select the frequent event types for which you want to remove blocking.
- Click the Remove from blocking button.
The frequent event is removed from the list of frequent events. Administration Server will receive events of this type.
Page top
Event processing and storage on the Administration Server
Information about events that occur during the operation of the application and managed devices is saved in the Administration Server database. Each event is attributed to a certain type and level of severity (Critical event, Functional failure, Warning, or Info). Depending on the conditions under which an event occurred, the application can assign different levels of severity to events of the same type.
You can view types and levels of severity assigned to events in the Event configuration section of the Administration Server properties window. In the Event configuration section, you can also configure processing of every event by the Administration Server:
- Registration of events on the Administration Server and in event logs of the operating system on a device and on the Administration Server.
- Method used for notifying the administrator of an event (for example, an SMS or email message).
In the Events repository section of the Administration Server properties window, you can edit the settings of events storage in the Administration Server database by limiting the number of event records and record storage term. When you specify the maximum number of events, the application calculates an approximate amount of storage space required for the specified number. You can use this approximate calculation to evaluate whether you have enough free space on the disk to avoid database overflow. The default capacity of the Administration Server database is 400,000 events. The maximum recommended capacity of the database is 45 million events.
The application checks the database every 10 minutes. If the number of events reaches the specified maximum value plus 10,000, the application deletes the oldest events so that only the specified maximum number of events remains.
When the Administration Server deletes old events, it cannot save new events to the database. During this period, information about events that were rejected is written to the operating system log. The new events are queued and then saved to the database after the deletion operation is complete. By default, the event queue is limited to 20,000 events. You can customize the queue limit by editing the KLEVP_MAX_POSTPONED_CNT flag value.
Page top
Notifications and device statuses
This section contains information on how to view notifications, configure notification delivery, use device statuses, and enable changing device statuses.
Using notifications
Notifications alert you about events and help you to speed up your responses to these events by performing recommended actions or actions you consider as appropriate.
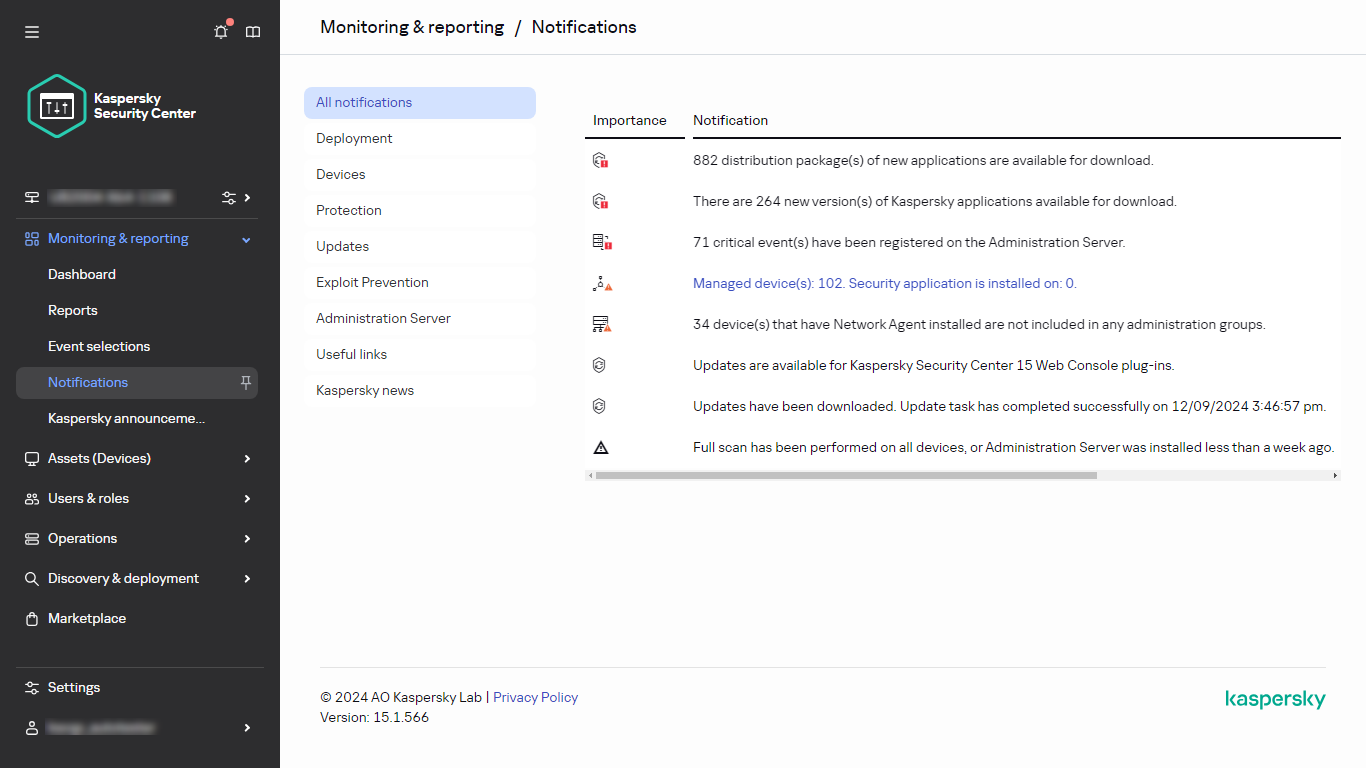
The list of notifications
Depending on the notification method chosen, the following types of notifications are available:
- Onscreen notifications
- Notifications by SMS
- Notifications by email
- Notifications by executable file or script
Onscreen notifications
Onscreen notifications alert you to events grouped by importance levels (Critical, Warning, and Informational).
Onscreen notification can have one of two statuses:
- Reviewed. It means you have performed recommended action for the notification, or you have assigned this status for the notification manually.
- Not Reviewed. It means you have not performed recommended action for the notification, or you have not assigned this status for the notification manually.
By default, the list of notifications include notifications in the Not Reviewed status.
You can monitor your organization's network viewing onscreen notifications and responding to them in a real time.
Notifications by email, by SMS, and by executable file or a script
Open Single Management Platform provides the capability to monitor your organization's network by sending notifications about any event that you consider important. For any event, you can configure notifications by email, by SMS, or by running an executable file or a script.
Upon receiving notifications by email or by SMS, you can decide on your response to an event. This response should be the most appropriate for your organization's network. By running an executable file or a script, you predefine a response to an event. You can also consider running an executable file or a script as a primary response to an event. After the executable file runs, you can take other steps to respond to the event.
Page top
Viewing onscreen notifications
You can view notifications onscreen in three ways:
- In the Monitoring & reporting → Notifications section. Here you can view notifications relating to predefined categories.
- In a separate window that can be opened no matter which section you are using at the moment. In this case, you can mark notifications as reviewed.
- In the Notifications by selected severity level widget on the Monitoring & reporting → Dashboard section. In the widget, you can view only notifications of events that are at the Critical and Warning importance levels.
You can perform actions, for example, you can response to an event.
To view notifications from predefined categories:
- In the main menu, go to Monitoring & reporting → Notifications.
The All notifications category is selected in the left pane, and in the right pane, all the notifications are displayed.
The list of notifications
- In the left pane, select one of the categories:
- Deployment
- Devices
- Protection
- Updates (this includes notifications about Kaspersky applications available for download and notifications about anti-virus database updates that have been downloaded)
- Exploit Prevention
- Administration Server (this includes events concerning only Administration Server)
- Useful links (this includes links to Kaspersky resources, for example, Kaspersky Technical Support, Kaspersky forum, license renewal page, or the Kaspersky IT Encyclopedia)
- Kaspersky news (this includes information about releases of Kaspersky applications)
A list of notifications of the selected category is displayed. The list contains the following:
- Icon related to the topic of the notification: deployment (
 ), protection (
 ), updates (
 ), device management (
 ), Exploit Prevention (
 ), Administration Server (
 ).
). - Notification importance level. Notifications of the following importance levels are displayed: Critical notifications (
 ), Warning notifications (
 ), Info notifications. Notifications in the list are grouped by importance levels.
 - Notification. This contains a description of the notification.
- Action. This contains a link to a quick action that we recommend you perform. For example, by clicking this link, you can proceed to the repository and install security applications on devices, or view a list of devices or a list of events. After you perform the recommended action for the notification, this notification is assigned the Reviewed status.
- Status registered. This contains the number of days or hours that have passed from the moment when the notification was registered on the Administration Server.
To view onscreen notifications in a separate window by importance level:
- In the upper-right corner of OSMP Console, click the flag icon (
 ).
).If the flag icon has a red dot, there are notifications that have not been reviewed.
A window opens listing the notifications. By default, the All notifications tab is selected and the notifications are grouped by importance level: Critical, Warning, and Info.
- Select the System tab.
The list of Critical (
) and Warning () importance levels notifications is displayed. The notification list includes the following:- Color marker. Critical notifications are marked in red. Warning notifications are marked in yellow.
- Icon indicating the topic of the notification: deployment (), protection (), updates (), device management (), Exploit Prevention (), Administration Server ().
- Description of the notification.
- Flag icon. The flag icon is gray if notifications have been assigned the Not Reviewed status. When you select the gray flag icon and assign the Reviewed status to a notification, the icon changes color to white.
- Link to the recommended action. When you perform the recommended action after clicking the link, the notification gets the Reviewed status.
- Number of days that have passed since the date when the notification was registered on the Administration Server.
- Select the More tab.
The list of Info importance level notifications is displayed.
The organization of the list is the same as for the list on the System tab (see the description above). The only difference is the absence of a color marker.
You can filter notifications by the date interval when they were registered on Administration Server. Use the Show filter check box to manage the filter.
To view onscreen notifications in the widget:
- In the Dashboard section, select Add or restore web widget.
- In the window that opens, click the Other category, select the Notifications by selected severity level widget, and click Add.
The widget now appears on the Dashboard tab. By default, the notifications of Critical importance level are displayed on the widget.
You can click the Settings button on the widget and change the widget settings to view notifications of the Warning importance level. Or, you can add another widget: Notifications by selected severity level, with a Warning importance level.
The list of notifications on the widget is limited by its size and includes two notifications. These two notifications relate to the latest events.
The notification list in the widget includes the following:
- Icon related to the topic of the notification: deployment (), protection (), updates (), device management (), Exploit Prevention (), Administration Server ().
- Description of the notification with a link to the recommended action. When you perform a recommended action after clicking the link, the notification gets the Reviewed status.
- Number of days or number of hours that have passed since the date when the notification was registered on the Administration Server.
- Link to other notifications. Upon clicking this link, you are transferred to the view of notifications in the Notifications section of the Monitoring & reporting section.
About device statuses
Open Single Management Platform assigns a status to each managed device. The particular status depends on whether the conditions defined by the user are met. In some cases, when assigning a status to a device, Open Single Management Platform takes into consideration the device's visibility flag on the network (see the table below). If Open Single Management Platform does not find a device on the network within two hours, the visibility flag of the device is set to Not Visible.
The statuses are the following:
- Critical or Critical/Visible
- Warning or Warning/Visible
- OK or OK/Visible
The table below lists the default conditions that must be met to assign the Critical or Warning status to a device, with all possible values.
Conditions for assigning a status to a device
Condition |
Condition description |
Available values |
|---|---|---|
Security application is not installed |
Network Agent is installed on the device, but a security application is not installed. |
|
Too many viruses detected |
Some viruses have been found on the device by a task for virus detection, for example, the Malware scan task, and the number of viruses found exceeds the specified value. |
More than 0. |
Real-time protection level differs from the level set by the Administrator |
The device is visible on the network, but the real-time protection level differs from the level set (in the condition) by the administrator for the device status. |
|
Malware scan has not been performed in a long time |
The device is visible on the network and a security application is installed on the device, but neither the Malware scan task nor a local scan task has been run within the specified time interval. The condition is applicable only to devices that were added to the Administration Server database 7 days ago or earlier. |
More than 1 day. |
Databases are outdated |
The device is visible on the network and a security application is installed on the device, but the anti-virus databases have not been updated on this device within the specified time interval. The condition is applicable only to devices that were added to the Administration Server database 1 day ago or earlier. |
More than 1 day. |
Not connected in a long time |
Network Agent is installed on the device, but the device has not connected to an Administration Server within the specified time interval, because the device was turned off. |
More than 1 day. |
Active threats are detected |
The number of unprocessed objects in the Active threats folder exceeds the specified value. |
More than 0 items. |
Restart is required |
The device is visible on the network, but an application requires the device restart longer than the specified time interval and for one of the selected reasons. |
More than 0 minutes. |
Incompatible applications are installed |
The device is visible on the network, but software inventory performed through Network Agent has detected incompatible applications installed on the device. |
|
Software vulnerabilities have been detected |
The device is visible on the network and Network Agent is installed on the device, but the Find vulnerabilities and required updates task has detected vulnerabilities with the specified severity level in applications installed on the device. |
|
License expired |
The device is visible on the network, but the license has expired. |
|
License expires soon |
The device is visible on the network, but the license will expire on the device in less than the specified number of days. |
More than 0 days. |
Check for Windows Update updates has not been performed in a long time |
The device is visible on the network, but the Perform Windows Update synchronization task has not been run within the specified time interval. |
More than 1 day. |
Invalid encryption status |
Network Agent is installed on the device, but the device encryption result is equal to the specified value. |
|
Mobile device settings do not comply with the policy |
The mobile device settings are other than the settings that were specified in the Kaspersky Endpoint Security for Android policy during the check of compliance rules. |
|
Unprocessed security issues detected |
Some unprocessed security issues have been found on the device. Security issues can be created either automatically, through managed Kaspersky applications installed on the client device, or manually by the administrator. |
|
Device status defined by application |
The status of the device is defined by the managed application. |
|
Device is out of disk space |
Free disk space on the device is less than the specified value, or the device could not be synchronized with the Administration Server. The Critical or Warning status is changed to the OK status when the device is successfully synchronized with the Administration Server and free space on the device is greater than or equal to the specified value. |
More than 0 MB. |
Device has become unmanaged |
During device discovery, the device was recognized as visible on the network, but more than three attempts to synchronize with the Administration Server failed. |
|
Protection is disabled |
The device is visible on the network, but the security application on the device has been disabled for longer than the specified time interval. In this case, the state of the security application is stopped or failure, and differs from the following: starting, running, or suspended. |
More than 0 minutes. |
Security application is not running |
The device is visible on the network and a security application is installed on the device but is not running. |
|
Open Single Management Platform allows you to set up automatic switching of the status of a device in an administration group when specified conditions are met. When the specified conditions are met, the client device is assigned one of the following statuses: Critical or Warning. When the specified conditions are not met, the client device is assigned the OK status.
Different statuses may correspond to different values of one condition. For example, by default, if the Databases are outdated condition has the More than 3 days value, the client device is assigned the Warning status; if the value is More than 7 days, the Critical status is assigned.
When Open Single Management Platform assigns a status to a device, for some conditions (see the Condition description column in the table above) the visibility flag is taken into consideration. For example, if a managed device was assigned the Critical status because the Databases are outdated condition was met, and later the visibility flag was set for the device, then the device is assigned the OK status.
Configuring the switching of device statuses
You can change conditions to assign the Critical or Warning status to a device.
To enable changing the device status to Critical:
- In the main menu, go to Assets (Devices) → Hierarchy of groups.
- In the list of groups that opens, click the link with the name of a group for which you want to change switching the device statuses.
- In the properties window that opens, select the Device status tab.
- In the left pane, select Critical.
- In the right pane, in the Set to Critical if these are specified section, enable the condition to switch a device to the Critical status.
You can change only settings that are not locked in the parent policy.
- Select the radio button next to the condition in the list.
- In the upper-left corner of the list, click the Edit button.
- Set the required value for the selected condition.
Values cannot be set for every condition.
- Click OK.
When specified conditions are met, the managed device is assigned the Critical status.
To enable changing the device status to Warning:
- In the main menu, go to Assets (Devices) → Hierarchy of groups.
- In the list of groups that opens, click the link with the name of a group for which you want to change switching the device statuses.
- In the properties window that opens, select the Device status tab.
- In the left pane, select Warning.
- In the right pane, in the Set to Warning if these are specified section, enable the condition to switch a device to the Warning status.
You can change only settings that are not locked in the parent policy.
- Select the radio button next to the condition in the list.
- In the upper-left corner of the list, click the Edit button.
- Set the required value for the selected condition.
Values cannot be set for every condition.
- Click OK.
When specified conditions are met, the managed device is assigned the Warning status.
Configuring notification delivery
You can configure notification about events occurring in Open Single Management Platform. Depending on the notification method chosen, the following types of notifications are available:
- Email—When an event occurs, Open Single Management Platform sends a notification to the email addresses specified.
- SMS—When an event occurs, Open Single Management Platform sends a notification to the phone numbers specified.
- Executable file—When an event occurs, the executable file is run on the Administration Server.
To configure notification delivery of events occurring in Open Single Management Platform:
- In the main menu, click the settings icon () next to the name of the required Administration Server.
The Administration Server properties window opens with the General tab selected.
- Click the Notification section, and in the right pane select the tab for the notification method you want:
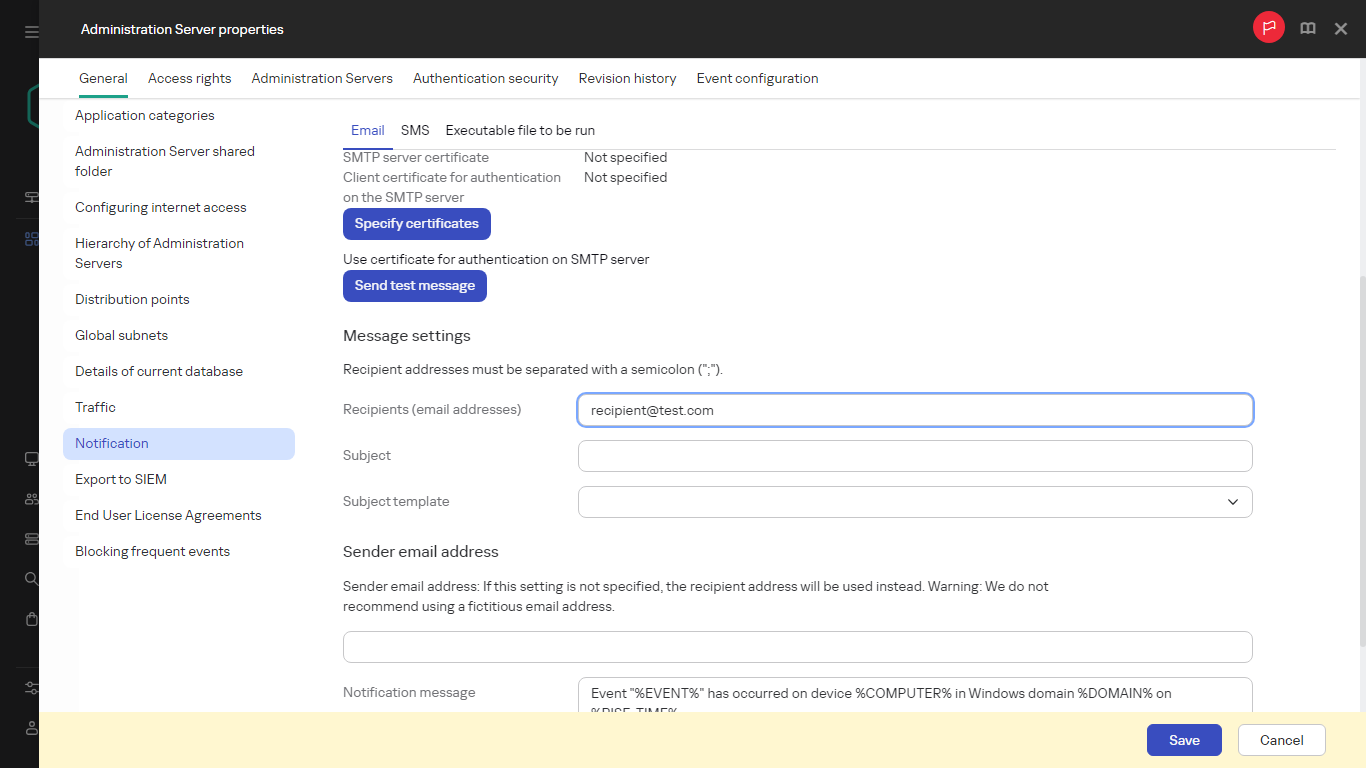
Selecting the notification method
- On the tab, define the notification settings.
- Click the OK button to close the Administration Server properties window.
The saved notification delivery settings are applied to all events that occur in Open Single Management Platform.
You can override notification delivery settings for certain events in the Event configuration section of the Administration Server settings, of a policy's settings, or of an application's settings.
Testing notifications
To check whether event notifications are sent, the application uses the notification of the EICAR test virus detection on client devices.
To verify sending of event notifications:
- Stop the real-time file system protection task on a client device and copy the EICAR test virus to that client device. Then, re-enable real-time protection of the file system.
- Run a scan task for client devices in an administration group or for specific devices, including one with the EICAR test virus.
If the scan task is configured correctly, the test virus will be detected. If notifications are configured correctly, you are notified that a virus has been detected.
To open a record of the test virus detection:
- In the main menu, go to Monitoring & reporting → Event selections.
- Click the Recent events selection name.
In the window that opens, the notification about the test virus is displayed.
The EICAR test virus contains no code that can do harm to your device. However, most manufacturers' security applications identify this file as a virus. You can download the test virus from the official EICAR website.
Page top
Event notifications displayed by running an executable file
Open Single Management Platform can notify the administrator about events on client devices by running an executable file. The executable file must contain another executable file with placeholders of the event to be relayed to the administrator (see the table below).
Placeholders for describing an event
Placeholder |
Placeholder description |
|---|---|
%SEVERITY% |
Event severity. Possible values:
|
%COMPUTER% |
Name of the device where the event occurred. Maximum length of the device name is 256 characters. |
%DOMAIN% |
Domain name of the device where the event occurred. |
%EVENT% |
Name of the event type. Maximum length of the event type name is 50 characters. |
%DESCR% |
Event description. Maximum length of the description is 1000 characters. |
%RISE_TIME% |
Event creation time. |
%KLCSAK_EVENT_TASK_DISPLAY_NAME% |
Task name. Maximum length of the task name is 100 characters. |
%KL_PRODUCT% |
Product name. |
%KL_VERSION% |
Product version number. |
%KLCSAK_EVENT_SEVERITY_NUM% |
Event severity number. Possible values:
|
%HOST_IP% |
IP address of the device where the event occurred. |
%HOST_CONN_IP% |
Connection IP address of the device where the event occurred. |
Example: Event notifications are sent by an executable file (such as script1.bat) inside which another executable file (such as script2.bat) with the %COMPUTER% placeholder is launched. When an event occurs, the script1.bat file is run on the administrator's device, which, in turn, runs the script2.bat file with the %COMPUTER% placeholder. The administrator then receives the name of the device where the event occurred. |
Kaspersky announcements
This section describes how to use, configure, and disable Kaspersky announcements.
About Kaspersky announcements
The Kaspersky announcements section (Monitoring & reporting → Kaspersky announcements) keeps you informed by providing information related to your version of Open Single Management Platform and the managed applications installed on the managed devices. Open Single Management Platform periodically updates the information in the section by removing outdated announcements and adding new information.
Open Single Management Platform shows only those Kaspersky announcements that relate to the currently connected Administration Server and the Kaspersky applications installed on the managed devices of this Administration Server. The announcements are shown individually for any type of Administration Server—primary, secondary, or virtual.
Administration Server must have an internet connection to receive Kaspersky announcements.
The announcements include information of the following types:
- Security-related announcements
Security-related announcements are intended to keep the Kaspersky applications installed in your network up-to-date and fully functional. The announcements may include information about critical updates for Kaspersky applications, fixes for found vulnerabilities, and ways to fix other issues in Kaspersky applications. By default, security-related announcements are enabled. If you do not want to receive the announcements, you can disable this feature.
To show you the information that corresponds to your network protection configuration, Open Single Management Platform sends data to Kaspersky cloud servers and receives only those announcements that relate to the Kaspersky applications installed in your network. The data set that can be sent to the servers is described in the End User License Agreement that you accept when you install Kaspersky Security Center Administration Server.
- Marketing announcements
Marketing announcements include information about special offers for your Kaspersky applications, advertisements, and news from Kaspersky. Marketing announcements are disabled by default. You receive this type of announcements only if you enabled Kaspersky Security Network (KSN). You can disable marketing announcements by disabling KSN.
To show you only relevant information that might be helpful in protecting your network devices and in your everyday tasks, Open Single Management Platform sends data to Kaspersky cloud servers and receives the appropriate announcements. The data set that can be sent to the servers is described in the Processed Data section of the KSN Statement.
New information is divided into the following categories, according to importance:
- Critical info
- Important news
- Warning
- Info
When new information appears in the Kaspersky announcements section, OSMP Console displays a notification label that corresponds to the importance level of the announcements. You can click the label to view this announcement in the Kaspersky announcements section.
You can specify the Kaspersky announcements settings, including the announcement categories that you want to view and where to display the notification label. If you do not want to receive announcements, you can disable this feature.
Page top
Specifying Kaspersky announcements settings
In the Kaspersky announcements section, you can specify the Kaspersky announcements settings, including the categories of the announcements that you want to view and where to display the notification label.
To configure Kaspersky announcements:
- In the main menu, go to Monitoring & reporting → Kaspersky announcements.
- Click the Settings link.
The Kaspersky announcement settings window opens.
- Specify the following settings:
- Select the importance level of the announcements that you want to view. The announcements of other categories will not be displayed.
- Select where you want to see the notification label. The label can be displayed in all console sections, or in the Monitoring & reporting section and its subsections.
- Click the OK button.
The Kaspersky announcement settings are specified.
Disabling Kaspersky announcements
The Kaspersky announcements section (Monitoring & reporting → Kaspersky announcements) keeps you informed by providing information related to your version of Open Single Management Platform and managed applications installed on the managed devices. If you do not want to receive Kaspersky announcements, you can disable this feature.
The Kaspersky announcements include two types of information: security-related announcements and marketing announcements. You can disable the announcements of each type separately.
To disable security-related announcements:
- In the main menu, click the settings icon () next to the name of the required Administration Server.
The Administration Server properties window opens.
- On the General tab, select the Kaspersky announcements section.
- Switch the toggle button to the Security-related announcements are disabled position.
- Click the Save button.
Kaspersky announcements are disabled.
Marketing announcements are disabled by default. You receive marketing announcements only if you enabled Kaspersky Security Network (KSN). You can disable this type of announcement by disabling KSN.
To disable marketing announcements:
- In the main menu, click the settings icon () next to the name of the required Administration Server.
The Administration Server properties window opens.
- On the General tab, select the KSN Proxy settings section.
- Disable the Use Kaspersky Security Network Enabled option.
- Click the Save button.
Marketing announcements are disabled.
Cloud Discovery
Open Single Management Platform allows you to monitor the use of cloud services on managed devices running Windows and to block access to cloud services that you consider unwanted. Cloud Discovery tracks user attempts to gain access to these services through both browsers and desktop applications. It also tracks user attempts to gain access to cloud services over unencrypted connections (for example, using the HTTP protocol). This feature helps you to detect and halt the use of cloud services by shadow IT.
The blocking capability is available only if you activated Open Single Management Platform under a Kaspersky Next EDR Optimum or Kaspersky Next XDR Expert license.
The blocking capability is available only if you use Kaspersky Endpoint Security 11.2 for Windows or later. Earlier versions of the security application only allow you to monitor the use of cloud services.
You can enable the Cloud Discovery feature and select the security policies or profiles for which you want to enable the feature. You can also enable or disable the feature separately in each security policy or profile. You can block access to cloud services that you do not want users to access.
To be able to block access to unwanted cloud services, make sure that the following prerequisites are met:
- You use Kaspersky Endpoint Security 11.2 for Windows or later. Earlier versions of the security application only allow you to monitor the use of cloud services.
- You have purchased a Kaspersky Next license tier that includes the ability to block access to unwanted cloud services. For details, refer to Kaspersky Next Help.
The Cloud Discovery widget and the Cloud Discovery reports display information about successful and blocked attempts to gain access to cloud services. The widget also displays the risk level of each cloud service. Open Single Management Platform gets information about the use of cloud services from all of the managed devices that are protected only by the security policies or profiles that have the feature enabled.
Enabling Cloud Discovery by using the widget
The Cloud Discovery feature allows you to get information about the use of cloud services from all of the managed devices that are protected only by the security policies that have the feature enabled. You can enable or disable Cloud Discovery for the Kaspersky Endpoint Security for Windows policy only.
There are two ways to enable the Cloud Discovery feature:
- By using the Cloud Discovery widget.
- In the properties of the Kaspersky Endpoint Security for Windows policy.
For details on how to enable the Cloud Discovery feature in the Kaspersky Endpoint Security for Windows policy properties, refer to the Cloud Discovery section of Kaspersky Endpoint Security for Windows Help.
Note that you can disable the Cloud Discovery feature in the Kaspersky Endpoint Security for Windows policy parameters only.
To enable Cloud Discovery, you must have the Write right in the General features: Basic functionality functional area.
To enable the Cloud Discovery feature by using the Cloud Discovery widget:
- Go to Open Single Management Platform.
- In the main menu, go to Monitoring & reporting → Dashboard.
- On the Cloud Discovery widget, click the Enable button.
If you have Kaspersky Endpoint Security for Windows version 12.4 installed, enable the Cloud Discovery feature in the Kaspersky Endpoint Security for Windows policy properties. For details, refer to the Cloud Discovery section of Kaspersky Endpoint Security for Windows Help.
If you have Kaspersky Endpoint Security for Windows earlier than version 12.4, update the Kaspersky Endpoint Security for Windows plug-in to version 12.5.
- In the Enable Cloud Discovery window that opens, select the security policies for which you want to enable the feature, and then click the Enable button.
The following policy settings will be enabled automatically: Inject script into web traffic to interact with web pages, Web Session monitor, and Encrypted connections scan.
The Cloud Discovery feature is enabled and the widget is added to the dashboard.
Page top
Adding the Cloud Discovery widget to the dashboard
You can add the Cloud Discovery widget to the dashboard to monitor the use of cloud services on managed devices.
To add the Cloud Discovery widget to the dashboard, you must have the Write right in the General features: Basic functionality functional area.
To add the Cloud Discovery widget to the dashboard:
- Go to Open Single Management Platform.
- In the main menu, go to Monitoring & reporting → Dashboard.
- Click the Add or restore web widget button.
- In the list of available widgets, click the chevron icon () next to the Other category.
- Select the Cloud Discovery widget, and then click the Add button.
If the Cloud Discovery feature is disabled, follow the instructions in the Enabling Cloud Discovery by using the widget section.
The selected widget is added at the end of the dashboard.
Page top
Viewing information about the use of cloud services
You can view the Cloud Discovery widget that shows information about attempts to gain access to cloud services. The widget also displays the risk level of each cloud service. Open Single Management Platform gets information about the use of cloud services from all of the managed devices that are protected only by the security profiles that have the feature enabled.
Before viewing, make sure that:
- The Cloud Discovery widget is added to the dashboard.
- The Cloud Discovery feature is enabled.
- You have the Read right in the General features: Basic functionality functional area.
To view the Cloud Discovery widget:
- Go to Open Single Management Platform.
- In the main menu, go to Monitoring & reporting → Dashboard.
The Cloud Discovery widget is displayed on the dashboard.
- On the left side of the Cloud Discovery widget, select a category of cloud services.
The table on the right side of the widget displays up to five services from the selected category, to which users most often try to gain access. Both successful and blocked attempts are counted.
- On the right side of the widget, select a specific service.
The table below displays up to ten devices that most often attempt to gain access to the service. In this table, you can generate two types of reports: report on successful access attempts and report on blocked access attempts.
In addition, in this table you can block access to the cloud service for a specific device.
The widget displays the requested information.
From the displayed widget, you can do the following:
- Proceed to the Monitoring & reporting → Reports section, to view the Cloud Discovery reports.
- Block or allow access to the selected cloud service.
The blocking capability is available only if you activated Open Single Management Platform under a Kaspersky Next EDR Optimum or Kaspersky Next XDR Expert license.
The blocking capability is available only if you use Kaspersky Endpoint Security 11.2 for Windows or later. Earlier versions of the security application only allow you to monitor the use of cloud services.
Page top
Risk level of a cloud service
For each cloud service, Cloud Discovery provides you with a risk level. The risk level helps you determine which services do not fit the security requirements of your organization. For example, you may want to take the risk level into account when deciding whether to block access to a certain service.
The risk level is an estimated index and does not say anything about the quality of a cloud service or about the service manufacturer. The risk level is simply a recommendation from Kaspersky experts.
Risk levels of cloud services are displayed in the Cloud Discovery widget and in the list of all monitored cloud services.
Page top
Blocking access to unwanted cloud services
You can block access to cloud services that you do not want users to access. You can also allow access to cloud services that were previously blocked.
Among other considerations, you may want to take the risk level into account when deciding whether to block access to a certain service.
You can block or allow access to cloud services for a security policy or profile.
There are two ways to block access to unwanted cloud services:
- By using the Cloud Discovery widget.
In this case, you can block access to the services one by one.
- In the properties of the Kaspersky Endpoint Security for Windows policy.
In this case, you can block access to the services one by one or block an entire category at once.
For details on how to enable the Cloud Discovery feature in the Kaspersky Endpoint Security for Windows policy properties, refer to the Cloud Discovery section of Kaspersky Endpoint Security for Windows Help.
To block or allow access to a cloud service by using the widget:
- Open the Cloud Discovery widget, and then select the required cloud service.
- In the Top 10 devices that use the service pane, find the security policy or profile for which you want to block or allow the service.
- On the required line, in the Access status in policy or profile column, do any of the following:
- To block the service, select Blocked in the drop-down list.
- To allow the service, select Allowed in the drop-down list.
- Click the Save button.
Access to the selected service is blocked or allowed for the security policy or profile.
Page top
Exporting events to SIEM systems
This section describes how to configure export of events to the SIEM systems.
Configuring event export to SIEM systems
Open Single Management Platform allows configuring event export to SIEM systems by one of the following methods: export to any SIEM system that uses Syslog format or export of events to SIEM systems directly from the Kaspersky Security Center database. When you complete this scenario, Administration Server sends events to a SIEM system automatically.
Prerequisites
Before you start configuration export of events in the Open Single Management Platform:
- Learn more about the methods of event export.
- Make sure that you have the values of system settings.
You can perform the steps of this scenario in any order.
The process of export of events to a SIEM system consists of the following steps:
- Configuring the SIEM system to receive events from Open Single Management Platform
How-to instructions: Configuring event export in a SIEM system
- Selecting the events that you want to export to the SIEM system
Mark which events you want to export to the SIEM system. First, mark the general events that occur in all managed Kaspersky applications. Then, you can mark the events for specific managed Kaspersky applications.
- Configuring export of events to the SIEM system
You can export events by using one of the following methods:
- Using TCP/IP, UDP or TLS over TCP protocols
- Using export of events directly from the Kaspersky Security Center database (a set of public views is provided in the Kaspersky Security Center database; you can find the description of these public views in the klakdb.chm document)
Results
After configuring export of events to a SIEM system you can view export results if you selected events which you want to export.
Before you begin
When setting up automatic export of events in the Open Single Management Platform, you must specify some of the SIEM system settings. It is recommended that you check these settings in advance in order to prepare for setting up Open Single Management Platform.
To successfully configure automatic sending of events to a SIEM system, you must know the following settings:
About event export
Open Single Management Platform allows you to receive information about events that occur during the operation of Administration Server and Kaspersky applications installed on managed devices. Information about events is saved in the Administration Server database.
You can use event export within centralized systems that deal with security issues on an organizational and technical level, provide security monitoring services, and consolidate information from different solutions. These are SIEM systems, which provide real-time analysis of security alerts and events generated by network hardware and applications, or Security Operation Centers (SOCs).
These systems receive data from many sources, including networks, security, servers, databases, and applications. SIEM systems also provide functionality to consolidate monitored data in order to help you avoid missing critical events. In addition, the systems perform automated analysis of correlated events and alerts in order to notify the administrators of immediate security issues. Alerting can be implemented through a dashboard or can be sent through third-party channels such as email.
The process of exporting events from Open Single Management Platform to external SIEM systems involves two parties: an event sender, Open Single Management Platform, and an event receiver, a SIEM system. To successfully export events, you must configure this in your SIEM system and in the Open Single Management Platform. It does not matter which side you configure first. You can either configure the transmission of events in the Open Single Management Platform, and then configure the receipt of events by the SIEM system, or vice versa.
Syslog format of event export
You can send events in the Syslog format to any SIEM system. Using the Syslog format, you can relay any events that occur on the Administration Server and in Kaspersky applications that are installed on managed devices. When exporting events in the Syslog format, you can select exactly which types of events will be relayed to the SIEM system.
Receipt of events by the SIEM system
The SIEM system must receive and correctly parse the events received from Open Single Management Platform. For these purposes, you must properly configure the SIEM system. The configuration depends on the specific SIEM system utilized. However, there are a number of general steps in the configuration of all SIEM systems, such as configuring the receiver and the parser.
Page top
About configuring event export in a SIEM system
The process of exporting events from Open Single Management Platform to external SIEM systems involves two parties: an event sender—Open Single Management Platform and an event receiver—SIEM system. You must configure the export of events in your SIEM system and in the Open Single Management Platform.
The settings that you specify in the SIEM system depend on the particular system that you are using. Generally, for all SIEM systems you must set up a receiver and, optionally, a message parser to parse received events.
Setting up the receiver
To receive events sent by Open Single Management Platform, you must set up the receiver in your SIEM system. In general, the following settings must be specified in the SIEM system:
- Export protocol
A message transfer protocol, either UDP, TCP, or TLS, over TCP. This protocol must be the same as the protocol you specified in Open Single Management Platform.
- Port
Specify the port number to connect to Open Single Management Platform. This port must be the same as the port you specify in Open Single Management Platform during configuration with a SIEM system.
- Data format
Specify the Syslog format.
Depending on the SIEM system that you use, you may have to specify some additional receiver settings.
The figure below shows the receiver setup screen in ArcSight.
Receiver setup in ArcSight
Message parser
Exported events are passed to SIEM systems as messages. These messages must be properly parsed so that information on the events can be used by the SIEM system. Message parsers are part of the SIEM system; they are used to split the contents of the message into the relevant fields, such as event ID, severity, description, parameters. This enables the SIEM system to process events received from Open Single Management Platform so that they can be stored in the SIEM system database.
Marking of events for export to SIEM systems in Syslog format
After enabling automatic export of events, you must select which events will be exported to the external SIEM system.
You can configure export of events in the Syslog format to an external system based on one of the following conditions:
- Marking general events. If you mark events to export in a policy, in the settings of an event, or in the Administration Server settings, the SIEM system will receive the marked events that occurred in all applications managed by the specific policy. If exported events were selected in the policy, you will not be able to redefine them for an individual application managed by this policy.
- Marking events for a managed application. If you mark events to export for a managed application installed on a managed device, the SIEM system will receive only the events that occurred in this application.
About marking events for export to SIEM system in the Syslog format
After enabling automatic export of events, you must select which events will be exported to the external SIEM system.
You can configure export of events in the Syslog format to an external system based on one of the following conditions:
- Marking general events. If you mark events to export in a policy, in the settings of an event, or in the Administration Server settings, the SIEM system will receive the marked events that occurred in all applications managed by the specific policy. If exported events were selected in the policy, you will not be able to redefine them for an individual application managed by this policy.
- Marking events for a managed application. If you mark events to export for a managed application installed on a managed device, the SIEM system will receive only the events that occurred in this application.
Marking events of a Kaspersky application for export in the Syslog format
If you want to export events that occurred in a specific managed application installed on the managed devices, mark the events for export in the application policy. In this case, the marked events are exported from all of the devices included in the policy scope.
To mark events for export for a specific managed application:
- In the main menu, go to Assets (Devices) → Policies & profiles.
- Click the policy of the application for which you want to mark events.
The policy settings window opens.
- Go to the Event configuration section.
- Select the check boxes next to the events that you want to export to a SIEM system.
- Click the Mark for export to SIEM system by using Syslog button.
You can also mark an event for export to a SIEM system in the Event registration section, which opens by clicking the link of the event.
- A check mark (
 ) appears in the Syslog column of the event or events that you marked for export to the SIEM system.
 - Click the Save button.
The marked events from the managed application are ready to be exported to a SIEM system.
You can mark which events to export to a SIEM system for a specific managed device. If previously exported events were marked in an application policy, you will not be able to redefine the marked events for a managed device.
To mark events for export for a managed device:
- In the main menu, go to Assets (Devices) → Managed devices.
The list of managed devices is displayed.
- Click the link with the name of the required device in the list of managed devices.
The properties window of the selected device is displayed.
- Go to the Applications section.
- Click the link with the name of the required application in the list of applications.
- Go to the Event configuration section.
- Select the check boxes next to the events that you want to export to SIEM.
- Click the Mark for export to SIEM system by using Syslog button.
Also, you can mark an event for export to a SIEM system in the Event registration section, that opens by clicking the link of the event.
- A check mark () appears in the Syslog column of the event or events that you marked for export to the SIEM system.
From now on, Administration Server sends the marked events to the SIEM system if export to the SIEM system is configured.
Marking general events for export in Syslog format
You can mark general events that Administration Server will export to SIEM systems by using the Syslog format.
To mark general events for export to a SIEM system:
- Do one of the following:
- In the main menu, click the settings icon () next to the name of the required Administration Server.
- In the main menu, go to Assets (Devices) → Policies & profiles, and then click a link of a policy.
- In the main menu, click the settings icon (
- In the window that opens, go to the Event configuration tab.
- Click Mark for export to SIEM system by using Syslog.
Also, you can mark an event for export to SIEM system in the Event registration section, that opens by clicking the link of the event.
- A check mark () appears in the Syslog column of the event or events that you marked for export to the SIEM system.
From now on, Administration Server sends the marked events to the SIEM system if export to the SIEM system is configured.
About exporting events using Syslog format
You can use the Syslog format to export to SIEM systems the events that occur in Administration Server and other Kaspersky applications installed on managed devices.
Syslog is a standard for message logging protocol. It permits separation of the software that generates messages, the system that stores them, and the software that reports and analyzes them. Each message is labeled with a facility code, indicating the software type that generates the message, and is assigned a severity level.
The Syslog format is defined by Request for Comments (RFC) documents published by the Internet Engineering Task Force (internet standards). The RFC 5424 standard is used to export the events from Open Single Management Platform to external systems.
In Open Single Management Platform, you can configure export of the events to the external systems using the Syslog format.
The export process consists of two steps:
- Enabling automatic event export. At this step, Open Single Management Platform is configured so that it sends events to the SIEM system. Open Single Management Platform starts sending events immediately after you enable automatic export.
- Selecting the events to be exported to the external system. At this step, you select which event to export to the SIEM system.
Configuring Open Single Management Platform for export of events to a SIEM system
To export events to a SIEM system, you have to configure the process of export in Open Single Management Platform.
To configure export to SIEM systems in the OSMP Console:
- In the main menu, click the settings icon () next to the name of the required Administration Server.
The Administration Server properties window opens.
- On the General tab, select the SIEM section.
- Click the Settings link.
The Export settings section opens.
- Specify the settings in the Export settings section:
- If you want, you can export archived events from the Administration Server database and set the start date from which you want to start the export of archived events:
- Click the Set the export start date link.
- In the section that opens, specify the start date in the Date to start export from field.
- Click the OK button.
- Switch the option to the Automatically export events to SIEM system database Enabled position.
- To check that the SIEM system connection is successfully configured, click the Check connection button.
The connection with the SIEM system server is established, and a test event is sent. The connection status will be displayed.
- Click the Save button.
Export to a SIEM system is configured. From now on, if you configured the receiving of events in a SIEM system, Administration Server exports the marked events to a SIEM system. If you set the start date of export, Administration Server also exports the marked events stored in the Administration Server database from the specified date.
Exporting events directly from the database
You can retrieve events directly from the Open Single Management Platform database without having to use the Open Single Management Platform interface. You can either query the public views directly and retrieve the event data, or create your own views on the basis of existing public views and address them to get the data you need.
Public views
For your convenience, a set of public views is provided in the Open Single Management Platform database. You can find the description of these public views in the klakdb.chm document.
The v_akpub_ev_event public view contains a set of fields that represent the event parameters in the database. In the klakdb.chm document you can also find information on public views corresponding to other Open Single Management Platform entities, for example, devices, applications, or users. You can use this information in your queries.
This section contains instructions for executing an SQL query by means of the klsql2 utility and a query example.
To create SQL queries or database views, you can also use any other program for working with databases. Information on how to view the parameters for connecting to the Open Single Management Platform database, such as instance name and database name, is given in the corresponding section.
Executing an SQL query by using the klsql2 utility
This article describes how to use the klsql2 utility, and execute an SQL query by using this utility. Use klsql2 utility version that is included in your Open Single Management Platform version installed.
To use the klsql2 utility:
- Go to the directory where Administration Server is installed. The default installation path is /opt/kaspersky/ksc64/sbin.
- In this directory, create a blank file with the .sql extension.
- Open the created .sql file in any text editor.
- In the .sql file, type the SQL query that you want, and then save the file.
- On the device with Administration Server installed, in the command line, type the following command to execute the SQL query from the .sql file and save the results to the result.xml file:
sudo ./klsql2 -i src.sql -u <username> -p <password> -o result.xmlwhere
<username>and<password>are credentials of the user account that has access to the database. - If required, enter the login and password of the user account that has access to the database.
- Open the newly created result.xml files to view the SQL query results.
You can edit the .sql file and create any SQL query to the public views. Then, from the command line, execute your query and save the results to a file.
Example of an SQL query in the klsql2 utility
This section shows an example of an SQL query, executed by means of the klsql2 utility.
The following examples illustrate retrieval of the events that occurred on devices during the last seven days, and display of the events ordered by the time they occur, the most recent events are displayed first.
Example for Microsoft SQL Server: SELECT e.nId, /* event identifier */ e.tmRiseTime, /* time, when the event occurred */ e.strEventType, /* internal name of the event type */ e.wstrEventTypeDisplayName, /* displayed name of the event */ e.wstrDescription, /* displayed description of the event */ e.wstrGroupName, /* name of the group, where the device is located */ h.wstrDisplayName, /* displayed name of the device, on which the event occurred */ CAST(((h.nIp / 16777216) & 255) AS varchar(4)) + '.' + CAST(((h.nIp / 65536) & 255) AS varchar(4)) + '.' + CAST(((h.nIp / 256) & 255) AS varchar(4)) + '.' + CAST(((h.nIp) & 255) AS varchar(4)) as strIp /* IP address of the device, on which the event occurred */ FROM v_akpub_ev_event e INNER JOIN v_akpub_host h ON h.nId=e.nHostId WHERE e.tmRiseTime>=DATEADD(Day, -7, GETUTCDATE()) ORDER BY e.tmRiseTime DESC |
Example for PostgreSQL: SELECT "e"."nId", /* event identifier */ "e"."tmRiseTime", /* time, when the event occurred */ "e"."strEventType", /* internal name of the event type */ "e"."wstrEventTypeDisplayName", /* displayed name of the event */ "e"."wstrDescription", /* displayed description of the event */ "e"."wstrGroupName", /* displayed description of the event */ "h"."wstrDisplayName", /* displayed name of the device, on which the event occurred */ ( CAST((("h"."nIp" / 16777216 )& 255 ) AS VARCHAR(4)) || '.' || CAST((("h"."nIp" / 65536 )& 255 ) AS VARCHAR(4)) || '.' || CAST((("h"."nIp" / 256 )& 255 ) AS VARCHAR(4)) || '.' || CAST((("h"."nIp" )& 255 ) AS VARCHAR(4)) ) AS "strIp" /* IP address of the device, on which the event occurred */ FROM "v_akpub_ev_event" AS "e" INNER JOIN "v_akpub_host" AS "h" ON "h"."nId" = "e"."nHostId" WHERE "e"."tmRiseTime" >= NOW() AT TIME ZONE 'utc' + make_interval(days => CAST(-7 AS INT)) ORDER BY "e"."tmRiseTime" DESC ; |
Example for MySQL or MariaDB: SELECT `e`.`nId`, /* event identifier */ `e`.`tmRiseTime`, /* time, when the event occurred */ `e`.`strEventType`, /* internal name of the event type */ `e`.`wstrEventTypeDisplayName`, /* displayed name of the event */ `e`.`wstrDescription`, /* displayed description of the event */ `e`.`wstrGroupName`, /* device group name */ `h`.`wstrDisplayName`, /* displayed name of the device, on which the event occurred */ CONCAT( LEFT(CAST(((`h`.`nIp` DIV 1677721) & 255) AS CHAR), 4), '.', LEFT(CAST(((`h`.`nIp` DIV 65536) & 255) AS CHAR), 4), '.', LEFT(CAST(((`h`.`nIp` DIV 256) & 255) AS CHAR), 4), '.', LEFT(CAST(((`h`.`nIp`) & 255) AS CHAR), 4) ) AS `strIp` /* IP address of the device, on which the event occurred */ FROM `v_akpub_ev_event` AS `e` INNER JOIN `v_akpub_host` AS `h` ON `h`.`nId` = `e`.`nHostId` WHERE `e`.`tmRiseTime` >= ADDDATE( UTC_TIMESTAMP( ) , INTERVAL -7 DAY) ORDER BY `e`.`tmRiseTime` DESC ; |
Viewing the Open Single Management Platform database name
If you want to access Open Single Management Platform database by means of the MySQL, or MariaDB database management tools, you must know the name of the database in order to connect to it from your SQL script editor.
To view the name of the Open Single Management Platform database:
- In the main menu, click the settings icon () next to the name of the required Administration Server.
The Administration Server properties window opens.
- On the General tab, select the Details of current database section.
The database name is specified in the Database name field. Use the database name to address the database in your SQL queries.
Viewing export results
You can control for successful completion of the event export procedure. To do this, check whether messages with export events are received by your SIEM system.
If the events sent from Open Single Management Platform are received and properly parsed by your SIEM system, configuration on both sides is done properly. Otherwise, check the settings you specified in Open Single Management Platform against the configuration in your SIEM system.
The figure below shows the events exported to ArcSight. For example, the first event is a critical Administration Server event: "Device status is Critical".
The representation of export events in the SIEM system varies according to the SIEM system you use.
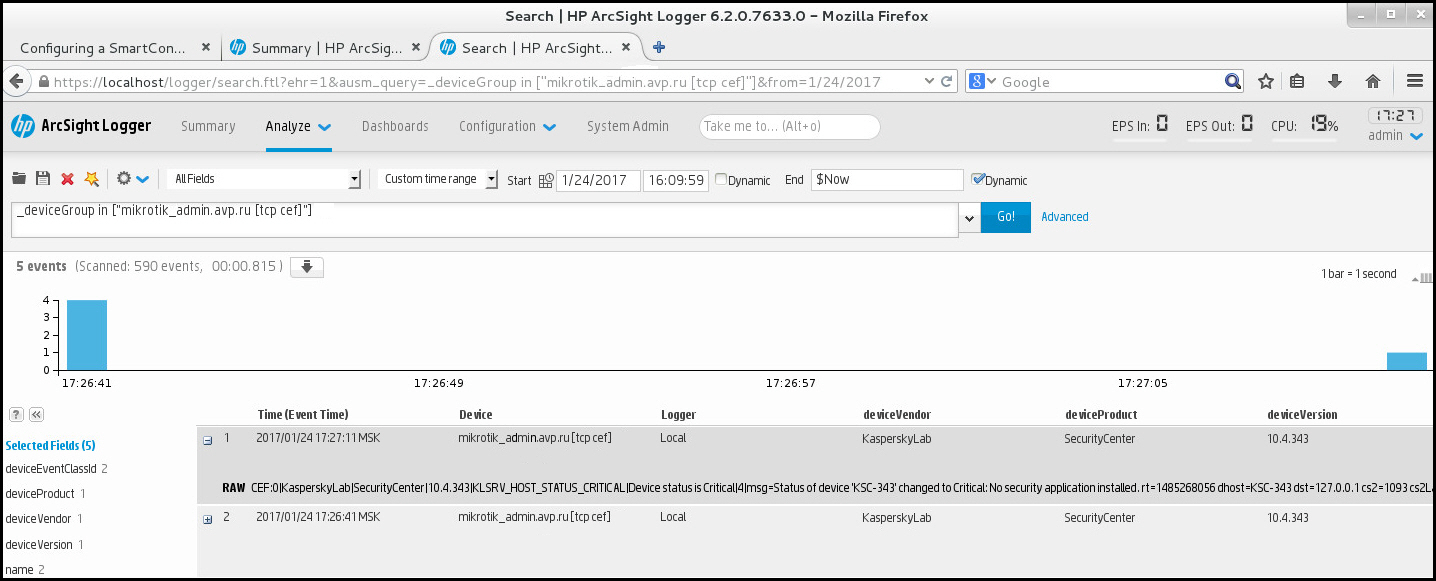
Example of events
Managing object revisions
This section contains information about object revision management. Open Single Management Platform allows you to track object modification. Every time you save changes made to an object, a revision is created. Each revision has a number.
Application objects that support revision management include:
- Administration Server properties
- Policies
- Tasks
- Administration groups
- User accounts
- Installation packages
You can perform the following actions on object revisions:
- View a selected revision (available only for policies)
- Roll back changes made to an object to a selected revision
- Save revisions as a JSON file (available only for policies)
In the properties window of any object that supports revision management, the Revision history section displays a list of object revisions with the following details:
- Revision—Object revision number.
- Time—Date and time the object was modified.
- User—Name of the user who modified the object.
- User device IP address—IP address of the device from which the object was modified.
- Web Console IP address—IP address of OSMP Console with which the object was modified.
- Action—Action performed on the object.
- Description—Description of the revision related to the change made to the object settings.
By default, the object revision description is blank. To add a description to a revision, select the relevant revision and click the Edit description button. In the opened window, enter some text for the revision description.
Viewing and saving a policy revision
Open Single Management Platform allows you to view which modifications were made to a policy over a certain period, as well as save information about these modifications in a file.
Viewing and saving a policy revision are available if the corresponding management web plug-in supports this functionality.
To view a policy revision:
- In the main menu, go to Assets (Devices) → Policies & profiles.
- Click the policy for the revision that you want to view, and then go to the Revision history section.
- In the list of policy revisions, click the number of the revision that you want to view.
If the revision size is more than 10 MB, you will not be able to view it by using OSMP Console. You will be prompted to save the selected revision to a JSON file.
If the revision size does not exceed 10 MB, a report in the HTML format with the settings of the selected policy revision is displayed. Since the report is displayed in a pop-up window, ensure that pop-ups are allowed in your browser.
To save a policy revision to a JSON file,
In the list of policy revisions, select the revision that you want to save, and then click Save to file.
The revision is saved to a JSON file.
Page top
Rolling back an object to a previous revision
You can roll back changes made to an object, if necessary. For example, you may have to revert the settings of a policy to their state on a specific date.
To roll back changes made to an object:
- In the object's properties window, open the Revision history tab.
- In the list of object revisions, select the revision that you want to roll back changes for.
- Click the Roll back button.
- Click OK to confirm the operation.
The object is now rolled back to the selected revision. The list of object revisions displays a record of the action that was taken. The revision description displays information about the number of the revision to which you reverted the object.
Rolling back operation is available only for policy and task objects.
Deletion of objects
This section provides information about deleting objects and viewing information about objects after they are deleted.
You can delete objects, including the following:
- Policies
- Tasks
- Installation packages
- Virtual Administration Servers
- Users
- Security groups
- Administration groups
When you delete an object, information about it remains in the database. The storage term for information about the deleted objects is the same as the storage term for object revisions (the recommended term is 90 days). You can change the storage term only if you have the Modify permission in the Deleted objects area of rights.
About deletion of client devices
When you delete a managed device from an administration group, the application moves the device to the Unassigned devices group. After device deletion, the installed Kaspersky applications—Network Agent and any security application, for example Kaspersky Endpoint Security—remain on the device.
Kaspersky Next XDR Expert handles the devices in the Unassigned devices group according to the following rules:
- If you have configured device moving rules and a device meets the criteria of a moving rule, the device is automatically moved to an administration group according to the rule.
- The device is stored in the Unassigned devices group and automatically removed from the group according to the device retention rules.
The device retention rules do not affect the devices that have one or more drives encrypted with full disk encryption. Such devices are not deleted automatically—you can only delete them manually. If you need to delete a device with an encrypted drive, first decrypt the drive, and then delete the device.
When you delete a device with encrypted drive, the data required to decrypt the drive is also deleted. If you select the I understand the risk and want to delete the selected device(s) check box in the confirmation window that opens when you delete such devices (either from the Unassigned devices or the Managed Devices group), it means that you are aware of the subsequent data deletion.
To decrypt the drive, the following conditions must be met:
- The device is reconnected to Administration Server to restore the data required to decrypt the drive.
- The device user remembers the decryption password.
- The security application that was used to encrypt the drive, for example Kaspersky Endpoint Security for Windows, is still installed on the device.
If the drive was encrypted by Kaspersky Disk Encryption technology, you can also try recovering data by using the FDERT Restore Utility.
When you delete a device from the Unassigned devices group manually, the application removes the device from the list. After device deletion, the installed Kaspersky applications (if any) remain on the device. Then, if the device is still visible to Administration Server and you have configured regular network polling, Kaspersky Next XDR Expert discovers the device during the network polling and adds it back to the Unassigned devices group. Therefore, it is reasonable to delete a device manually only if the device is invisible to Administration Server.
Page top
Downloading and deleting files from Quarantine and Backup
This section gives information on how to download and how to delete files from Quarantine and Backup in OSMP Console.
Downloading files from Quarantine and Backup
You can download files from Quarantine and Backup only if one of the two conditions is met: either the Do not disconnect from the Administration Server option is enabled in the settings of the device, or a connection gateway is in use. Otherwise, the downloading is not possible.
To save a copy of file from Quarantine or Backup to a hard drive:
- Do one of the following:
- If you want to save a copy of file from Quarantine, in the main menu, go to Operations → Repositories → Quarantine.
- If you want to save a copy of file from Backup, in the main menu, go to Operations → Repositories → Backup.
- In the window that opens, select a file that you want to download and click Download.
The download starts. A copy of the file that had been placed in Quarantine on the client device is saved to the specified folder.
Page top
About removing objects from the Quarantine, Backup, or Active threats repositories
When Kaspersky security applications installed on client devices place objects to the Quarantine, Backup, or Active threats repositories, they send the information about the added objects to the Quarantine, Backup, or Active threats sections in Open Single Management Platform. When you open one of these sections, select an object from the list and click the Remove button, Open Single Management Platform performs one of the following actions or both actions:
- Removes the selected object from the list
- Deletes the selected object from the repository
The action to perform is defined by the Kaspersky application that placed the selected object to the repository. The Kaspersky application is specified in the Entry added by field. Refer to the documentation of the Kaspersky application for details about which action is to be performed.
Page top
Operation diagnostics of the Kaspersky Next XDR Expert components
This section describes how to obtain diagnostic information about Kaspersky Next XDR Expert components.
Obtaining log files of Kaspersky Next XDR Expert components
KDT allows you to obtain log files that contain diagnostic information about Kaspersky Next XDR Expert components and the Kubernetes cluster, to troubleshoot problems on your own or with the help of Kaspersky Technical Support.
Kaspersky Next XDR Expert generates the log file names according to the following template: pod_name.container_name.log. Here, pod_name is a Kubernetes pod name, and container_name is a Kubernetes container name.
To obtain log files of Kaspersky Next XDR Expert components and management web plug-ins,
On the administrator host where the KDT utility is located, run the following command:
./kdt logs get <flags>
Where <flags> are the parameters of the command that allow you to configure the logging result.
You can specify the following logging parameters:
--app <list_of_components>—Obtain logs for the listed Kaspersky Next XDR Expert components.--auto-dest-dir—Obtain logs and save them to the kdt-default-logs-<current_date_and_time> directory that is automatically created in the current directory. If the logging period is not specified, you obtain diagnostic information for the last hour.For example, if you want to obtain logs for the last hour for Administration Server and KUMA, and then save these logs to the automatically created directory, run the following command:
./kdt logs get --app ksc,kuma --auto-dest-dir-d, --destination <file_path>—Obtain logs and save them to the specified file.-D,--destination-dir <directory_path>—Obtain logs and save them to the specified directory that must be created beforehand. If the<directory_path>is empty, logs are saved in the standard output stream (stdout). If the logging period is not specified, you obtain diagnostic information for the last hour.--to-archive—Obtain logs and save them to the kdt-default-logs-<current_date_and_time>.tar.gz archive. The created archive is saved to the current directory. If the logging period is not specified, you obtain diagnostic information for the last hour.--last=<hours>h—Obtain logs for the specified number of hours up to date.For example, if you want to get an archive with logs for the last three hours, run the following command:
./kdt logs get --to-archive --last=3h--start=<date_and_time>—Obtain logs starting from the specified date and time (in the Unix timestamp format) to the present time, or to the date and time specified in the--endparameter.For example, if you want to obtain logs starting from 03/26/2024 10:00:00 to the present time, and then save them to the kdt-default-logs-<current_date_and_time> directory created in the current directory, run the following command:
./kdt logs get --auto-dest-dir --start=1711447200--end=<date_and_time>—Obtain logs starting from the date and time specified in the--startparameter to the date and time specified in the--endparameter (in the Unix timestamp format). If the--startparameter in not specified, logs are obtained for the last hour before the date and time specified by the--endparameter.For example, if you want to save logs for the 10 minutes (from 03/26/2024 10:00:00 to 03/26/2024 10:10:00) to the logs directory, run the following command:
./kdt logs get -D ./logs/ start=1711447200 --end=1711447800
To view the available logging parameters, you can run one of the following commands:
./kdt logs get -h./kdt logs get --help
Viewing OSMP metrics
OSMP allows you to monitor metrics for further analysis of the operability and performance of its components.
You can view OSMP metrics in one of the following ways:
- By using the
<monitoring_host>.<smp_domain>URLIn this case, you have to view the metrics by using Grafana, a tool for data visualization that is installed with Kaspersky Next XDR Expert. To access metrics through Grafana, you must specify the Grafana credentials in the configuration file (the
grafana_admin_userandgrafana_admin_passwordparameters). - By using your tools
In this case, you have to configure your tools to obtain the metrics from the <api_host>.<smp_domain>/metrics API address.
The <api_host> and <monitoring_host> are host names, and <smp_domain> is a domain name. These parameters constitute the FQDNs of Kaspersky Next XDR Expert services and are set in the configuration file when deploying Kaspersky Next XDR Expert.
Kaspersky Next XDR Expert provides its metrics in the OpenMetrics format.
If you want to view information about the performance of the KUMA Core, storage, collectors, and correlators, you have to view KUMA metrics.
Page top
Monitoring the state of Kaspersky Next XDR Expert components
The dashboard provides a graphical display of the state of each Kaspersky Next XDR Expert component.
For example, you can view the following component parameters:
- Usage of requests and limits of CPU
- Usage of requests of CPU and RAM
- Usage of CPU and RAM by containers
- Allocation of the component resources by containers
- Network performance indicators: bandwidth, packet loss, network errors, number of received and received packets
To view diagnostic information on the dashboard:
- Go to the
<monitoring_host>.<smp_domain>URL.The
<monitoring_host>is a host name, and<smp_domain>is a domain name. These parameters constitute the FQDN of the Kaspersky Next XDR Expert monitoring service and are set in the configuration file when deploying Kaspersky Next XDR Expert. - Enter the Grafana credentials that you specified in the configuration file (the
grafana_admin_userandgrafana_admin_passwordparameters). - In the menu, go to Kubernetes → Views → Pods.
- In the namespace drop-down list, select the component for which you want to view the diagnostic information.
- You can also specify other parameters to customize the dashboard view.
The dashboard with diagnostic information about the selected Kaspersky Next XDR Expert component is displayed.
Page top
Storing diagnostic information about Kaspersky Next XDR Expert components
Diagnostic information about Kaspersky Next XDR Expert components is stored on a worker node of the Kubernetes cluster. The amount of disk space required for storing this information is specified in the configuration file before the deployment of Kaspersky Next XDR Expert (the loki_size parameter).
To check the disk space used to store diagnostic information about Kaspersky Next XDR Expert components,
On the administrator host where the KDT utility is located, run the following command:
./kdt invoke observability --action getPvSize
The amount of the allocated free disk space in gigabytes is displayed.
You can also increase the disk space used to store diagnostic information about Kaspersky Next XDR Expert components after the deployment of Kaspersky Next XDR Expert. You cannot set the amount of disk space to less than the previously specified amount.
To increase the disk space used to store diagnostic information about Kaspersky Next XDR Expert components,
On the administrator host where the KDT utility is located, run the following command and specify the required free disk space in gigabytes (for example, "50Gi"):
./kdt invoke observability --action setPvSize --param loki_size="<new_disk_space_amount>Gi"
The amount of free disk space allocated to store diagnostic information about Kaspersky Next XDR Expert components is changed.
Page top
Obtaining trace files
KDT allows you to obtain trace files for Kaspersky Next XDR Expert and OSMP components, to troubleshoot infrastructure on your own or with the help of Kaspersky Technical Support.
Trace files are downloaded in OpenTelemetry format.
To obtain the trace file for the Kaspersky Next XDR Expert or OSMP component:
- On the administrator host where the KDT utility is located, run the following command and specify the path to the file where you want to save the list of trace files:
./kdt traces find -o <output_file_path>The list of trace files with their IDs is output to the specified file.
- To output a particular trace file run the following command and specify the output file path and the trace file ID:
./kdt traces get -o <output_file_path> --traсe-id=<trace_ID>
The specified trace file is saved.
Page top
Logging the launches of custom actions
KDT allows you to obtain the history of the custom action launches for a specific Kaspersky Next XDR Expert component, as well as the logs of a particular custom action launch. The obtained logs may help you to investigate problems with the operation of the Kaspersky Next XDR Expert components on your own or with the help of Kaspersky Technical Support.
To obtain the history of the custom action launches for a specific Kaspersky Next XDR Expert component,
On the administrator host where the KDT utility is located, run the following command, and then specify the component name:
./kdt state -H <component_name>
The list of executed custom actions with their IDs is displayed.
To obtain logs of the custom action launch,
On the administrator host where the KDT utility is located, run the following command, and then specify the component name and the ID of the custom action launch:
./kdt state -l <component_name> -m <custom_action_launch_ID>
The logs of the specified custom action launch are displayed.
Page top
Multitenancy
Kaspersky Next XDR Expert supports a multitenancy mode. This mode enables the main administrator to provide the Kaspersky Next XDR Expert functionality to multiple clients independently, or to separate assets, application settings, and objects for different offices. Each client or office is isolated from others and is called a tenant.
Typically, the multitenancy mode is used in the following cases:
- A service provider has a number of client organizations and wants to provide the Kaspersky Next XDR Expert functionality to each client organization independently. To do this, the service provider administrator can create a tenant for each client organization.
- An administrator of a large enterprise might want to isolate assets, application settings, and objects for the offices or organization units and manage the offices or organization units independently. To do this, the administrator can create a tenant for each office or organization unit.
The multitenancy mode has the following features:
- Tenant isolation
- Cross-tenant scenarios
Tenant isolation
A tenant is isolated and managed independently from other tenants. Only users who have assigned access rights to the tenant can work within this tenant and manage it. The tenant's data, resources, and assets cannot be accessed by an administrator of another tenant unless the main administrator grants the corresponding access rights to the administrator explicitly.
For each tenant, you define a number of objects, including the following ones:
- Assets
The asset list is unique for each tenant. Each asset can belong to one tenant only.
- Users and their access rights
- Events, alerts, and incidents
- Playbooks
- Integration with other Kaspersky applications, services, and third-party solutions
Cross-tenant scenarios
All tenants are arranged into a tenant hierarchy. By default, the tenant hierarchy contains a pre-created Root tenant at the top of the hierarchy. No other tenants can be created at the same level as the Root tenant. You create a new tenant as a child to any existing tenant, including the Root tenant. The tenant hierarchy can have any number of nesting levels.
The tenant hierarchy is used to provide cross-tenant scenarios, including the following ones:
- Inheritance and copying
A child tenant receives the following objects from the parent tenant:
- Users and their access rights
Access rights are inherited down by the hierarchy and cannot be revoked on a lower level of the hierarchy.
- Tenant settings, including integration settings, and playbooks
Tenant settings and playbooks are copied from a parent tenant to its child tenant. After the child tenant is created, you can reconfigure the copied settings to meet the requirements of the new tenant.
- Users and their access rights
- Licensing
A license key for Kaspersky Next XDR Expert is applied at the level of the primary Administration Server that is bound to the Root tenant. Then, the license key is automatically applied to all of the tenants in the hierarchy.
User roles
Kaspersky Next XDR Expert provides you a predefined set of user roles. You grant user rights to manage tenants by assigning user roles to the users.
User role |
User right |
||
|---|---|---|---|
Read |
Write |
Delete |
|
Main administrator |
|
|
|
Tenant administrator |
|
|
|
SOC administrator |
|
|
|
Tier 1 analyst |
|
|
|
Tier 2 analyst |
|
|
|
Junior analyst |
|
|
|
SOC manager |
|
|
|
Approver |
|
|
|
Observer |
|
|
|
Interaction with NCIRCC |
|
|
|
Tenants and Kaspersky Security Center Administration Servers
You can bind tenants to Kaspersky Security Center Administration Servers, physical or virtual. A link between a tenant and an Administration Server allows you to combine features of both solutions—Kaspersky Next XDR Expert and Open Single Management Platform.
Tenant filter in the application interface
In the Kaspersky Next XDR Expert interface, you can configure object lists to display only those objects that relate to the tenants that you select. The tenant filter applies to the following objects:
- Alerts in the Alerts section
- Incidents in the Incidents section
- Events in the Threat hunting section
- Playbooks in the Playbooks section
When you apply the tenant filter, the new settings are applied to all of the object types across the interface and in both consoles—OSMP Console and KUMA Console.
About binding tenants to Administration Servers
You can bind tenants to Kaspersky Security Center Administration Servers. A link between a tenant and an Administration Server allows you to relate the assets managed by the Administration Server to the tenant.
You cannot bind tenants to virtual Administration Servers, only to physical ones.
Tenants can have subtenants; therefore they are arranged into a tenant hierarchy. Administration Servers can have secondary Administration Servers; therefore they are arranged into a Server hierarchy. You cannot bind an arbitrary tenant to an arbitrary Server because this may lead to an illegal binding. For example, a user may not have access rights to a tenant in the tenant hierarchy, but the same user may have access rights to the devices of this tenant. This might happen if this user has access rights to the Administration Server 2 which is primary to the Administration Server 1 bound to the tenant. Therefore, by default, this user has inherited access rights to the Administration Server 1 and its managed devices. To eliminate such a situation, tenants and Administration Servers can only be bound to each other according to the binding rules.
There are two types of bindings:
- Explicit binding
This binding type is established when you select an Administration Server to which you want to bind a tenant.
- Inherited binding
When you establish explicit binding to an Administration Server that has secondary Administration Servers, the secondary Administration Servers are bound to the tenant through the inherited binding type. Therefore a tenant may be bound to several Administration Servers.
Binding rules:
- The Root tenant is always bound to the root Administration Server, you cannot remove this binding.
- A tenant may be not bound to an Administration Server. Such a tenant can have subtenants, and these subtenants can be bound to Administration Servers.
- You can bind two Administration Servers which are arranged into a hierarchy only to two tenants which are arranged into a hierarchy too, and only if the hierarchy of Administration Servers matches the hierarchy of tenants.
- An Administration Server may be bound only to one tenant, explicitly or through the inherited binding type.
- When you bind a tenant to an Administration Server explicitly:
- If the Administration Server was bound to another tenant explicitly, this binding is automatically removed.
- If the Administration Server has secondary Administration Servers, the secondary Administration Servers are bound to the new tenant through the inherited binding type excluding those Administration Servers that were bound to their tenants explicitly. Before this operation, Kaspersky Next XDR Expert checks whether or not all of the new bindings are legal. If they are not, the binding cannot be established.
- When you remove an explicit binding between a tenant and an Administration Server (unbind Administration Server), the Administration Server and all of its secondary Administration Servers (if any) are automatically bound through the inherited binding type to the tenant to which the primary Administration Server of the selected Administration Server is bound. If some of the secondary Administration Servers are bound to their tenants explicitly, those Administration Servers keep their bindings.
- When you add a new Administration Server to the hierarchy, the Administration Server is automatically bound through the inherited binding type to the tenant to which the Server's primary Administration Server is bound.
- When you remove an Administration Server from the hierarchy and the Administration Server has an explicit binding to a tenant, this binding is removed.
Configuring integration with Open Single Management Platform
You can bind tenants to Kaspersky Security Center Administration Servers. A link between a tenant and an Administration Server allows you to relate the assets managed by the Administration Server to the tenant.
You cannot bind tenants to virtual Administration Servers, only to physical ones.
Before you begin:
- Make sure that you are familiar with the binding rules.
- You have created the tenant that you want to bind to an Administration Server.
- If required, you have added the secondary Administration Server that you want to bind to the tenant.
To bind a tenant to an Administration Server or unbind it from the Server, you must have a role that grants the Write access right to the Tenants and Integrations functional areas.
Binding a tenant to an Administration Server
To bind a tenant to an Administration Server:
- In the main menu, go to Settings → Tenants.
The tenant list opens. The list contains only the tenants to which you have at least the Read access right.
- Click the name of the required tenant.
The tenant properties window opens.
- On the Settings tab, select the check box next to the tenant that you want to bind to an Administration Server, and then click the Bind Administration Server button.
- In the window that opens, select the Administration Server that you want to bind to the tenant.
If you want to add a new Server to the hierarchy or delete an existing one, you can do it in the Administration Server properties.
- Click the Bind button.
The binding process may take a while. You can track this process in the Binding status column of the Administration Server list in the tenant properties window.
Unbinding a tenant from an Administration Server
To unbind a tenant from an Administration Server:
- In the main menu, go to Settings → Tenants.
The tenant list opens. The list contains only the tenants to which you have at least the Read access right.
- Click the name of the required tenant.
The tenant properties window opens.
- On the Settings tab, select the check box next to the tenant that you want to unbind from an Administration Server, and then click the Unbind button.
Viewing and editing tenants
You can use tenants to provide the Kaspersky Next XDR Expert functionality to a client organization independently, or to separate assets, application settings, and objects for different offices.
To view or edit a tenant's properties:
- In the main menu, go to Settings → Tenants.
The tenant list opens. The list contains only the tenants to which you have at least the Read access right.
- Click the name of the required tenant.
The tenant's properties window opens. If you have only Read access right to this tenant, the properties will be opened in read-only mode. If you have the Write access right, you will be able to modify the tenant's properties.
- Modify the tenant's properties, and then click the Save button.
The tenant's properties are modified and saved.
General
The General tab contains general information about the tenant. You can modify the tenant's name and description.
Settings
The Settings tab contains the following sections:
- Kaspersky integrations
This section allows you to configure integration settings for the Kaspersky applications that you want to integrate into Kaspersky Next XDR Expert for the current tenant.
- Third-party integrations
This section allows you to configure integration settings for third-party applications that you want to integrate into Kaspersky Next XDR Expert for the current tenant.
- Detection and response
This section allows you to configure settings and objects related to threat detection and response:
- Retention period
Retention periods for alerts and incidents depend on the Kaspersky Next XDR Expert license that you use.
- Email templates
- Segmentation rules
- Aggregation rules
- Incident management
- Mail server connection
- Retention period
You do not need to configure the settings of the shared tenant.
Roles
The Roles tab lists the users who have access rights to the tenant. You can change this list and assign user roles to the users.
Adding new tenants
Before you begin, read general information about tenants.
To add child tenants, you must have the Read and Write rights in the Tenants functional area on the parent tenant or on a tenant of a higher level in the tenant hierarchy.
To add a new tenant:
- In the main menu, go to Settings → Tenants.
- Select the check box next to the parent tenant. The new tenant will be created as a child to the selected tenant.
- Click the Add button.
- In the Add tenant window that opens, enter the name of the new tenant.
- If necessary, add a description for the new tenant.
- Click the Add button.
The new tenant appears in the tenant list.
A child tenant inherits the following objects from the parent tenant:
- Users and their access rights
- Integration settings
After a tenant is created, you can reconfigure the inherited objects to meet the requirements of the new tenant.
Assigning roles to users in a tenant
You can assign XDR roles to the Kaspersky Next XDR Expert users to provide them with sets of access rights in a tenant.
To do this, you must have one of the following XDR roles in the tenant in which you want to assign roles to users: Main administrator, SOC Administrator, or Tenant Administrator.
Since tenants are isolated and managed independently from other tenants, only users who have assigned access rights to the tenant can work within this tenant and manage it.
Access rights are inherited down in the hierarchy and cannot be revoked on a lower level of the hierarchy.
To assign roles to а user in a tenant:
- In the main menu, go to Settings → Tenants.
The list of tenants is displayed on the screen.
- Click the name of the required tenant.
The tenant's properties window opens.
- Go to the User roles tab, and then click Add user.
- In the window that opens, do the following:
- In the User field, enter the user name or email address.
- Select the check boxes next to the roles that you want to assign to the user.
You can select several roles, if necessary.
- Click the Add button.
The window is closed, and the user is displayed in the list of the users.
- Click the Save button.
The user is added to the tenant and assigned roles. If necessary, you can edit the user roles by clicking the user name, and then performing the actions described at steps 4–5.
Page top
Deleting tenants
You can delete only one tenant at a time. However, if the selected tenant has child tenants, they will be deleted as well. The playbooks related to the tenant will be deleted, and information about alerts and incidents related to the tenant will become unavailable.
When you delete a tenant in OSMP Console, the following changes occur in KUMA Console:
- Tenant, its resources and assets are deleted.
- Sorage partitions related to the tenant are deleted.
- Raw events become unavailable.
- Services status of the deleted tenants change to Gray.
To delete a tenant, you must have the Read and Write rights in the Tenants functional area on the selected tenant.
You cannot delete the Root tenant and the tenants that were migrated from the integrated applications (for example, Kaspersky Unified Monitoring and Analysis Platform) and marked as non-deletable in those applications.
To delete a tenant:
- In the main menu, go to Settings → Tenants.
The tenant list opens. The list contains only the tenants to which you have at least the Read access right.
- Select the check box next to the tenant that you want to delete. If the selected tenant has child tenants, they will be selected automatically and you cannot unselect them.
- Click the Delete button.
- Confirm the operation by typing the name of the tenant that you want to delete. If the tenant has child tenants, they are listed as tenants to be deleted as well.
The selected tenant, its child tenants (if any), and related objects are deleted.
Configuring a connection to SMTP
You can configure email notifications about events occurring in Kaspersky Next XDR Expert via Kaspersky Security Center Administration Server and an external SMTP server. To do this, you must configure connection settings to an SMTP server.
To configure connection to an SMTP server:
- In the main menu, go to Settings → Tenants.
The list of tenants is displayed on the screen.
- Click the name of the required tenant.
The tenant's properties window opens.
- Go to the Settings tab, and then in the Detection and response section, click Mail server connection.
- In the right pane, click the View properties button.
The Administration Server properties window opens with the General tab selected.
The window displays properties of the primary Administration Server and SMTP settings for the primary Administration Server, no matter to which Administration Server the tenant is bound.
- Configure the parameters, as described at step 2 in Configuring notifications delivery.
After you configure connection to an SMTP server, the users will start receiving email messages from Kaspersky Next XDR Expert.
Page top
Configuring notifications templates
After you configure the connection to an SMTP server, you can configure templates for email notifications about events occurring in Kaspersky Next XDR Expert.
To edit notifications templates, you must have one of the following XDR roles: Main administrator, Tenant administrator, or SOC administrator.
When you deploy Kaspersky Next XDR Expert, you have the templates for email notifications in the Root tenant. If you create a child tenant, it automatically copies the settings from the parent tenant. Since child and parent settings are not related, the changes you make in a child tenant settings do not affect the settings in the parent tenant, and vice versa.
To configure email notifications templates:
- In the main menu, go to Settings → Tenants.
The list of tenants is displayed.
- Click the name of the required tenant.
The tenant's properties window opens.
- Go to the Settings tab, and then in the Detection and response section, click Email templates.
The table of the event types for which you can configure notifications templates is displayed.
- If at step 2 you selected the Root tenant, in the Enter server name field, enter the address to be used in links to alerts and incidents in the email messages.
- In the Event type column of the table, click the name of the notification template that you want to edit: Creating a new alert, Assigning an alert to an operator, Automatic creation of a new incident, Assigning an incident to an operator.
- In the Edit email template window that opens, do the following:
- If you want to enable email notifications for the selected event type, move the toggle button to the Enabled position in the Status field.
By default, email notifications are disabled. You can enable email notifications from the table of the event types by moving the toggle button to the Enabled position.
- In the Subject field, specify the subject of the email notification.
You can access the alert fields, incident fields, and KUMA normalized event fields, for example,
New incident in OSMP: {{ .InternalID }}, {{ .Name }}. - In the Template field, write the email notification message.
Example of the email notification message.
You can access the alert fields, incident fields, and KUMA normalized event fields, and use HTML tags.
When writing a template, you can use the following functions:
date—Defines date and time format. The function takes the time in milliseconds (UNIX time) as the first parameter. The second parameter can be used to pass the time in the RFC standard format. The time zone cannot be changed.limit—Limits the number of objects returned by therangefunction.link_alert—Generates a link to the alert, with the URL specified in the Enter server name field.link_incident—Generates a link to the incident, with the URL specified in the Enter server name field.link—Takes the form of a link that the user can open when he/she receives the notification email.
- In the Recipients field, specify one or several email address for sending notifications.
- If necessary, in the Description field, write a description of notification template.
- If you want to enable email notifications for the selected event type, move the toggle button to the Enabled position in the Status field.
- Click the Confirm button.
The Edit email template window is closed.
- Click the Save button to save the changes.
The template for email notifications is edited and configured. When the selected types of events occur in Kaspersky Next XDR Expert, the template notifications are sent to the email addresses that you specified.
Page top
Contact Technical Support
This section describes how to get technical support and the terms on which it is available.
How to get technical support
If you can't find a solution to your issue in the Kaspersky Next XDR Expert documentation or in any of the sources of information about Kaspersky Next XDR Expert, contact Kaspersky Customer Service. Technical Support specialists will answer all your questions about installing and using Kaspersky Next XDR Expert.
Kaspersky provides support of Kaspersky Next XDR Expert during its lifecycle (see the application support lifecycle page). Before contacting Technical Support, please read the support rules.
You can contact Technical Support in one of the following ways:
- By visiting the Technical Support website
- By sending a request to Technical Support from the Kaspersky CompanyAccount portal
Technical support via Kaspersky CompanyAccount
Kaspersky CompanyAccount is a portal for companies that use Kaspersky applications. The Kaspersky CompanyAccount portal is designed to facilitate interaction between users and Kaspersky specialists through online requests. You can use Kaspersky CompanyAccount to track the status of your online requests and store a history of them as well.
You can register all of your organization's employees under a single account on Kaspersky CompanyAccount. A single account lets you centrally manage electronic requests from registered employees to Kaspersky and also manage the privileges of these employees via Kaspersky CompanyAccount.
The Kaspersky CompanyAccount portal is available in the following languages:
- English
- Spanish
- Italian
- German
- Polish
- Portuguese
- Russian
- French
- Japanese
To learn more about Kaspersky CompanyAccount, visit the Technical Support website.
Page top
Known issues
Kaspersky Next XDR Expert has a number of limitations that are not critical to the operation of the application:
- After you delete a non-root tenant that was bound to an Administration Server, an attempt to open the KSC section in a tenant properties window returns an error. Contact technical support to resolve the issue. To prevent the issue, unbind the tenant from an Administration Server before deleting it.
- After you add or delete tenants in the Tenants section (Settings → Tenants), the changes to the tenant list are not synchronized with the tenant filter in the Threat hunting section. The tenant filter still contains the deleted tenants and does not contain the added ones.
- After you shut down the infrastructure servers of the Kubernetes cluster and then start them again, an attempt to sign in to OSMP Console returns en error.
- When you configure export to SIEM systems in OSMP Console, and select the UDP protocol, an error is returned after you click the Check connection button, since UDP does not establish a connection and the data delivery cannot be guaranteed.
- When you write a jq expression while creating a segmentation rule, an error about an invalid expression may appear even though the expression is valid. This error does not block the creation of the segmentation rule.
- If you enable the Use custom permissions option on the Access rights tab in the properties of the Managed devices administration group, the client devices cannot be exported from Open Single Management Platform to KUMA.
- The playbooks that contain response actions through Kaspersky Endpoint Security for Windows are displayed as available in the playbook list even though the Kaspersky Endpoint Security for Windows web plug-in is not installed in Kaspersky Next XDR Expert.
- When you import the Download updates to the repositories of distribution points or Update verification task the Select devices to which the task will be assigned option is enabled. These tasks cannot be assigned to a device selection or specific devices. If you assign the Download updates to the repositories of distribution points or Update verification task to specific devices, the task will be imported incorrectly.
- In the investigation graph, rearranging nodes is performed incorrectly.
- When migrating data from the secondary Administration Server of Kaspersky Security Center Windows to the primary Administration Server of Kaspersky Next XDR Expert, the Migration wizard does not finish the Importing data step. This issue occurs if you create a global task on the secondary Administration Server (for example, the Uninstall application remotely task) and select only the Kaspersky Security Center Administration Server value for the Managed applications to export parameter in the Migration wizard.
- Receiving Kaspersky announcements is not available.
- The Administration Server properties window contains settings for mobile devices, though Kaspersky Next XDR Expert does not support management of mobile devices.
- The notifications about new versions of web plug-ins that are available to download are disabled. You can update the plug-ins by using Kaspersky Deployment Toolkit.
- After creating a new tenant, the alerts related to the tenant are sent to the server, but not displayed in the alert table. You may need to refresh the webpage to update the table data.
- In the properties window of any object that supports revision management, the Revision history section contains the User device IP address and Web Console IP address fields displaying incorrect IP addresses.
For the list of known issues of Open Single Management Platform, refer to the Kaspersky Security Center documentation.
Page top
Appendices
This section provides information that complements the main document text with reference information.
Commands for components manual starting and installing
This section contains the parameters of KUMA's executable file /opt/kaspersky/kuma/kuma that can be used to manually start or install KUMA services. This may be useful for when you need to see output in the server operating system console.
Commands parameters
Commands |
Description |
|
Start KUMA administration tools. |
|
Install, start, or remove a collector service. |
|
Install, start, or uninstall the Core service. |
|
Install, start, or remove a correlator service. |
|
Install, start, or remove an agent service. |
|
Get information about available commands and parameters. |
|
Get information about license. |
|
Start or install a Storage. |
|
Get information about version of the program. |
Flags:
-h, --h are used to get help about any kuma command. For example, kuma <component> --help.
Examples:
kuma versionis used to get version of the KUMA installer.kuma core -h– is used to get help about core command of KUMA installer.kuma collector --core <address of the server where the collector should obtain its settings> --id <ID of the installed service> --api.port <port>is used to start collector service installation.
Integrity check of KUMA files
The integrity of KUMA components is checked using a set of scripts based on the integrity_checker tool and located in the/opt/kaspersky/kuma/integrity/bin directory. An integrity check uses manifest xml files in the/opt/kaspersky/kuma/integrity/manifest/* directory, signed with a Kaspersky cryptographic signature.
Running the integrity check tool requires a user account with permissions at least matching those of the KUMA account.
The integrity check tool processes each KUMA component individually, and it must be run on servers that has the appropriate components installed. An integrity check also screens the xml file that was used.
To check the integrity of component files:
- Run the following command to navigate to the directory that contains the set of scripts:
cd /opt/kaspersky/kuma/integrity/bin - Then pick the command that matches the KUMA component you want to check:
./check_all.shfor KUMA Core and Storage components../check_core.shfor KUMA Core components../check_collector.shfor KUMA collector components../check_correlator.shfor KUMA correlator components../check_storage.shfor storage components../check_kuma_exe.sh <full path to kuma.exe omitting file name>for KUMA Agent for Windows. The standard location of the agent executable file on the Windows device is: C:\Program Files\Kaspersky Lab\KUMA\.
The integrity of the component files is checked.
The result of checking each component is displayed in the following format:
- The Summary section describes the number of scanned objects along with the scan status: integrity not confirmed / object skipped / integrity confirmed:
- Manifests – the number of manifest files processed.
- Files – is not used when KUMA integrity check is performed.
- Directories – is not used when KUMA integrity check is performed.
- Registries – is not used when KUMA integrity check is performed.
- Registry values – is not used when KUMA integrity check is performed.
- Component integrity check result:
- SUCCEEDED – integrity confirmed.
- FAILED – integrity violated.
Normalized event data model
This section presents the KUMA normalized event data model. All events that are processed by KUMA Correlator to detect alerts must be compliant to this model.
Events that are not compliant to this data model must be imported into this format (or normalized) using Collectors.
Normalized event data model
Field name |
Data type |
Field size |
Description |
|
The name of a field reflects its purpose. The fields can be modified.
|
||||
ApplicationProtocol |
String |
31 characters |
Name of the application layer protocol. For example, HTTPS, SSH, Telnet. |
|
BytesIn |
Number |
From -9223372036854775808 to 9223372036854775807 |
Number of bytes received. |
|
BytesOut |
Number |
From -9223372036854775808 to 9223372036854775807 |
Number of bytes sent. |
|
DestinationAddress |
String |
45 characters |
IPv4 or IPv6 address of the asset that the action will be performed on. For example, 0.0.0.0 or xxxx:xxxx:xxxx:xxxx:xxxx:xxxx:xxxx:xxxx |
|
DestinationCity |
String |
1023 characters |
City corresponding to the IP address from the DestinationAddress field. |
|
DestinationCountry |
String |
1023 characters |
Country corresponding to the IP address from the DestinationAddress field. |
|
DestinationDnsDomain |
String |
255 characters |
The DNS portion of the fully qualified domain name of the destination. |
|
DestinationHostName |
String |
1023 characters |
Host name of the destination. FQDN of the destination, if available. |
|
DestinationLatitude |
Float |
From +/- 1.7E-308 to 1.7E+308 |
Longitude corresponding to the IP address from the DestinationAddress field. |
|
DestinationLongitude |
Float |
From +/- 1.7E-308 to 1.7E+308 |
Latitude corresponding to the IP address from the DestinationAddress field. |
|
DestinationMacAddress |
String |
17 characters |
MAC address of the destination. For example, aa:bb:cc:dd:ee:00 |
|
DestinationNtDomain |
String |
255 characters |
Windows Domain Name of the destination. |
|
DestinationPort |
Number |
From -9223372036854775808 to 9223372036854775807 |
Port number of the destination. |
|
DestinationProcessID |
Number |
From -9223372036854775808 to 9223372036854775807 |
System process ID registered on the destination. |
|
DestinationProcessName |
String |
1023 characters |
Name of the system process registered on the destination. For example, sshd, telnet. |
|
DestinationRegion |
String |
1023 characters |
Region corresponding to the IP address from the DestinationAddress field. |
|
DestinationServiceName |
String |
1023 characters |
Name of the service on the destination side. For example, sshd. |
|
DestinationTranslatedAddress |
String |
45 characters |
Translated IPv4 or IPv6 address of the destination. For example, 0.0.0.0 or xxxx:xxxx:xxxx:xxxx:xxxx:xxxx:xxxx:xxxx |
|
DestinationTranslatedPort |
Number |
From -9223372036854775808 to 9223372036854775807 |
Port number at the destination after translation. |
|
DestinationUserID |
String |
1023 characters |
User ID of the destination. |
|
DestinationUserName |
String |
1023 characters |
User name of the destination. |
|
DestinationUserPrivileges |
String |
1023 characters |
Names of roles that identify user privileges at the destination. For example, User, Guest, Administrator, etc. |
|
DeviceAction |
String |
63 characters |
Action that was taken by the event source. For example, blocked, detected. |
|
DeviceAddress |
String |
45 characters |
IPv4 or IPv6 address of the device from which the event was received. For example, 0.0.0.0 or xxxx:xxxx:xxxx:xxxx:xxxx:xxxx:xxxx:xxxx |
|
DeviceCity |
String |
1023 characters |
City corresponding to the IP address from the DeviceAddress field. |
|
DeviceCountry |
String |
1023 characters |
Country corresponding to the IP address from the DeviceAddress field. |
|
DeviceDnsDomain |
String |
255 characters |
DNS part of the fully qualified domain name of the device from which the event was received. |
|
DeviceEventClassID |
String |
1023 characters |
Event type ID assigned by the event source. |
|
DeviceExternalID |
String |
255 characters |
ID of the device or application assigned by the event source. |
|
DeviceFacility |
String |
1023 characters |
Value of the facility parameter set by the event source. |
|
DeviceHostName |
String |
100 characters |
Name of the device from which the event was received. FQDN of the device, if available. |
|
DeviceInboundinterface |
String |
128 characters |
Name of the incoming connection interface. |
|
DeviceLatitude |
Float |
From +/- 1.7E-308 to 1.7E+308 |
Longitude corresponding to the IP address from the DeviceAddress field. |
|
DeviceLongitude |
Float |
From +/- 1.7E-308 to 1.7E+308 |
Latitude corresponding to the IP address from the DeviceAddress field. |
|
DeviceMacAddress |
String |
17 characters |
MAC address of the asset from which the event was received. For example, aa:bb:cc:dd:ee:00 |
|
DeviceNtDomain |
String |
255 characters |
Windows Domain Name of the device. |
|
DeviceOutboundinterface |
String |
128 characters |
Name of the outgoing connection interface. |
|
DevicePayloadID |
String |
128 characters |
The payload's unique ID that is associated with the raw event. |
|
DeviceProcessID |
Number |
From -9223372036854775808 to 9223372036854775807 |
ID of the system process on the device that generated the event. |
|
DeviceProcessName |
String |
1023 characters |
Name of the process. |
|
DeviceProduct |
String |
63 characters |
Name of the application that generated the event. The DeviceVendor, DeviceProduct, and DeviceVersion all uniquely identify the log source. |
|
DeviceReceiptTime |
Number |
From -9223372036854775808 to 9223372036854775807 |
Time when the device received the event. |
|
DeviceRegion |
String |
1023 characters |
Region corresponding to the IP address from the DeviceAddress field. |
|
DeviceTimeZone |
String |
255 characters |
Time zone of the device on which the event was generated. |
|
DeviceTranslatedAddress |
String |
45 characters |
Re-translated IPv4 or IPv6 address of the device from which the event was received. For example, 0.0.0.0 or xxxx:xxxx:xxxx:xxxx:xxxx:xxxx:xxxx:xxxx |
|
DeviceVendor |
String |
63 characters |
Vendor name of the event source. The DeviceVendor, DeviceProduct, and DeviceVersion all uniquely identify the log source. |
|
DeviceVersion |
String |
31 characters |
Product version of the event source. The DeviceVendor, DeviceProduct, and DeviceVersion all uniquely identify the log source. |
|
EndTime |
Number |
From -9223372036854775808 to 9223372036854775807 |
Date and time (timestamp) when the event ended. |
|
EventOutcome |
String |
63 characters |
Result of the operation. For example, success, failure. |
|
ExternalID |
String |
40 characters |
Field in which the ID can be saved. |
|
FileCreateTime |
Number |
From -9223372036854775808 to 9223372036854775807 |
File creation time. |
|
FileHash |
String |
255 characters |
Hash of the file. Example: CA737F1014A48F4C0B6DD43CB177B0AFD9E5169367544C494011E3317DBF9A509CB1E5DC1E85A941BBEE3D7F2AFBC9B1 |
|
FileID |
String |
1023 characters |
ID of the file. |
|
FileModificationTime |
Number |
From -9223372036854775808 to 9223372036854775807 |
Time when the file was last modified. |
|
FileName |
String |
1023 characters |
Filename without specifying the file path. |
|
FilePath |
String |
1023 characters |
File path, including the file name. |
|
FilePermission |
String |
1023 characters |
List of file permissions. |
|
FileSize |
Number |
From -9223372036854775808 to 9223372036854775807 |
File size. |
|
FileType |
String |
1023 characters |
File type. |
|
Message |
String |
1023 characters |
Brief description of the event. |
|
Name |
String |
512 characters |
Name of the event. |
|
OldFileCreateTime |
Number |
From -9223372036854775808 to 9223372036854775807 |
Time when the OLD file was created from the event. The time is specified in UTC0. In the KUMA Console, the value is displayed based in the timezone of the user's browser. |
|
OldFileHash |
String |
255 characters |
Hash of the OLD file. Example: CA737F1014A48F4C0B6DD43CB177B0AFD9E5169367544C494011E3317DBF9A509CB1E5DC1E85A941BBEE3D7F2AFBC9B1 |
|
OldFileID |
String |
1023 characters |
ID of the OLD file. |
|
OldFileModificationTime |
Number |
From -9223372036854775808 to 9223372036854775807 |
Time when the OLD file was last modified. |
|
OldFileName |
String |
1023 characters |
Name of the OLD file (without the file path). |
|
OldFilePath |
String |
1023 characters |
Path to the OLD file, including the file name. |
|
OldFilePermission |
String |
1023 characters |
List of permissions of the OLD file. |
|
OldFileSize |
Number |
From -9223372036854775808 to 9223372036854775807 |
Size of the OLD file. |
|
OldFileType |
String |
1023 characters |
Type of the OLD file. |
|
Reason |
String |
1023 characters |
Information about the reason for the event. |
|
RequestClientApplication |
String |
1023 characters |
Value of the "user-agent" parameter of the http request. |
|
RequestContext |
String |
2048 characters |
Description of the http request context. |
|
RequestCookies |
String |
1023 characters |
Cookies associated with the http request. |
|
RequestMethod |
String |
1023 characters |
Method used when making the http request. |
|
RequestUrl |
String |
1023 characters |
Requested URL. |
|
Severity |
String |
1023 characters |
Priority. This can be the Severity field or the Level field of the raw event. |
|
SourceAddress |
String |
45 characters |
IPv4 or IPv6 address of the source. Example format: 0.0.0.0 or xxxx:xxxx:xxxx:xxxx:xxxx:xxxx:xxxx:xxxx |
|
SourceCity |
String |
1023 characters |
City corresponding to the IP address from the SourceAddress field. |
|
SourceCountry |
String |
1023 characters |
Country corresponding to the IP address from the SourceAddress field. |
|
SourceDnsDomain |
String |
255 characters |
The DNS portion of the fully qualified domain name of the source. |
|
SourceHostName |
String |
1023 characters |
Windows Domain Name of the event source device. |
|
SourceLatitude |
Float |
From +/- 1.7E-308 to 1.7E+308 |
Longitude corresponding to the IP address from the SourceAddress field. |
|
SourceLongitude |
Float |
From +/- 1.7E-308 to 1.7E+308 |
Latitude corresponding to the IP address from the SourceAddress field. |
|
SourceMacAddress |
String |
17 characters |
MAC address of the source. Format example: aa:bb:cc:dd:ee:00 |
|
SourceNtDomain |
String |
255 characters |
Windows Domain Name of the source. |
|
SourcePort |
Number |
From -9223372036854775808 to 9223372036854775807 |
Source port number. |
|
SourceProcessID |
Number |
From -9223372036854775808 to 9223372036854775807 |
System process ID. |
|
SourceProcessName |
String |
1023 characters |
Name of the system process at the source. For example, sshd, telnet, etc. |
|
SourceRegion |
String |
1023 characters |
Region corresponding to the IP address from the SourceAddress field. |
|
SourceServiceName |
String |
1023 characters |
Name of the service on the source side. For example, sshd. |
|
SourceTranslatedAddress |
String |
15 characters |
Translated IPv4 or IPv6 address of the source. Example format: 0.0.0.0 or xxxx:xxxx:xxxx:xxxx:xxxx:xxxx:xxxx:xxxx |
|
SourceTranslatedPort |
Number |
From -9223372036854775808 to 9223372036854775807 |
Port number of the source after translation. |
|
SourceUserID |
String |
1023 characters |
User ID of the source. |
|
SourceUserName |
String |
1023 characters |
User name of the source. |
|
SourceUserPrivileges |
String |
1023 characters |
Names of roles that identify user privileges of the source. For example, User, Guest, Administrator, etc. |
|
StartTime |
Number |
From -9223372036854775808 to 9223372036854775807 |
Date and time (timestamp) when the activity associated with the event began. |
|
Tactic |
String |
128 characters |
Name of the tactic from the MITRE ATT&CK matrix. |
|
Technique |
String |
128 characters |
Name of the technique from the MITRE ATT&CK matrix. |
|
TransportProtocol |
String |
31 characters |
Name of the Transport layer protocol of the OSI model (TCP, UDP, etc). |
|
Type |
Number |
From -9223372036854775808 to 9223372036854775807 |
Event type: 1 - basic, 2 - aggregated, 3 - correlation, 4 - audit, 5 - monitoring. |
|
Fields the purpose of which can be defined by the user. The fields can be modified. |
||||
DeviceCustomDate1 |
Number, timestamp |
From -9223372036854775808 to 9223372036854775807 |
Field for mapping a date and time value (timestamp). The time is specified in UTC0. In the KUMA Console, the value is displayed based in the timezone of the user's browser. |
|
DeviceCustomDate1Label |
String |
1023 characters |
Field for describing the purpose of the DeviceCustomDate1 field. |
|
DeviceCustomDate2 |
Number, timestamp |
From -9223372036854775808 to 9223372036854775807 |
Field for mapping a date and time value (timestamp). The time is specified in UTC0. In the KUMA Console, the value is displayed based in the timezone of the user's browser. |
|
DeviceCustomDate2Label |
String |
1023 characters |
Field for describing the purpose of the DeviceCustomDate2 field. |
|
DeviceCustomFloatingPoint1 |
Float |
From +/- 1.7E-308 to 1.7E+308 |
Field for mapping floating point numbers. |
|
DeviceCustomFloatingPoint1Label |
String |
1023 characters |
Field for describing the purpose of the DeviceCustomFloatingPoint1 field. |
|
DeviceCustomFloatingPoint2 |
Float |
From +/- 1.7E-308 to 1.7E+308 |
Field for mapping floating point numbers. |
|
DeviceCustomFloatingPoint2Label |
String |
1023 characters |
Field for describing the purpose of the DeviceCustomFloatingPoint2 field. |
|
DeviceCustomFloatingPoint3 |
Float |
From +/- 1.7E-308 to 1.7E+308 |
Field for mapping floating point numbers. |
|
DeviceCustomFloatingPoint3Label |
String |
1023 characters |
Field for describing the purpose of the DeviceCustomFloatingPoint3 field. |
|
DeviceCustomFloatingPoint4 |
Float |
From +/- 1.7E-308 to 1.7E+308 |
Field for mapping floating point numbers. |
|
DeviceCustomFloatingPoint4Label |
String |
1023 characters |
Field for describing the purpose of the DeviceCustomFloatingPoint4 field. |
|
DeviceCustomIPv6Address1 |
String |
45 characters |
Field for mapping an IPv6 address value. Format example: y:y:y:y:y:y:y:y |
|
DeviceCustomIPv6Address1Label |
String |
1023 characters |
Field for describing the purpose of the DeviceCustomIPv6Address1 field. |
|
DeviceCustomIPv6Address2 |
String |
45 characters |
Field for mapping an IPv6 address value. Format example: y:y:y:y:y:y:y:y |
|
DeviceCustomIPv6Address2Label |
String |
1023 characters |
Field for describing the purpose of the DeviceCustomIPv6Address2 field. |
|
DeviceCustomIPv6Address3 |
String |
45 characters |
Field for mapping an IPv6 address value. Format example: y:y:y:y:y:y:y:y |
|
DeviceCustomIPv6Address3Label |
String |
1023 characters |
Field for describing the purpose of the DeviceCustomIPv6Address3 field. |
|
DeviceCustomIPv6Address4 |
String |
45 characters |
Field for mapping an IPv6 address value. For example, y:y:y:y:y:y:y:y |
|
DeviceCustomIPv6Address4Label |
String |
1023 characters |
Field for describing the purpose of the DeviceCustomIPv6Address4 field. |
|
DeviceCustomNumber1 |
Number |
From -9223372036854775808 to 9223372036854775807 |
Field for mapping an integer value. |
|
DeviceCustomNumber1Label |
String |
1023 characters |
Field for describing the purpose of the DeviceCustomNumber1 field. |
|
DeviceCustomNumber2 |
Number |
From -9223372036854775808 to 9223372036854775807 |
Field for mapping an integer value. |
|
DeviceCustomNumber2Label |
String |
1023 characters |
Field for describing the purpose of the DeviceCustomNumber2 field. |
|
DeviceCustomNumber3 |
Number |
From -9223372036854775808 to 9223372036854775807 |
Field for mapping an integer value. |
|
DeviceCustomNumber3Label |
String |
1023 characters |
Field for describing the purpose of the DeviceCustomNumber3 field. |
|
DeviceCustomString1 |
String |
4000 characters |
Field for mapping a string value. |
|
DeviceCustomString1Label |
String |
1023 characters |
Field for describing the purpose of the DeviceCustomString1 field. |
|
DeviceCustomString2 |
String |
4000 characters |
Field for mapping a string value. |
|
DeviceCustomString2Label |
String |
1023 characters |
Field for describing the purpose of the DeviceCustomString2 field. |
|
DeviceCustomString3 |
String |
4000 characters |
Field for mapping a string value. |
|
DeviceCustomString3Label |
String |
1023 characters |
Field for describing the purpose of the DeviceCustomString3 field. |
|
DeviceCustomString4 |
String |
4000 characters |
Field for mapping a string value. |
|
DeviceCustomString4Label |
String |
1023 characters |
Field for describing the purpose of the DeviceCustomString4 field. |
|
DeviceCustomString5 |
String |
4000 characters |
Field for mapping a string value. |
|
DeviceCustomString5Label |
String |
1023 characters |
Field for describing the purpose of the DeviceCustomString5 field. |
|
DeviceCustomString6 |
String |
4000 characters |
Field for mapping a string value. |
|
DeviceCustomString6Label |
String |
1023 characters |
Field for describing the purpose of the DeviceCustomString6 field. |
|
DeviceDirection |
Number |
From -9223372036854775808 to 9223372036854775807 |
Field for describing the direction of connection for an event. "0" - incoming connection, "1" - outgoing connection. |
|
DeviceEventCategory |
String |
1023 characters |
Event category assigned by the device that sent the event to SIEM. |
|
FlexDate1 |
Number, timestamp |
From -9223372036854775808 to 9223372036854775807 |
Field for mapping a date and time value (timestamp). The time is specified in UTC0. In the KUMA Console, the value is displayed based in the timezone of the user's browser. |
|
FlexDate1Label |
String |
128 characters |
Field for describing the purpose of the FlexDate1Label field. |
|
FlexNumber1 |
Number |
From -9223372036854775808 to 9223372036854775807 |
Field for mapping an integer value. |
|
FlexNumber1Label |
String |
128 characters |
Field for describing the purpose of the FlexNumber1Label field. |
|
FlexNumber2 |
Number |
From -9223372036854775808 to 9223372036854775807 |
Field for mapping an integer value. |
|
FlexNumber2Label |
String |
128 characters |
Field for describing the purpose of the FlexNumber2Label field. |
|
FlexString1 |
String |
1023 characters |
Field for mapping a string value. |
|
FlexString1Label |
String |
128 characters |
Field for describing the purpose of the FlexString1Label field. |
|
FlexString2 |
String |
1023 characters |
Field for mapping a string value. |
|
FlexString2Label |
String |
128 characters |
Field for describing the purpose of the FlexString2Label field. |
|
Service fields. Cannot be edited. |
||||
AffectedAssets |
Nested [Affected] structure |
- |
Nested structure from which you can query alert-related assets and user accounts, and find out the number of times they appear in alert events. |
|
AggregationRuleID |
String |
- |
ID of the aggregation rule. |
|
AggregationRuleName |
String |
- |
Name of the aggregation rule that processed the event. |
|
BaseEventCount |
Number |
- |
For an aggregated base event, this is the number of base events that were processed by the aggregation rule. For a correlation event, this is the number of base events that were processed by the correlation rule that generated the correlation event. |
|
BaseEvents |
Nested [Event] list |
- |
Nested structure containing a list of base events. This field can be filled in for correlation events. |
|
Code |
String |
- |
In a base event, this is the code of a process, function or operation return from the source. |
|
CorrelationRuleID |
String |
- |
ID of the correlation rule. |
|
CorrelationRuleName |
String |
- |
Name of the correlation rule that triggered the creation of the correlation event. Filled only for correlation events. |
|
DestinationAccountID |
String |
- |
This field stores the user ID. |
|
DestinationAssetID |
String |
- |
This field stores the asset ID of the destination. |
|
DeviceAssetID |
String |
- |
This field stores the ID of the asset that sent the event to SIEM. |
|
Extra |
Nested [string:string] dictionary |
- |
During normalization of a raw event, this field can be used to place those fields that have not been mapped to KUMA event fields. This field can be filled in only for base events. The maximum size of the field is 4 MB. |
|
GroupedBy |
String |
- |
List of names of the fields that were used for grouping in the correlation rule. It is filled in only for the correlation event. |
|
ID |
String |
- |
Unique event ID of UUID type. The collector generates the ID for a base event that is generated by the collector. The correlator generates the ID of a correlation event. The ID never changes its value. |
|
Raw |
String |
- |
Non-normalized text of the original 'raw' event. Maximum field size is 16,384 bytes. |
|
ReplayID |
String |
- |
ID of the retroscan that generated the event. |
|
ServiceID |
String |
- |
ID of the service instance: correlator, collector, storage. |
|
ServiceName |
String |
- |
Name of the microservice instance that the KUMA administrator assigns when creating the microservice. |
|
SourceAccountID |
String |
- |
This field stores the user ID. |
|
SourceAssetID |
String |
- |
This field stores the asset ID of the event source. |
|
SpaceID |
String |
- |
ID of the space. |
|
TenantID |
String |
- |
This field stores the ID of the tenant. |
|
TI |
Nested [string:string] dictionary |
- |
Field that contains categories in a dictionary format received from an external Threat Intelligence source based on indicators from an event. |
|
TICategories |
map[String] |
- |
This field contains categories received from an external TI provider based on the indicators contained in the event. |
|
Timestamp |
Number |
- |
Timestamp of the base event created in the collector. Creation time of the correlation event created by the collector. The time is specified in UTC0. In the KUMA Console, the value is displayed based in the timezone of the user's browser. |
|
Nested Affected structure
Field |
Data type |
Description |
|
Nested |
List and number of assets associated with the alert. |
|
Nested |
List and number of user accounts associated with the alert. |
Nested AffectedRecord sctructure
Field |
Data type |
Description |
|
String |
ID of the asset or user account. |
|
Number |
The number of times an asset or user account appears in alert-related events. |
Fields generated by KUMA
KUMA generates the following fields that cannot be modified: BranchID, BranchName, DestinationAccountName, DestinationAssetName, DeviceAssetName, SourceAccountName, SourceAssetName, TenantName.
Page top
Configuring the data model of a normalized event from KATA EDR
To investigate the information, the IDs of the event and the KATA/EDR process must go to certain fields of the normalized event. To build a process tree for events coming from KATA/EDR, you must configure the copying of data from the fields of the raw events to the fields of the normalized event in KUMA normalizers as follows:
- For any KATA/EDR events, you must configure normalization with copying of the following fields:
- The
EventTypefield of the KATA/EDR event must be copied to theDeviceEventCategoryfield of the normalized KUMA event. - The
HostNamefield of the KATA/EDR event must be copied to theDeviceHostNamefield of the normalized KUMA event.
- The
- For any event where DeviceProduct = 'KATA', normalization must be configured in accordance with the table below.
Normalization of event fields from KATA/EDR
KATA/EDR event field
Normalized event field
IOATag
DeviceCustomIPv6Address2
IOATag
IOAImportance
DeviceCustomIPv6Address1
IOAImportance
FilePath
FilePath
FileName
FileName
Md5
FileHash
FileSize
FileSize
- For events listed in the table below, additional normalization with field copying must be configured in accordance with the table.
Additional normalization with copying of event fields from KATA/EDR
Event
Raw event field
Normalized event field
Process
UniqueParentPid
FlexString1
UniquePid
FlexString2
HostName
DeviceHostName
FileName
FileName
AppLock
UniquePid
FlexString2
HostName
DeviceHostName
FileName
FileName
BlockedDocument
UniquePid
FlexString2
HostName
DeviceHostName
FileName
FileName
Module
UniquePid
FlexString2
HostName
DeviceHostName
FileName
FileName
FileChange
UniquePid
FlexString2
HostName
DeviceHostName
FileName
FileName
Driver
HostName
DeviceHostName
FileName
FileName
ProductName
DeviceCustomString5
ProductName
ProductVendor
DeviceCustomString6
ProductVendor
Connection
UniquePid
FlexString2
HostName
DeviceHostName
URI
RequestURL
RemoteIP
DestinationAddress
RemotePort
DestinationPort
PortListen
UniquePid
FlexString2
HostName
DeviceHostName
LocalIP
SourceAddress
LocalPort
SourcePort
Registry
UniquePid
FlexString2
HostName
DeviceHostName
ValueName
DeviceCustomString5
New Value Name
KeyName
DeviceCustomString4
New Key Name
PreviousKeyName
FlexString2
Old Key Name
ValueData
DeviceCustomString6
New Value Data
PreviousValueData
FlexString1
Old Value Data
ValueType
FlexNumber1
Value Type
PreviousValueType
FlexNumber2
Previous Value Type
SystemEventLog
UniquePid
FlexString2
HostName
DeviceHostName
OperationResult
EventOutcome
EventId
DeviceCustomNumber3
EventId
EventRecordId
DeviceCustomNumber2
EventRecordId
Channel
DeviceCustomString6
Channel
ProviderName
SourceUserID
ThreatDetect
UniquePid
FlexString2
HostName
DeviceHostName
VerdictName
EventOutcome
DetectedObjectType
OldFileType
isSilent
FlexString1
Is Silent
RecordId
DeviceCustomString5
Record ID
DatabaseTimestamp
DeviceCustomDate2
Database Timestamp
ThreatDetectProcessingResult
UniquePid
FlexString2
HostName
DeviceHostName
ThreatStatus
DeviceCustomString5
Threat Status
PROCESS_INTERPRET_FILE_RUN
UniquePid
FlexString2
HostName
DeviceHostName
FileName
FileName
InterpretedFilePath
OldFilePath
InterpretedFileSize
OldFileSize
InterpretedFileHash
OldFileHash
PROCESS_CONSOLE_INTERACTIVE_INPUT
UniquePid
FlexString2
HostName
DeviceHostName
InteractiveInputText
DeviceCustomString4
Command Line
AMSI SCAN
UniquePid
FlexString2
HostName
DeviceHostName
ObjectContent
DeviceCustomString5
Object Content
Asset data model
The structure of an asset is represented by fields that contain values. Fields can also contain nested structures.
Asset field |
Value type |
Description |
|
String |
Asset ID. |
|
String |
Tenant name. |
|
Number |
Asset deletion date. |
|
Number |
Asset creation date. |
|
String |
Tenant ID. |
|
Nested list of strings |
Asset categories. |
|
Nested |
Changes asset categories. |
|
Nested dictionary: [string:string |
IDs of incidents. |
|
Nested list of strings |
Asset IP addresses. |
|
String |
Asset FQDN. |
|
Number |
Asset importance. |
|
String with |
Indicator of whether the asset has been marked for deletion from KUMA. |
|
Number |
Date of last update of the asset. |
|
Nested list of strings |
Asset MAC addresses. |
|
Nested list of numbers |
IP address in number format. |
|
Nested [OwnerInfo] structure |
Asset owner information. |
|
Nested [OS] structure |
Asset operating system information. |
|
String |
Asset name. |
|
Nested [Software] structure |
Software installed on the asset. |
|
Nested [Vulnerability] structure |
Asset vulnerabilities. |
|
String |
KICS for Networks server IP address. |
|
Number |
KICS for Networks connector ID. |
|
Number |
KICS for Networks asset ID. |
|
String |
KICS for Networks asset status. |
|
Nested [KICSSystemInfo] structure |
Asset hardware information received from KICS for Networks. |
|
Nested [KICSSystemInfo] structure |
Asset software information received from KICS for Networks. |
|
Nested [KICSRisk] structure |
Asset vulnerability information received from KICS for Networks. |
|
Nested [Sources] structure |
Basic information about the asset from various sources. |
|
String with |
Indicator that asset details have been imported from Kaspersky Security Center. |
|
String |
ID of the Kaspersky Security Center Network Agent from which the asset information was received. |
|
String |
FQDN of the Kaspersky Security Center Server. |
|
String |
Kaspersky Security Center instance ID. |
|
String |
Kaspersky Security Center Server host name. |
|
Number |
Kaspersky Security Center group ID. |
|
String |
Kaspersky Security Center group name. |
|
Number |
Date when information about the asset was last received from Kaspersky Security Center. |
|
Nested dictionary: [string:nested [ProductInfo] structure] |
Information about Kaspersky applications installed on the asset received from Kaspersky Security Center. |
|
Nested [Hardware] structure |
Asset hardware information received from Kaspersky Security Center. |
|
Nested [Software] structure |
Asset software information received from Kaspersky Security Center. |
|
Nested [Vulnerability] structure |
Asset vulnerability information received from Kaspersky Security Center. |
Nested Category structure
Field |
Value type |
Description |
|
String |
Category ID. |
|
String |
Tenant ID. |
|
String |
Tenant name. |
|
String |
Parent category. |
|
Nested list of strings |
Structure of categories. |
|
String |
Category name. |
|
Number |
Last update of the category. |
|
Number |
Category creation date. |
|
String |
Category description. |
|
Number |
Category importance. |
|
String |
Asset category assignment type. |
|
Number |
Categorization date. |
|
String |
Category assignment interval. |
Nested OwnerInfo structure
Field |
Value type |
Description |
|
String |
Name of the asset owner. |
Nested OS structure
Field |
Value type |
Description |
|
String |
Name of the operating system. |
|
Number |
Operating system version. |
Nested Software structure
Field |
Value type |
Description |
|
String |
Software name. |
|
String |
Software version. |
|
String |
Software publisher. |
|
String |
Installation date. |
|
String |
Indicates whether the software has an MSI installer. |
Nested Vulnerability structure
Field |
Value type |
Description |
|
String |
Vulnerability ID assigned by Kaspersky. |
|
String |
Software name. |
|
String |
URL containing the vulnerability description. |
|
String |
Recommended update. |
|
String |
Recommended update. |
|
String |
Vulnerability severity. |
|
Number |
Vulnerability severity. |
|
Nested list of strings |
CVE vulnerability ID. |
|
String |
Indicates whether an exploit exists. |
|
String |
Indicates whether malware exists. |
Nested KICSSystemInfo structure
Field |
Value type |
Description |
|
String |
Device model. |
|
String |
Device version. |
|
String |
Vendor. |
Nested KICSRisk structure
Field |
Value type |
Description |
|
Number |
KICS for Networks risk ID. |
|
String |
Risk name. |
|
String |
Risk type. |
|
String |
Risk description. |
|
String |
Link to risk description. |
|
Number |
Risk severity. |
|
Number |
CVSS score. |
Nested Sources structure
Field |
Value type |
Description |
|
Nested [SourceInfo] structure |
Asset information received from Kaspersky Security Center. |
|
Nested [SourceInfo] structure |
Asset information received through the REST API. |
|
Nested [SourceInfo] structure |
Manually entered information about the asset. |
|
Nested [SourceInfo] structure |
Asset information received from KICS for Networks. |
Nested Sources structure
Field |
Value type |
Description |
|
Nested list of strings |
Asset MAC addresses. |
|
Nested list of numbers |
IP address in number format. |
|
Nested [OwnerInfo] structure |
Asset owner information. |
|
Nested [OS] structure |
Asset operating system information. |
|
String |
Asset name. |
|
Nested list of strings |
Asset IP addresses. |
|
String |
Asset FQDN. |
|
Number |
Asset importance. |
|
String with |
Indicator of whether the asset has been marked for deletion from KUMA. |
|
Number |
Date of last update of the asset. |
Nested ProductInfo structure
Field |
Value type |
Description |
|
String |
Software version. |
|
String |
Software name. |
Nested Hardware structure
Field |
Value type |
Description |
|
Nested [NetCard] structure |
List of network cards of the asset. |
|
Nested [CPU] structure |
List of asset processors. |
|
Nested [RAM] structure |
Asset RAM list. |
|
Nested [Disk] structure |
List of asset drives. |
Nested Netcard structure
Field |
Value type |
Description |
|
String |
Network card ID. |
|
Nested list of strings |
MAC addresses of the network card. |
|
String |
Network card name. |
|
String |
Network card manufacture. |
|
String |
Driver version. |
Nested RAM structure
Field |
Value type |
Description |
|
String |
RAM frequency. |
|
Number |
Amount of RAM, in bytes. |
Nested CPU structure
Field |
Value type |
Description |
|
String |
CPU ID. |
|
String |
CPU name. |
|
String |
Number of cores. |
|
String |
Frequency. |
Nested Disk structure
Field |
Value type |
Description |
|
Number |
Available disk space. |
|
Number |
Total disk space. |
User account data model
User account fields can be addressed from email templates and during event correlation.
Field |
Value type |
Description |
|
String |
User account ID. |
|
String |
Active Directory attribute. User account ID in Active Directory. |
|
String |
Tenant ID. |
|
String |
Tenant name. |
|
Number |
Last update of user account. |
|
String |
Domain. |
|
String |
Active Directory attribute. User name. |
|
String |
Active Directory attribute. Displayed user name. |
|
String |
Active Directory attribute. LDAP object name. |
|
String |
Active Directory attribute. Employee ID. |
|
String |
Active Directory attribute. User email address. |
|
String |
Active Directory attribute. Alternate email address. |
|
String |
Active Directory attribute. Mobile phone number. |
|
String |
Active Directory attribute. Security ID. |
|
String |
Active Directory attribute. Login. |
|
String |
Active Directory attribute. Phone number. |
|
String |
Active Directory attribute. User principal name (UPN). |
|
|
Indicator that determines whether a user account is obsolete. |
|
List of strings |
Active Directory attribute. Active Directory groups joined by the user. This attribute can be used for an event search during correlation. |
|
|
Indicator that determines whether a user account should be designated as obsolete. |
|
Number |
User account creation date. |
|
String |
Active Directory attribute. Last name of the user. |
|
String |
Active Directory attribute. User account type. |
|
String |
Active Directory attribute. Job title of the user. |
|
String |
Active Directory attribute. User's department. |
|
String |
Active Directory attribute. User's division. |
|
String |
Active Directory attribute. User's supervisor. |
|
String |
Active Directory attribute. User's location. |
|
String |
Active Directory attribute. User's company. |
|
String |
Active Directory attribute. Company address. |
|
String |
Active Directory attribute. Delivery address. |
|
List of strings |
Active Directory attribute. Objects under control of the user. |
|
Number |
Active Directory attribute. Active Directory account type. |
|
Number |
Active Directory attribute. User account creation date. |
|
Number |
Active Directory attribute. User account modification date. |
|
Number |
Active Directory attribute. User account expiration date. |
|
Number |
Active Directory attribute. Date of last unsuccessful login attempt. |
KUMA audit events
Audit events are created when certain security-related actions are completed in KUMA. These events are used to ensure system integrity. This section covers the KUMA audit events.
Event fields with general information
Every audit event has the event fields described below.
Event field name |
Field value |
ID |
Unique event ID in the form of an UUID. |
Timestamp |
Event time. |
DeviceHostName |
The event source host. For audit events, it is the hostname where kuma-core is installed, because it is the source of events. |
DeviceTimeZone |
Timezone of the system time of the server hosting the KUMA Core in the format +-hh:mm. |
Type |
Type of the audit event. For audit event the value is 4. |
TenantID |
ID of the main tenant. |
DeviceVendor |
|
DeviceProduct |
|
EndTime |
Event creation time. |
User successfully signed in or failed to sign in
Event field name |
Field value |
DeviceAction |
|
EventOutcome |
|
SourceTranslatedAddress |
This field contains the value of the HTTP header x-real-ip or x-forwarded-for. If these headers are absent, the field will be empty. |
SourceAddress |
The address from which the user logged in. If the user logged in using a proxy, there will be a proxy address. |
SourcePort |
Port from which the user logged in. If the user logged in using a proxy, there will be a port on the proxy side. |
SourceUserName |
User login. |
SourceUserID |
User ID. |
Message |
Description of the error; appears only if an error occurred during login. Otherwise, the field will be empty. |
User successfully logged out
This event appears only when the user pressed the logout button.
This event will not appear if the user is logged out due to the end of the session or if the user logs in again from another browser.
Event field name |
Field value |
DeviceAction |
|
EventOutcome |
|
SourceTranslatedAddress |
This field contains the value of the HTTP header x-real-ip or x-forwarded-for. If these headers are absent, the field will be empty. |
SourceAddress |
The address from which the user logged in. If the user logged in using a proxy, there will be a proxy address. |
SourcePort |
Port from which the user logged in. If the user logged in using a proxy, there will be a port on the proxy side. |
SourceUserName |
User login. |
SourceUserID |
User ID. |
Changed the set of spaces to differentiate access to events
Event field name |
Field value |
DeviceAction |
|
EventOutcome |
|
SourceTranslatedAddress |
This field contains the value of the HTTP header x-real-ip or x-forwarded-for. If these headers are absent, the field will be empty. |
SourceAddress |
The address from which the user logged in. If the user logged in using a proxy, there will be a proxy address. |
SourcePort |
Port from which the user logged in. If the user logged in using a proxy, there will be a port on the proxy side. |
SourceUserName |
User login that was used to edit settings. |
DeviceCustomString2 |
ID of the space set. |
DeviceCustomString2Label |
|
DeviceCustomString3 |
Name of the space set. |
DeviceCustomString3Label |
|
Service was successfully created
Event field name |
Field value |
DeviceAction |
|
EventOutcome |
|
SourceTranslatedAddress |
This field contains the value of the HTTP header x-real-ip or x-forwarded-for. If these headers are absent, the field will be empty. |
SourceAddress |
The address from which the user logged in. If the user logged in using a proxy, there will be a proxy address. |
SourcePort |
Port from which the user logged in. If the user logged in using a proxy, there will be a port on the proxy side. |
SourceUserName |
User login that was used to create the service. |
SourceUserID |
User ID that was used to create the service. |
DeviceExternalID |
Service ID. |
DeviceProcessName |
Service name. |
DeviceFacility |
Service type. |
DeviceCustomString5 |
Tenant ID. |
DeviceCustomString5Label |
|
DeviceCustomString6 |
Tenant name. |
DeviceCustomString6Label |
|
Service was successfully deleted
Event field name |
Field value |
DeviceAction |
|
EventOutcome |
|
SourceTranslatedAddress |
This field contains the value of the HTTP header x-real-ip or x-forwarded-for. If these headers are absent, the field will be empty. |
SourceAddress |
The address from which the user logged in. If the user logged in using a proxy, there will be a proxy address. |
SourcePort |
Port from which the user logged in. If the user logged in using a proxy, there will be a port on the proxy side. |
SourceUserName |
User login that was used to delete the service. |
SourceUserID |
User ID that was used to delete the service. |
DeviceExternalID |
Service ID. |
DeviceProcessName |
Service name. |
DeviceFacility |
Service type. |
DestinationAddress |
Address of the device that was used to start the service. If the service has never been started before, the field will be empty. |
DestinationHostName |
The FQDN of the machine that was used to start the service. If the service has never been started before, the field will be empty. |
DeviceCustomString5 |
Tenant ID. |
DeviceCustomString5Label |
|
DeviceCustomString6 |
Tenant name. |
DeviceCustomString6Label |
|
Service was successfully started
Event field name |
Field value |
DeviceAction |
|
EventOutcome |
|
SourceTranslatedAddress |
This field contains the value of the HTTP header x-real-ip or x-forwarded-for. If these headers are absent, the field will be empty. |
SourceAddress |
Address that reported information about service start. It may be a proxy address if the information passed through a proxy. |
SourcePort |
Port that reported information about service start. It may be a proxy port if the information passed through a proxy. |
DeviceExternalID |
Service ID. |
DeviceProcessName |
Service name. |
DeviceFacility |
Service type. |
DestinationAddress |
Address of the device where the service was started. |
DestinationHostName |
FQDN of the device where the service was started. |
DeviceCustomString5 |
Tenant ID. |
DeviceCustomString5Label |
|
DeviceCustomString6 |
Tenant name. |
DeviceCustomString6Label |
|
Service was successfully paired
Event field name |
Field value |
DeviceAction |
|
EventOutcome |
|
SourceTranslatedAddress |
This field contains the value of the HTTP header x-real-ip or x-forwarded-for. If these headers are absent, the field will be empty. |
SourceAddress |
Address that sent a service pairing request. It may be a proxy address if the request passed through a proxy. |
SourcePort |
Port that sent a service pairing request. It may be a proxy port if the request passed through a proxy. |
DeviceExternalID |
Service ID. |
DeviceProcessName |
Service name. |
DeviceFacility |
Service type. |
DeviceCustomString5 |
Tenant ID. |
DeviceCustomString5Label |
|
DeviceCustomString6 |
Tenant name. |
DeviceCustomString6Label |
|
Service was successfully reloaded
Event field name |
Field value |
DeviceAction |
|
EventOutcome |
|
SourceTranslatedAddress |
This field contains the value of the HTTP header x-real-ip or x-forwarded-for. If these headers are absent, the field will be empty. |
SourceAddress |
The address from which the user logged in. If the user logged in using a proxy, there will be a proxy address. |
SourcePort |
Port from which the user logged in. If the user logged in using a proxy, there will be a port on the proxy side. |
SourceUserName |
User login that was used to reset the service. |
SourceUserID |
User ID that was used to restart the service. |
DeviceExternalID |
Service ID. |
DeviceProcessName |
Service name. |
DeviceFacility |
Service type. |
DeviceCustomString5 |
Tenant ID. |
DeviceCustomString5Label |
|
DeviceCustomString6 |
Tenant name. |
DeviceCustomString6Label |
|
Service was successfully restarted
Event field name |
Field value |
DeviceAction |
|
EventOutcome |
|
SourceTranslatedAddress |
This field contains the value of the HTTP header x-real-ip or x-forwarded-for. If these headers are absent, the field will be empty. |
SourceAddress |
The address from which the user logged in. If the user logged in using a proxy, there will be a proxy address. |
SourcePort |
Port from which the user logged in. If the user logged in using a proxy, there will be a port on the proxy side. |
SourceUserName |
User login that was used to restart the service. |
SourceUserID |
User ID that was used to restart the service. |
DeviceExternalID |
Service ID. |
DeviceProcessName |
Service name. |
DeviceFacility |
Service type. |
DeviceCustomString5 |
Tenant ID. |
DeviceCustomString5Label |
|
DeviceCustomString6 |
Tenant name. |
DeviceCustomString6Label |
|
Service status was changed
Event field name |
Field value |
DeviceAction |
|
DeviceExternalID |
Service ID. |
DeviceProcessName |
Service name. |
DeviceFacility |
Service type. |
DestinationAddress |
Address of the device where the service was started. |
DestinationHostName |
FQDN of the device where the service was started. |
DeviceCustomString1 |
|
DeviceCustomString1Label |
|
DeviceCustomString2 |
|
DeviceCustomString2Label |
|
DeviceCustomString5 |
Tenant ID. |
DeviceCustomString5Label |
|
DeviceCustomString6 |
Tenant name. |
DeviceCustomString6Label |
|
Storage partition was deleted automatically due to expiration
Event field name |
Field value |
DeviceAction |
|
EventOutcome |
|
Name |
Index name |
SourceServiceName |
|
Message |
|
Storage partition was deleted by user
Event field name |
Field value |
DeviceAction |
|
EventOutcome |
|
SourceTranslatedAddress |
This field contains the value of the HTTP header x-real-ip or x-forwarded-for. If these headers are absent, the field will be empty. |
SourceAddress |
The address from which the user logged in. If the user logged in using a proxy, there will be a proxy address. |
SourcePort |
Port from which the user logged in. If the user logged in using a proxy, there will be a port on the proxy side. |
SourceUserName |
User login that was used to delete partition. |
SourceUserID |
User ID that was used to delete partition. |
Name |
Index name. |
Message |
|
Active list was successfully cleared or operation failed
Audit events for active lists are created only for actions performed by users. Audit events are not generated when the active lists are modified using correlation rules. If you need to track such changes, you can do so using alerts.
The event can be assigned the succeeded or failed status.
Since the request to clear an active list is made over a remote connection, a data transfer error may occur at any moment: both before and after deletion.
This means that the active list may be cleared successfully, but the event is assigned the failed status, because EventOutcome returns the TCP/IP connection status of the request, but not the succeeded or failed status of the active list clearing.
Event field name |
Field value |
DeviceAction |
|
EventOutcome |
|
SourceTranslatedAddress |
This field contains the value of the HTTP header x-real-ip or x-forwarded-for. If these headers are absent, the field will be empty. |
SourceAddress |
The address from which the user logged in. If the user logged in using a proxy, there will be a proxy address. |
SourcePort |
Port from which the user logged in. If the user logged in using a proxy, there will be a port on the proxy side. |
SourceUserName |
User login that was used to clear the active list. |
SourceUserID |
User ID that was used to clear the active list. |
DeviceExternalID |
Service ID whose active list was cleared. |
ExternalID |
Active list ID. |
Name |
Active list name. |
Message |
If |
DeviceCustomString5 |
Service tenant ID. Some errors prevent adding tenant information to the event. |
DeviceCustomString5Label |
tenant ID |
DeviceCustomString6 |
Tenant name. |
DeviceCustomString6Label |
tenant name |
Active list item was successfully changed, or operation was unsuccessful
Audit events for active lists are created only for actions performed by users. Audit events are not generated when the active lists are modified using correlation rules. If you need to track such changes, you can do so using alerts.
The event can be assigned the succeeded or failed status.
Since the request to change an active list item is made over a remote connection, a data transfer error may occur at any moment: both before and after the change.
This means that the active list item may be changed successfully, but the event is assigned the failed status, because EventOutcome returns the TCP/IP connection status of the request, but not the succeeded or failed status of the active list item change.
Event field name |
Field value |
DeviceAction |
|
EventOutcome |
|
SourceTranslatedAddress |
This field contains the value of the HTTP header x-real-ip or x-forwarded-for. If these headers are absent, the field will be empty. |
SourceAddress |
The address from which the user logged in. If the user logged in using a proxy, there will be a proxy address. |
SourcePort |
Port from which the user logged in. If the user logged in using a proxy, there will be a port on the proxy side. |
SourceUserName |
User login used to change the active list item. |
SourceUserID |
User ID used to change the active list item. |
DeviceExternalID |
Service ID for which the active list is changed. |
ExternalID |
Active list ID. |
Name |
Active list name. |
DeviceCustomString1 |
Key name. |
DeviceCustomString1Label |
|
Message |
If EventOutcome = |
DeviceCustomString5 |
Service tenant ID. Some errors prevent adding tenant information to the event. |
DeviceCustomString5Label |
|
DeviceCustomString6 |
Tenant name |
DeviceCustomString6Label |
|
Active list item was successfully deleted or operation was unsuccessful
Audit events for active lists are created only for actions performed by users. Audit events are not generated when the active lists are modified using correlation rules. If you need to track such changes, you can do so using alerts.
The event can be assigned the succeeded or failed status.
Since the request to delete an active list item is made over a remote connection, a data transfer error may occur at any moment: both before and after deletion.
This means that the active list item may be deleted successfully, but the event is assigned the failed status, because EventOutcome returns the TCP/IP connection status of the request, but not the succeeded or failed status of the active list item deletion.
Event field name |
Field value |
DeviceAction |
|
EventOutcome |
|
SourceTranslatedAddress |
This field contains the value of the HTTP header x-real-ip or x-forwarded-for. If these headers are absent, the field will be empty. |
SourceAddress |
The address from which the user logged in. If the user logged in using a proxy, there will be a proxy address. |
SourcePort |
Port from which the user logged in. If the user logged in using a proxy, there will be a port on the proxy side. |
SourceUserName |
User login that was used to delete the item from the active list. |
SourceUserID |
User ID that was used to delete the item from the active list. |
DeviceExternalID |
Service ID whose active list was cleared. |
ExternalID |
Active list ID. |
Name |
Active list name. |
DeviceCustomString1 |
Key name. |
DeviceCustomString1Label |
|
Message |
If EventOutcome = |
DeviceCustomString5 |
Service tenant ID. Some errors prevent adding tenant information to the event. |
DeviceCustomString5Label |
|
DeviceCustomString6 |
Tenant name. |
DeviceCustomString6Label |
|
Active list was successfully imported or operation failed
Audit events for active lists are created only for actions performed by users. Audit events are not generated when the active lists are modified using correlation rules. If you need to track such changes, you can do so using alerts.
Active list items are imported in parts via a remote connection.
Since the import is performed via a remote connection, a data transfer error can occur at any time: when the data is imported partially or completely. EventOutcome returns the connection status, not the import status.
Event field name |
Field value |
DeviceAction |
|
EventOutcome |
|
SourceTranslatedAddress |
This field contains the value of the HTTP header x-real-ip or x-forwarded-for. If these headers are absent, the field will be empty. |
SourceAddress |
The address from which the user logged in. If the user logged in using a proxy, there will be a proxy address. |
SourcePort |
Port from which the user logged in. If the user logged in using a proxy, there will be a port on the proxy side. |
SourceUserName |
User login that was used to perform the import. |
SourceUserID |
User ID that was used to perform the import. |
DeviceExternalID |
Service ID for which an import was performed. |
ExternalID |
Active list ID. |
Name |
Active list name. |
Message |
If EventOutcome = |
DeviceCustomString5 |
Service tenant ID. Some errors prevent adding tenant information to the event. |
DeviceCustomString5Label |
|
DeviceCustomString6 |
Tenant name |
DeviceCustomString6Label |
|
Active list was exported successfully
Audit events for active lists are created only for actions performed by users. Audit events are not generated when the active lists are modified using correlation rules. If you need to track such changes, you can do so using alerts.
Event field name |
Field value |
DeviceAction |
|
EventOutcome |
|
SourceTranslatedAddress |
This field contains the value of the HTTP header x-real-ip or x-forwarded-for. If these headers are absent, the field will be empty. |
SourceAddress |
The address from which the user logged in. If the user logged in using a proxy, there will be a proxy address. |
SourcePort |
Port from which the user logged in. If the user logged in using a proxy, there will be a port on the proxy side. |
SourceUserName |
User login that was used to perform the export. |
SourceUserID |
User ID that was used to perform the export. |
DeviceExternalID |
Service ID for which an export was performed. |
ExternalID |
Active list ID. |
Name |
Active list name. |
DeviceCustomString5 |
Service tenant ID. Some errors prevent adding tenant information to the event. |
DeviceCustomString5Label |
|
DeviceCustomString6 |
Tenant name |
DeviceCustomString6Label |
|
Resource was successfully added
Event field name |
Field value |
DeviceAction |
|
EventOutcome |
|
SourceTranslatedAddress |
This field contains the value of the HTTP header x-real-ip or x-forwarded-for. If these headers are absent, the field will be empty. |
SourceAddress |
The address from which the user logged in. If the user logged in using a proxy, there will be a proxy address. |
SourcePort |
Port from which the user logged in. If the user logged in using a proxy, there will be a port on the proxy side. |
SourceUserName |
User login that was used to add the resource. |
SourceUserID |
User ID that was used to add the resource. |
DeviceExternalID |
Resource ID. |
DeviceProcessName |
Resource name. |
DeviceFacility |
Resource type:
|
DeviceCustomString5 |
Tenant ID. |
DeviceCustomString5Label |
|
DeviceCustomString6 |
Tenant name. |
DeviceCustomString6Label |
|
Resource was successfully deleted
Event field name |
Field value |
DeviceAction |
|
EventOutcome |
|
SourceTranslatedAddress |
This field contains the value of the HTTP header x-real-ip or x-forwarded-for. If these headers are absent, the field will be empty. |
SourceAddress |
The address from which the user logged in. If the user logged in using a proxy, there will be a proxy address. |
SourcePort |
Port from which the user logged in. If the user logged in using a proxy, there will be a port on the proxy side. |
SourceUserName |
User login that was used to delete the resource. |
SourceUserID |
User ID that was used to delete the resource. |
DeviceExternalID |
Resource ID. |
DeviceProcessName |
Resource name. |
DeviceFacility |
Resource type:
|
DeviceCustomString5 |
Tenant ID. |
DeviceCustomString5Label |
|
DeviceCustomString6 |
Tenant name. |
DeviceCustomString6Label |
|
Resource was successfully updated
Event field name |
Field value |
DeviceAction |
|
EventOutcome |
|
SourceTranslatedAddress |
This field contains the value of the HTTP header x-real-ip or x-forwarded-for. If these headers are absent, the field will be empty. |
SourceAddress |
The address from which the user logged in. If the user logged in using a proxy, there will be a proxy address. |
SourcePort |
Port from which the user logged in. If the user logged in using a proxy, there will be a port on the proxy side. |
SourceUserName |
User login that was used to update the resource. |
SourceUserID |
User ID that was used to update the resource. |
DeviceExternalID |
Resource ID. |
DeviceProcessName |
Resource name. |
DeviceFacility |
Resource type:
|
DeviceCustomString5 |
Tenant ID. |
DeviceCustomString5Label |
|
DeviceCustomString6 |
Tenant name. |
DeviceCustomString6Label |
|
Asset was successfully created
Event field name |
Field value |
DeviceAction |
|
EventOutcome |
|
SourceTranslatedAddress |
This field contains the value of the HTTP header x-real-ip or x-forwarded-for. If these headers are absent, the field will be empty. |
SourceAddress |
The address from which the user logged in. If the user logged in using a proxy, there will be a proxy address. |
SourcePort |
Port from which the user logged in. If the user logged in using a proxy, there will be a port on the proxy side. |
SourceUserName |
User login that was used to add the asset. |
SourceUserID |
User ID that was used to add the asset. |
DeviceExternalID |
Asset ID. |
SourceHostName |
Asset ID. |
Name |
Asset name. |
DeviceCustomString1 |
Comma-separated IP addresses of the asset. |
DeviceCustomString1Label |
|
DeviceCustomString5 |
Tenant ID. |
DeviceCustomString5Label |
|
DeviceCustomString6 |
Tenant name. |
DeviceCustomString6Label |
|
Asset was successfully deleted
Event field name |
Field value |
DeviceAction |
|
EventOutcome |
|
SourceTranslatedAddress |
This field contains the value of the HTTP header x-real-ip or x-forwarded-for. If these headers are absent, the field will be empty. |
SourceAddress |
The address from which the user logged in. If the user logged in using a proxy, there will be a proxy address. |
SourcePort |
Port from which the user logged in. If the user logged in using a proxy, there will be a port on the proxy side. |
SourceUserName |
User login that was used to add the asset. |
SourceUserID |
User ID that was used to add the asset. |
DeviceExternalID |
Asset ID. |
SourceHostName |
Asset ID. |
Name |
Asset name. |
DeviceCustomString1 |
Comma-separated IP addresses of the asset. |
DeviceCustomString1Label |
|
DeviceCustomString5 |
Tenant ID. |
DeviceCustomString5Label |
|
DeviceCustomString6 |
Tenant name. |
DeviceCustomString6Label |
|
Asset category was successfully added
Event field name |
Field value |
DeviceAction |
|
EventOutcome |
|
SourceTranslatedAddress |
This field contains the value of the HTTP header x-real-ip or x-forwarded-for. If these headers are absent, the field will be empty. |
SourceAddress |
The address from which the user logged in. If the user logged in using a proxy, there will be a proxy address. |
SourcePort |
Port from which the user logged in. If the user logged in using a proxy, there will be a port on the proxy side. |
SourceUserName |
User login that was used to add the category. |
SourceUserID |
User ID that was used to add the category. |
DeviceExternalID |
Category ID. |
Name |
Category name. |
DeviceCustomString5 |
Tenant ID. |
DeviceCustomString5Label |
|
DeviceCustomString6 |
Tenant name. |
DeviceCustomString6Label |
|
Asset category was deleted successfully
Event field name |
Field value |
DeviceAction |
|
EventOutcome |
|
SourceTranslatedAddress |
This field contains the value of the HTTP header x-real-ip or x-forwarded-for. If these headers are absent, the field will be empty. |
SourceAddress |
The address from which the user logged in. If the user logged in using a proxy, there will be a proxy address. |
SourcePort |
Port from which the user logged in. If the user logged in using a proxy, there will be a port on the proxy side. |
SourceUserName |
User login that was used to delete the category. |
SourceUserID |
User ID that was used to delete the category. |
DeviceExternalID |
Category ID. |
Name |
Category name. |
DeviceCustomString5 |
Tenant ID. |
DeviceCustomString5Label |
|
DeviceCustomString6 |
Tenant name. |
DeviceCustomString6Label |
|
Settings were updated successfully
Event field name |
Field value |
DeviceAction |
|
EventOutcome |
|
SourceTranslatedAddress |
This field contains the value of the HTTP header x-real-ip or x-forwarded-for. If these headers are absent, the field will be empty. |
SourceAddress |
The address from which the user logged in. If the user logged in using a proxy, there will be a proxy address. |
SourcePort |
Port from which the user logged in. If the user logged in using a proxy, there will be a port on the proxy side. |
SourceUserName |
User login that was used to update the settings. |
SourceUserID |
User ID that was used to update the settings. |
DeviceFacility |
Type of settings. |
DeviceCustomString5 |
Tenant ID. |
DeviceCustomString5Label |
|
DeviceCustomString6 |
Tenant name. |
DeviceCustomString6Label |
|
Updated data retention policy after changing drives
Event field name |
Field value |
DeviceAction |
|
EventOutcome |
|
SourceTranslatedAddress |
This field contains the value of the HTTP header x-real-ip or x-forwarded-for. If these headers are absent, the field will be empty. |
SourceAddress |
The address from which the user logged in. If the user logged in using a proxy, there will be a proxy address. |
SourcePort |
Port from which the user logged in. If the user logged in using a proxy, there will be a port on the proxy side. |
SourceUserName |
User login that was used to change the tenant data. |
SourceUserID |
User ID that was used to change the tenant data. |
The dictionary was successfully updated on the service or operation was unsuccessful
Event field name |
Field value |
DeviceAction |
|
EventOutcome |
|
SourceTranslatedAddress |
This field contains the value of the HTTP header x-real-ip or x-forwarded-for. If these headers are absent, the field will be empty. |
SourceAddress |
The address from which the user logged in. If the user logged in using a proxy, there will be a proxy address. |
SourcePort |
Port from which the user logged in. If the user logged in using a proxy, there will be a port on the proxy side. |
SourceUserName |
User login that was used to create the service. |
SourceUserID |
User ID that was used to create the service. |
DeviceExternalID |
Service ID. |
ExternalID |
Dictionary ID. |
DeviceProcessName |
Service name. |
DeviceFacility |
Service type. |
DeviceCustomString5 |
Tenant ID. |
DeviceCustomString5Label |
|
DeviceCustomString6 |
Tenant name. |
DeviceCustomString6Label |
|
Message |
If EventOutcome = |
Request sent to KIRA
Event field name |
Field value |
DeviceAction |
|
EventOutcome |
|
SourceUserName |
User login used to send the request. |
SourceUserID |
User ID used to send the request. |
DeviceCustomString1 |
The resulting string that was sent. |
DeviceCustomString1Label |
|
DeviceCustomString2 |
ID of the event from which the request was sent. |
DeviceCustomString2Label |
|
DeviceCustomString3 |
ID of the task created to send the request. |
DeviceCustomString3Label |
|
Response in Active Directory
Event field name |
Field value |
DeviceAction |
|
DeviceFacility |
|
EventOutcome |
|
SourceTranslatedAddress |
This field contains the value of the HTTP header x-real-ip or x-forwarded-for. If these headers are absent, the field will be empty. |
SourceAddress |
The address from which the user logged in. If the user logged in using a proxy, there will be a proxy address. |
SourcePort |
Port from which the user logged in. If the user logged in using a proxy, there will be a port on the proxy side. |
SourceUserName |
User login that was used to change the tenant data. |
SourceUserID |
User ID that was used to change the tenant data. |
DeviceCustomString3 |
Response rule name: CHANGE_PASSWORD, ADD_TO_GROUP, REMOVE_FROM_GROUP, BLOCK_USER. |
DeviceCustomString3Label |
|
DeviceCustomString5 |
Tenant ID. |
DeviceCustomString5Label |
|
DeviceCustomString6 |
Tenant name. |
DeviceCustomString6Label |
|
DestinationUserName |
The Active Directory user account to which the response is invoked (sAMAccountName). |
DestinationNtDomain |
Domain of the Active Directory user account to which the response is invoked. |
DestinatinUserID |
Account UUID in KUMA. |
FlexString1 |
Information about the group where the user was added or deleted. |
FlexString1Label |
|
Response via KICS for Networks
Event field name |
Field value |
DeviceAction |
|
DeviceFacility |
|
EventOutcome |
|
SourceTranslatedAddress |
This field contains the value of the HTTP header x-real-ip or x-forwarded-for. If these headers are absent, the field will be empty. |
SourceAddress |
The address from which the user logged in. If the user logged in using a proxy, there will be a proxy address. |
SourcePort |
Port from which the user logged in. If the user logged in using a proxy, there will be a port on the proxy side. |
SourceUserName |
Login of the user who sent the request. |
SourceUserID |
ID of the user who sent the request. |
DeviceCustomString3 |
Response rule name: |
DeviceCustomString3Label |
|
DeviceCustomString5 |
Tenant ID. |
DeviceCustomString5Label |
|
DeviceCustomString6 |
Tenant name. |
DeviceCustomString6Label |
|
DeviceExternalID |
Asset ID. |
SourceHostName |
Asset FQDN. |
Name |
Asset name. |
DeviceCustomString1 |
List of IP addresses for the asset. |
DeviceCustomString1Label |
|
Kaspersky Automated Security Awareness Platform response
Event field name |
Field value |
DeviceAction |
|
DeviceFacility |
|
EventOutcome |
|
Message |
Description of the error, if an error occurred, otherwise the field is empty. |
SourceTranslatedAddress |
This field contains the value of the HTTP header x-real-ip or x-forwarded-for. If these headers are absent, the field will be empty. |
SourceAddress |
The address from which the user logged in. If the user logged in using a proxy, there will be a proxy address. |
SourcePort |
Port from which the user logged in. If the user logged in using a proxy, there will be a port on the proxy side. |
SourceUserName |
Login of the user who sent the request. |
SourceUserID |
ID of the user who sent the request. |
DeviceCustomString1 |
The manager of the user to whom the course is assigned. |
DeviceCustomString1Label |
|
DeviceCustomString3 |
Information about the group where the user belonged. Not available for |
DeviceCustomString3Label |
|
DeviceCustomString4 |
Information about the group where the user was added. |
DeviceCustomString4Label |
|
DeviceCustomString5 |
Tenant ID. |
DeviceCustomString5Label |
|
DeviceCustomString6 |
Tenant name. |
DeviceCustomString6Label |
|
DestinationUserID |
ID of the Active Directory user account which causes the response. |
DestinationUserName |
Account name (sAMAccountName). |
DestinationNtDomain |
Domain of the Active Directory user account which causes the response. |
KEDR response
Event field name |
Field value |
DeviceAction |
|
DeviceFacility |
|
EventOutcome |
|
Message |
Description of the error, if an error occurred, otherwise the field is empty. |
SourceTranslatedAddress |
This field contains the value of the HTTP header x-real-ip or x-forwarded-for. If these headers are absent, the field will be empty. |
SourceAddress |
The address from which the user logged in. If the user logged in using a proxy, there will be a proxy address. |
SourcePort |
Port from which the user logged in. If the user logged in using a proxy, there will be a port on the proxy side. |
SourceUserName |
Login of the user who sent the request. |
SourceUserID |
ID of the user who sent the request. |
SourceAssetID |
KUMA asset ID which causes the response. The value is not specified if the response is based on a hash or for all assets. |
DeviceExternalID |
The external ID assigned to KUMA in KEDR. If there is only one external ID, it is not filled in when started on user hosts. |
DeviceCustomString1 |
List of IP/FQDN addresses of the asset for the host prevention rule based on the selected hash from the event card. |
DeviceCustomString1Label |
|
DeviceCustomString2 |
Sensor ID parameter in KEDR (UUIDv4 | 'all' | 'custom'). |
DeviceCustomString2Label |
|
ServiceID |
ID of the service that caused the response. Filled in only in case of automatic response. |
DeviceCustomString3 |
Task type name: |
DeviceCustomString3Label |
|
DeviceCustomString5 |
Tenant ID. |
DeviceCustomString5Label |
|
DeviceCustomString6 |
Tenant name. |
DeviceCustomString6Label |
|
Correlation rules
The file that can be downloaded by clicking the link describes the correlation rules that are included in the distribution kit. It provides the scenarios covered by rules, the conditions of their use, and the necessary sources of events.
The correlation rules described in this document are contained in the SOC_package file in the OSMP distribution kit; the password for the file is SOC_package1. Only one version of the SOC rule set can be used at a time: either Russian or English.
You can add imported correlation rules to correlators that your organization uses. Refer to the following topic for details: Step 3. Correlation.
To import the correlation rule package into KUMA:
- In KUMA Console, go to Settings → Repository update, and then set the Update source parameter to Kaspersky update servers.
You can also configure the repository update.
- Click Run update to save the update settings and manually start the Repository update task.
- Go to Task manager to ensure that the Repository update task is completed.
- Go to Resources, and then click Import resources.
- In the Resource import window, select the tenant to assign the imported resources to.
- In the Import source drop-down list, select Repository, select the SOC Content package, and then click Import.
The resources from the SOC Content package are imported to KUMA. For more information about importing, refer to Importing resources.
Download the description of correlation rules contained in the SOC_package.xlsx file.
Page top
Time format
KUMA supports processing information passed to the fields of the event data model with the timestamp type (EndTime, StartTime, DeviceCustomDate1, etc) in the following formats:
- "May 8, 2009 5:57:51 PM",
- "oct 7, 1970",
- "oct 7, '70",
- "oct. 7, 1970",
- "oct. 7, 70",
- "Mon Jan 2 15:04:05 2006",
- "Mon Jan 2 15:04:05 MST 2006",
- "Mon Jan 02 15:04:05 -0700 2006",
- "Monday, 02-Jan-06 15:04:05 MST",
- "Mon, 02 Jan 2006 15:04:05 MST",
- "Tue, 11 Jul 2017 16:28:13 +0200 (CEST)",
- "Mon, 02 Jan 2006 15:04:05 -0700",
- "Mon 30 Sep 2018 09:09:09 PM UTC",
- "Mon Aug 10 15:44:11 UTC+0100 2015",
- "Thu, 4 Jan 2018 17:53:36 +0000",
- "Fri Jul 03 2015 18:04:07 GMT+0100 (GMT Daylight Time)",
- "Sun, 3 Jan 2021 00:12:23 +0800 (GMT+08:00)",
- "September 17, 2012 10:09am",
- "September 17, 2012 at 10:09am PST-08",
- "September 17, 2012, 10:10:09",
- "October 7, 1970",
- "October 7th, 1970",
- "12 Feb 2006, 19:17",
- "12 Feb 2006 19:17",
- "14 May 2019 19:11:40.164",
- "7 oct 70",
- "7 oct 1970",
- "03 February 2013",
- "1 July 2013",
- "2013-Feb-03".
dd/Mon/yyyy format
- "06/Jan/2008:15:04:05 -0700",
- "06/Jan/2008 15:04:05 -0700".
mm/dd/yyyy format
- "3/31/2014",
- "03/31/2014",
- "08/21/71",
- "8/1/71",
- "4/8/2014 22:05",
- "04/08/2014 22:05",
- "4/8/14 22:05",
- "04/2/2014 03:00:51",
- "8/8/1965 12:00:00 AM",
- "8/8/1965 01:00:01 PM",
- "8/8/1965 01:00 PM",
- "8/8/1965 1:00 PM",
- "8/8/1965 12:00 AM",
- "4/02/2014 03:00:51",
- "03/19/2012 10:11:59",
- "03/19/2012 10:11:59.3186369".
yyyy/mm/dd format
- "2014/3/31",
- "2014/03/31",
- "2014/4/8 22:05",
- "2014/04/08 22:05",
- "2014/04/2 03:00:51",
- "2014/4/02 03:00:51",
- "2012/03/19 10:11:59",
- "2012/03/19 10:11:59.3186369".
yyyy:mm:dd format
- "2014:3:31",
- "2014:03:31",
- "2014:4:8 22:05",
- "2014:04:08 22:05",
- "2014:04:2 03:00:51",
- "2014:4:02 03:00:51",
- "2012:03:19 10:11:59",
- "2012:03:19 10:11:59.3186369".
Format containing Chinese characters
"2014年04月08日"
yyyy-mm-ddThh format
- "2006-01-02T15:04:05+0000",
- "2009-08-12T22:15:09-07:00",
- "2009-08-12T22:15:09",
- "2009-08-12T22:15:09.988",
- "2009-08-12T22:15:09Z",
- "2017-07-19T03:21:51:897+0100",
- "2019-05-29T08:41-04" without seconds, 2-character TZ.
yyyy-mm-dd hh:mm:ss format
- "2014-04-26 17:24:37.3186369",
- "2012-08-03 18:31:59.257000000",
- "2014-04-26 17:24:37.123",
- "2013-04-01 22:43",
- "2013-04-01 22:43:22",
- "2014-12-16 06:20:00 UTC",
- "2014-12-16 06:20:00 GMT",
- "2014-04-26 05:24:37 PM",
- "2014-04-26 13:13:43 +0800",
- "2014-04-26 13:13:43 +0800 +08",
- "2014-04-26 13:13:44 +09:00",
- "2012-08-03 18:31:59.257000000 +0000 UTC",
- "2015-09-30 18:48:56.35272715 +0000 UTC",
- "2015-02-18 00:12:00 +0000 GMT",
- "2015-02-18 00:12:00 +0000 UTC",
- "2015-02-08 03:02:00 +0300 MSK m=+0.000000001",
- "2015-02-08 03:02:00.001 +0300 MSK m=+0.000000001",
- "2017-07-19 03:21:51+00:00",
- "2014-04-26",
- "2014-04",
- "2014",
- "2014-05-11 08:20:13,787".
yyyy-mm-dd-07:00 format
"2020-07-20+08:00"
mm.dd.yyyy format
- "3.31.2014",
- "03.31.2014",
- "08.21.71".
yyyy.mm.dd format
"2014.03.30"
yyyymmdd format and similar
- "20140601",
- "20140722105203".
yymmdd hh:mm:yy format
"171113 14:14:20"
Unix timestamp format
- "1332151919",
- "1384216367189",
- "1384216367111222",
- "1384216367111222333".
Mapping fields of predefined normalizers
The file available via the download link contains a description of the field mapping of preset normalizers.
Download Description of field mapping of preset normalizers.ZIP
Page topGlossary
Administrator host
A physical or virtual machine that is used to deploy and manage the Kubernetes cluster and Kaspersky Next XDR Expert by using KDT. KDT runs on the administrator host. If the administrator host is not included in the Kubernetes cluster, it will be used only for deployment. If the administrator host is included in the cluster, it will also act as a target host that is used for operation of Kaspersky Next XDR Expert components.
Agent
A KUMA service that is used to receive events on remote devices and forward them to KUMA collectors.
Alert
An event in the organization's IT infrastructure that was marked by Open Single Management Platform as unusual or suspicious, and that may pose a threat to the security of the organization's IT infrastructure.
Asset
A device or user of the infrastructure to be protected. If an alert or incident is detected on an asset, you can perform response actions for this asset.
Bootstrap
The basic execution environment that includes the Kubernetes cluster and infrastructure components for the function of Kaspersky Next XDR Expert. Bootstrap is included in the transport archive and it is automatically installed the during deployment of Kaspersky Next XDR Expert.
Collector
A KUMA service that receives messages from event sources, processes them, and then transmits them to a storage, correlator, and/or third-party services to identify alerts.
Configuration file
A file in the YAML format that contains the list of target hosts for the Kaspersky Next XDR Expert deployment and a set of installation parameters of the Kaspersky Next XDR Expert components. Configuration file is used by KDT.
Context
A set of access parameters that define the Kubernetes cluster that the user can select to interact with. The context also includes data for connecting to the cluster by using KDT.
Correlation rule
A KUMA resource used to recognize the defined sequences of processed events and perform specific actions after recognition.
Correlator
A KUMA service that analyzes normalized events.
Custom actions
KDT commands that allows you to perform additional operations specific to the Kaspersky Next XDR Expert components (except installation, update, deletion).
Distribution package
An archive that contains the transport archive with Kaspersky Next XDR Expert components and End User License Agreements for Kaspersky Next XDR Expert and KDT, as well as the archive with the KDT utility and templates of the configuration file and KUMA inventory file.
Event
Information security events registered on the monitored elements of the organization's IT infrastructure. For example, events include login attempts, interactions with a database, and sensor information broadcasts. Each separate event may seem uninformative, but when considered together they form a bigger picture of network activities to help identify security threats.
Incident
A container of alerts that normally indicates a true positive issue in the organization's IT infrastructure. An incident may contain a single or several alerts. By using incidents, analysts can investigate multiple alerts as a single issue.
Investigation graph
A visual analysis tool that shows the relationships between events, alerts, incidents, observables, and assets (devices). Also, the investigation graph displays the details for an incident: the corresponding alerts, users, assets and their common properties.
Kaspersky Deployment Toolkit
A utility used to deploy and manage a Kubernetes cluster, Kaspersky Next XDR Expert components, and management web plug-ins. KDT runs on the administrator host and connects to target hosts via SSH.
Kubernetes cluster
A set of hosts combined by means of Kubernetes into one computing resource. The Kubernetes cluster is used for the function of Kaspersky Next XDR Expert components (except for KUMA services). The Kubernetes cluster can include both target hosts and the administrator host.
KUMA inventory file
A file in the YAML format that contains the parameters for installation of the KUMA services that are not included in the Kubernetes cluster. The path to the KUMA inventory file is included in the configuration file that is used by KDT for the Kaspersky Next XDR Expert deployment.
KUMA services
The main components of KUMA that help the system to manage events. Services allow you to receive events from event sources and subsequently bring them to a common form that is convenient for finding correlation, as well as for storage and manual analysis. KUMA services are agents, collectors, correlators, and storages that are installed on the hosts that are located outside the Kubernetes cluster.
Multitenancy
A mode that enables the main administrator to provide the Kaspersky Next XDR Expert functionality to multiple clients independently, or to separate assets, application settings, and objects for different offices. Also the multitenancy mode allows you to copy and inherit tenant settings and objects from the parent tenant and automatically apply a license key for Kaspersky Next XDR Expert to all of the tenants in the hierarchy.
Network Agent
An Open Single Management Platform component that enables interaction between the Administration Server and Kaspersky applications that are installed on a specific network node (workstation or server). This component is common to all of the company's applications for Microsoft Windows. Separate versions of Network Agent exist for Kaspersky applications developed for Unix-like OS and macOS.
Node
A physical or virtual machine on which Kaspersky Next XDR Expert is deployed. There are primary and worker nodes. The primary node is intended for managing the cluster, storing metadata, and distributing of the workload. The worker nodes are intended for performing the workload of the Kaspersky Next XDR Expert components.
Normalized event
An event that is processed in accordance with the KUMA normalized event data model.
Observables
Objects related to the alert and incident, such as MD5 and SHA256 hashes, IP address, URL, Domain name, UserName, or HostName.
Playbook
An object that responds to alerts or incidents according to the specified algorithm (playbook algorithm). Playbooks allow you to automate workflows and reduce the time it takes to process alerts and incidents.
Playbook algorithm
An algorithm that includes a sequence of response actions that help analyze and handle alerts or incidents.
Registry
Infrastructure component that stores the application containers and is used for the installation and storing of the Kaspersky Next XDR Expert components.
Response actions
Actions that are launched within playbooks.
Segmentation rules
Rules that allow you to automatically split related alerts into different incidents based on specified conditions.
Storage
A KUMA service that is used to store normalized events so that they can be quickly and continually accessed from KUMA for the purpose of extracting analytical data.
Target hosts
Physical or virtual machines that are used to deploy Kaspersky Next XDR Expert. Target hosts are included in the Kubernetes cluster. The Kaspersky Next XDR Expert components work on these hosts.
Tenant
A logical entity that corresponds to an organization unit (a client or an office) to which the Kaspersky Next XDR Expert functionality is provided. Each tenant can include assets, users and their access rights, events, alerts, incidents, playbooks, and integration with other Kaspersky applications, services, and third-party solutions. Also a tenant defines a set of available operations on the included objects.
Threat development chain
A series of steps that trace the stages of a cyber attack. Threat development chain allows you to analyze the reasons of the threat. To create a threat development chain, the managed application transfers data from the device to Administration Server through Network Agent.
Transport archive
An archive that contains Kaspersky Next XDR Expert components, management web plug-ins, and End User License Agreements for Kaspersky Next XDR Expert and KDT. The transport archive is included in the distribution package.
Page top
Information about third-party code
Information about third-party code is contained in the files legal_notices_ksmp.txt and legal_notices_kuma.txt on the device that acts as an operator node. The files are located in the /home/kdt/ directory of the user that runs the deployment of Kaspersky Next XDR Expert.
Page top
Trademark notices
Registered trademarks and service marks are the property of their respective owners.
Adobe, Flash, PostScript are either registered trademarks or trademarks of Adobe in the United States and/or other countries.
AMD, AMD64 are trademarks or registered trademarks of Advanced Micro Devices, Inc.
Amazon, Amazon EC2, Amazon Web Services, AWS, and AWS Marketplace are trademarks of Amazon.com, Inc. or its affiliates.
Apache, and Apache Cassandra are either registered trademarks or trademarks of the Apache Software Foundation.
Apple, App Store, AppleScript, Carbon, FileVault, iPhone, Mac, Mac OS, macOS, OS X, Safari and QuickTime are trademarks of Apple Inc.
Arm is a registered trademark of Arm Limited (or its subsidiaries) in the US and/or elsewhere.
The Bluetooth word, mark and logos are owned by Bluetooth SIG, Inc.
LTS, and Ubuntu are registered trademarks of Canonical Ltd.
Check Point NGFW is a trademark or registered trademark of Check Point Software Technologies Ltd. or its affiliates.
Cisco, IOS, and Snort are registered trademarks or trademarks of Cisco Systems, Inc. and/or its affiliates in the United States and certain other countries.
Citrix, XenServer are either registered trademarks or trademarks of Cloud Software Group, Inc., and/or its subsidiaries in the United States and/or other countries.
Citrix NetScaler is either a registered trademark or a trademark of Cloud Software Group, Inc., and/or its subsidiaries in the United States and/or other countries.
Cloudflare, the Cloudflare logo, and Cloudflare Workers are trademarks and/or registered trademarks of Cloudflare, Inc. in the United States and other jurisdictions.
The Grafana Word Mark and Grafana Logo are either registered trademarks/service marks or trademarks/service marks of Coding Instinct AB, in the United States and other countries and are used with Coding Instinct’s permission. We are not affiliated with, endorsed or sponsored by Coding Instinct, or the Grafana community.
CorelDRAW is a trademark or registered trademark of Corel Corporation and/or its subsidiaries in Canada, the United States and/or other countries.
Docker and the Docker logo are trademarks or registered trademarks of Docker, Inc. in the United States and/or other countries. Docker, Inc. and other parties may also have trademark rights in other terms used herein.
Elasticsearch is a trademark of Elasticsearch BV, registered in the U.S. and in other countries.
F5 is a trademark of F5 Networks, Inc. in the U.S. and in certain other countries.
Firebird is a registered trademark of the Firebird Foundation.
Fortinet, FortiGate, FortiMail, FortiSOAR are either registered trademarks or trademarks of Fortinet, Inc. in the United States and/or other countries.
FreeBSD is a registered trademark of The FreeBSD Foundation.
Google, Android, Chrome, Dalvik, Firebase, Google Chrome, Google Maps, Google Play, Google Public DNS are trademarks of Google LLC.
HUAWEI, EulerOS, Huawei Eudemon are trademarks of Huawei Technologies Co., Ltd.
ViPNet is a registered trademark of Infotecs.
IBM, Guardium, InfoSphere, QRadar are trademarks of International Business Machines Corporation, registered in many jurisdictions worldwide.
Intel, Insider are trademarks of Intel Corporation or its subsidiaries.
Node.js is a trademark of Joyent, Inc.
Juniper, Juniper Networks, and JUNOS are trademarks or registered trademarks of Juniper Networks, Inc. in the United States and other countries.
Linux is the registered trademark of Linus Torvalds in the U.S. and other countries.
Kubernetes is a registered trademark of The Linux Foundation in the United States and other countries.
Microsoft, Access, Active Directory, ActiveSync, ActiveX, BitLocker, Excel, Halo, Hyper-V, InfoPath, Internet Explorer, Lync, Microsoft Edge, MS-DOS, MultiPoint, Office 365, OneNote, Outlook, PowerPoint, PowerShell, Segoe, SharePoint, Skype, SQL Server, Tahoma, Visio, Win32, Windows, Windows Media, Windows Mobile, Windows Phone, Windows PowerShell, Windows Server, and Windows Vista are trademarks of the Microsoft group of companies.
CVE is a registered trademark of The MITRE Corporation.
Mozilla, Firefox are trademarks of the Mozilla Foundation in the U.S. and other countries.
NetApp is a trademark or a registered trademark of NetApp, Inc. in the United States and/or other countries.
Netskope, the Netskope logo, and other Netskope product names referenced herein are trademarks of Netskope, Inc. and/or one of its subsidiaries, and may be registered in the United States Patent and Trademark Office and in other countries.
NetWare is a registered trademark of Novell Inc. in the United States and other countries.
Novell is a registered trademark of Novell Enterprises Inc. in the United States and other countries.
OpenSSL is a trademark owned by the OpenSSL Software Foundation.
Oracle, Java, and JavaScript are registered trademarks of Oracle and/or its affiliates.
OpenVPN is a registered trademark of OpenVPN, Inc.
Parallels, the Parallels logo, and Coherence are trademarks or registered trademarks of Parallels International GmbH.
PROOFPOINT is a trademark of Proofpoint, Inc. in the U.S. and other countries.
Chef is a trademark or registered trademark of Progress Software Corporation and/or one of its subsidiaries or affiliates in the U.S. and/or other countries.
Puppet is a trademark or registered trademark of Puppet, Inc.
Python is a trademark or registered trademark of the Python Software Foundation.
Ansible is a registered trademark of Red Hat, Inc. in the United States and other countries.
Red Hat, CentOS, Fedora, Red Hat Enterprise Linux are trademarks or registered trademarks of Red Hat, Inc. or its subsidiaries in the United States and other countries.
The Trademark BlackBerry is owned by Research In Motion Limited and is registered in the United States and may be pending or registered in other countries.
Samsung is a trademark of SAMSUNG in the United States or other countries.
Sendmail and other names and product names are trademarks or registered trademarks of Sendmail, Inc.
Debian is a registered trademark of Software in the Public Interest, Inc.
Dameware is a trademark of SolarWinds Worldwide, LLC, registered in the U.S. and other countries.
Splunk is a trademark and registered trademark of Splunk Inc. in the United States and other countries.
The CommuniGate Pro name is a trademark or registered trademark of Stalker Software, Inc.
SUSE is a registered trademark of SUSE LLC in the United States and other countries.
Symantec is a trademark or registered trademark of Symantec Corporation or its affiliates in the U.S. and other countries.
Symbian trademark is owned by the Symbian Foundation Ltd.
OpenAPI is a trademark of The Linux Foundation.
Rocky Linux is a trademark of The Rocky Enterprise Software Foundation.
Trend Micro is a trademark or registered trademark of Trend Micro Incorporated.
The names, images, logos and pictures identifying UserGate's products and services are proprietary marks of UserGate and/or its subsidiaries or affiliates, and the products themselves are proprietary to UserGate.
VMware, VMware ESXi, VMware Horizon, VMware vCenter, VMware vSphere, VMware Workstation, Carbon Black are registered trademarks and/or trademarks of VMware, Inc. in the United States and other countries.
UNIX is a registered trademark in the United States and other countries, licensed exclusively through X/Open Company Limited.
ClickHouse is a trademark of YANDEX LLC.
Zabbix is a registered trademark of Zabbix SIA.
Page top